Michigan’s Energy Production Needs to Shift Toward Renewable Sources

While the types of energy consumed in Michigan vary amongst sources, the energy produced in Michigan is much more limited. For example, no coal powered energy is produced in Michigan. Rather, the coal consumed in the state is brought in from other states, particularly those west of Michigan, on railways.

The information provided in this post from the U.S. Energy Information Administration.

At one point, natural gas was the largest energy source in Michigan, reaching its peak production at 312 trillion BTUs in 2000. Since then, the amount of natural gas produced in Michigan has steadily declined. Between 2007 and 2008 the amount of natural gas produced in Michigan declined from 275 trillion BTUs to 162 trillion BTUs. In 2016, 107 trillion BTUs of natural gas energy was produced.

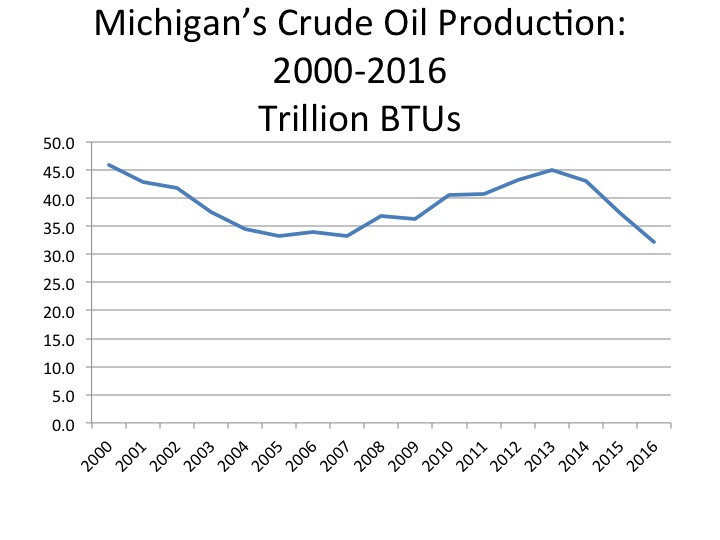
Crude oil production has ranged between 45 and 32 trillion BTUs since 2000, with various peaks and valleys between then and 2016. According to the Energy Information Administration (EIA), Michigan ranks 19th out of the 50 states for crude oil production. In 2016, 32.1 trillion BTUs of crude oil was produced. This is a decrease from the 45.9 trillion BTUs produced in 2000.

Crude oil production in the state comes from reserves; in 2017 about 5.4 million barrels of crude oil were produced compared to the 34.7 million barrels that were produced in 1979. Please note the chart references BTUs, while barrels of crude oil is another measurement used to detail production of this energy source.

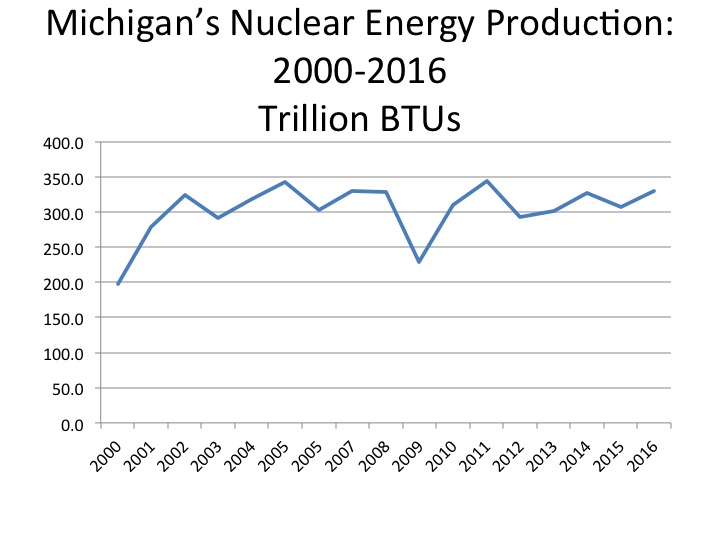
Nuclear energy is the energy source that is produced the most in Michigan. In 2016 there were 330 trillion BTUs produced, up from the 200 produced in 2000. There are three nuclear power plants in Michigan, which produce about 30 percent of the electricity used in the state. While there have been some changes in the amount of nuclear energy produced in Michigan, it has remained at around 325 trillion BTU average for the last 15 years.

The amount of renewable energy produced in Michigan, both from biofuels and other sources, has grown since 2000, but none of those sources total the amount of energy produced by the state’s natural gas or nuclear energy sources. For biofuels, in 2002 there was zero energy production by this source. Since then it has increased to 37.7 trillion BTUs. For other renewable energy sources, which include wind, solar and hydroelectric energy, there has been a slow increase in production, with somewhat of a spike in 2014. In 2014 there were 164 trillion BTUs of renewable energy produced in Michigan; in 2016 there were 156.9 trillion BTUs.

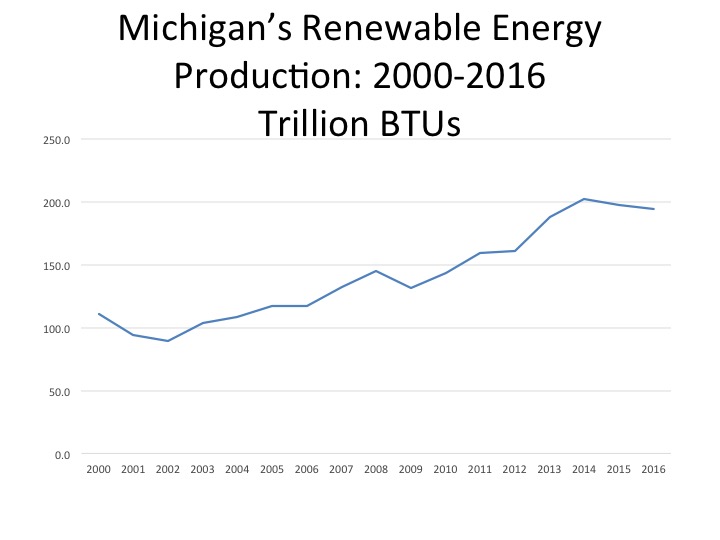
The production of renewable energy in Michigan has been increasing since 2000, although there has been a slight decline in such production since 2014. In 2014, 202.2 trillion BTUs of renewable energy were produced in Michigan, and in 2016 that number slightly decreased to 194.6. However, the 2016 production rate is almost double the amount of renewable energy that that was being produced in 2000; in 2000 110.5 trillion BTUs of renewable energy was produced.

In the state of Michigan, the types of energy that make up renewable energy include biomass, solar, wind, geothermal and hydroelectric energy. Despite increases in consumption, carbon-based energy sources are still consumed far more than renewable energy sources.

While the production of carbon-based energy sources in Michigan is far less than the amount consumed, there is still clearly a heavy reliance on these energy sources. Additionally, renewable energy is consumed more in Michigan than produced (click here to view consumption rates in our last post). With carbon-based energy source consumption and renewable energy source consumption both outweighing the amount produced in the state, it would make sense, on multiple levels, for energy policies to shift toward further encouragement, and enforcement, of creating more renewable energy production sources in the state. Not only would such policies mean increased production of clean energy, but it would also mean decreased reliance on carbon-based energy and energy sources produced outside of the state.

Shift Toward Natural Gas Outweighs Shift Toward Renewable Energy Sources

While there has been a shift toward renewable energy sources over the last 10 years, there has also been an increase in usage of natural gas as an energy source. According to the U.S. Energy Information Administration, Michigan, California and New York all shifted away from oil and coal as sources for energy consumption and instead increased their usage of renewable energy sources. California and New York also increased their usage of natural gas as an energy source. The shift toward natural gas usage began in 2009 when the price gap between coal and natural gas production narrowed because of the increased supply of natural gas extracted from shale, according to the U.S. Energy Information Administration. Another, secondary, reason the shift occurred on a national basis, according to the U.S. Energy Information Administration, is because the generation of coal-powered energy has been declining as a result of stricter regulations by the U.S. Environmental Protection Agency.

In this post energy consumption and production between 2003 and 2013 is compared for Michigan, New York and California.

Between 2003 and 2013 New York’s consumption of coal as an energy source decreased the most of the three featured states by 217.5 trillion BTUs. This decrease was made up, and then some, by increased usage of natural gas (190.3 trillion BTUs-the highest of the three states) and renewable energy (50.9 trillion BTUs). Natural gas and renewable energy were the only two energy sources for which New York increased consumption of between 2003 and 2013. According to U.S. Census data, residents of the state of New York are increasingly relying on natural gas as a heat and electricity source. In the last 10 years that reliance on natural as a heating source has increased by about 500,000 households, according to Census data. New York also had the largest decrease in usage of oil between this time at 525.1 trillion BTUs.

In California natural gas consumption increased by 166.4 trillion BTUs between 2003 and 2013. According to the state, the increased consumption is, in part, being used as an alternative for petroleum in cars, trucks and buses as the use of alternative transportation options grow. Additionally, two-thirds of households in California use natural gas to heat their home, according to the U.S. Energy Information Administration.

California experienced the largest increase of renewable energy usage between 2003 and 2013 at 103.8 trillion BTUs. This increase, according to the U.S. Energy Information Administration, can be attributed to the state’s policies that made it the first state in the country to receive 5 percent of its utility-scale electricity from solar power and partially because of its mandate to reduce green house gas emissions through various efforts.

Michigan experienced an increase of its usage of renewable energy by 98.9 trillion BTUs between 2003 and 2013. Like California, Michigan also passed a mandate for increased renewable energy usage. The Clean, Renewable, Energy Efficiency Act stated that by 2015 utility providers must obtain at least 10 percent of the energy they sell from renewable sources.

With Michigan’s increased usage of renewable energy sources, and a small amount of nuclear power, it experienced a decrease in coal, natural gas and oil consumption.

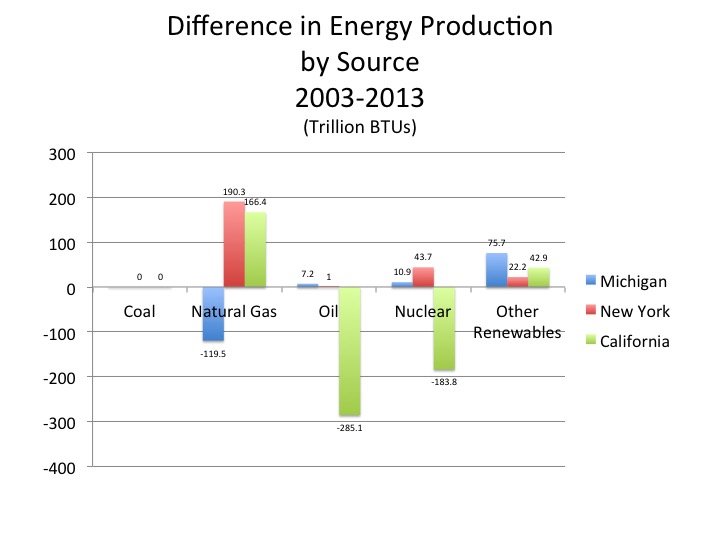
Of these three states though, Michigan was the only one to experience an increase in nuclear energy consumption (10.9 trillion BTUs) and a decrease in natural gas consumption. As can be seen in the production comparison chart, this is related how much of each energy source was produced in Michigan between 2003 and 2013. Although Michigan is consistently one of the top five states in the country to consume natural gas as an energy source, its production has been declining for the last 30 years, according to the U.S. Energy Information Administration.

All three states also experienced a substantial overall decline in energy consumption from 2003 through 2013, probably because of conservation and the severe impacts of the Great Recession on the state and its industrial production.
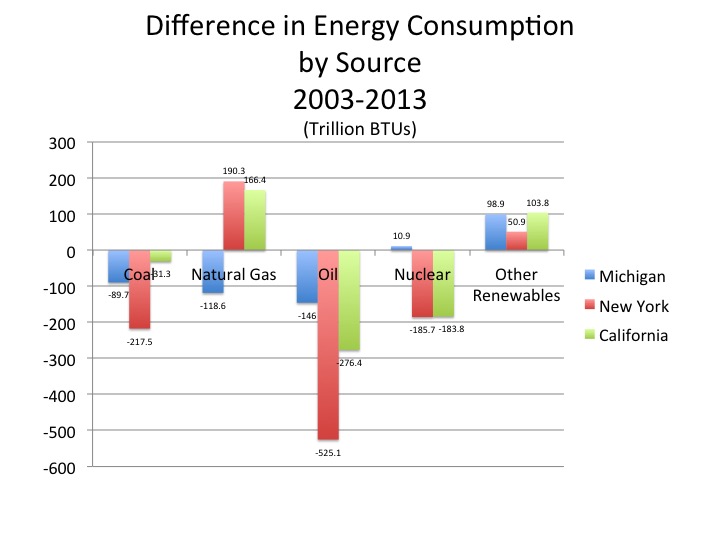
Energy Consumption Change

Between 2003 and 2013 New York’s consumption of coal as an energy source decreased the most of the three featured states by 217.5 trillion BTUs. This decrease was made up, and then some, by increased usage of natural gas (190.3 trillion BTUs-the highest of the three states) and renewable energy (50.9 trillion BTUs). Natural gas and renewable energy were the only two energy sources for which New York increased consumption of between 2003 and 2013. According to U.S. Census data, residents of the state of New York are increasingly relying on natural gas as a heat and electricity source. In the last 10 years that reliance on natural as a heating source has increased by about 500,000 households, according to Census data. New York also had the largest decrease in usage of oil between this time at 525.1 trillion BTUs.

In California natural gas consumption increased by 166.4 trillion BTUs between 2003 and 2013. According to the state, the increased consumption is, in part, being used as an alternative for petroleum in cars, trucks and buses as the use of alternative transportation options grow. Additionally, two-thirds of households in California use natural gas to heat their home, according to the U.S. Energy Information Administration.

California experienced the largest increase of renewable energy usage from 2003 and 2013 at 103.8 trillion BTUs. This increase, according to the U.S. Energy Information Administration, can be attributed to the state’s policies that made it the first state in the country to receive 5 percent of its utility-scale electricity from solar power partially because of its mandate to reduce green house gas emissions through various efforts.

Michigan experienced an increase of its usage of renewable energy by 98.9 trillion BTUs between 2003 and 2013. Like California, Michigan also passed a mandate for increased renewable energy usage. The Clean, Renewable, Energy Efficiency Act stated that by 2015 utility providers must obtain at least 10 percent of the energy they sell from renewable sources.

With Michigan’s increased usage of renewable energy sources, and a small amount of nuclear power, it experienced a decrease in coal, natural gas and oil consumption.

Of these three states though, Michigan was the only one to experience an increase in nuclear energy consumption (10.9 trillion BTUs) and a decrease in natural gas consumption. As can be seen in the production comparison chart, this is related to how much of each energy source was produced in Michigan between 2003 and 2013. Although Michigan is consistently one of the top five states in the country to consume natural gas as an energy source, its production has been declining for the last 30 years, according to the U.S. Energy Information Administration.

All three states also experienced a substantial overall decline in energy consumption from 2003 through 2013, probably because of conservation and the severe impacts of the Great Recession on the states and its industrial production.
Energy Consumption Change

The below charts show the change in consumption and production of energy sources between 2003 and 2013.

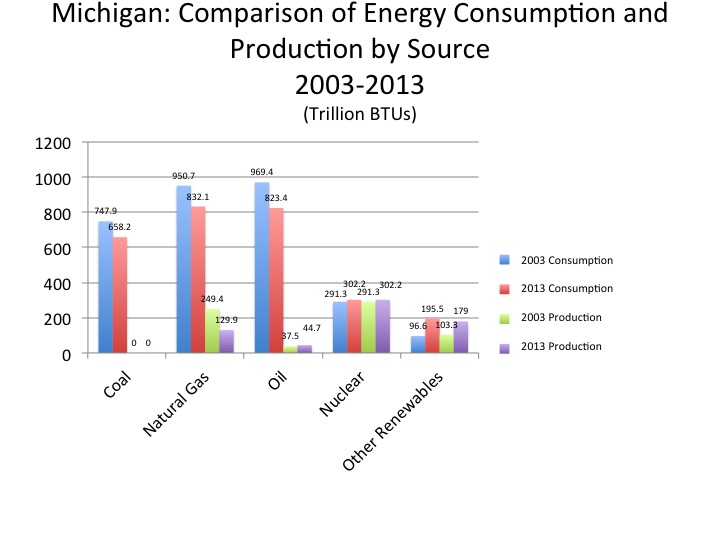
In Michigan, we see there was a decrease in natural gas, oil and coal consumption between 2003 and 2013. At the same time, the amount of energy consumed through all three of these sources heavily outweighed the amount produced in both 2003 and 2013. The chart also shows how in 2003 oil was the most relied upon energy source (969.4 trillion BTUs) but in 2013 that shifted to natural gas (832.1 trillion BTUs of natural gas and 823.4 trillion BTUs of oil), despite the fact that natural gas consumption and production in the state is decreasing. The amount of which natural gas usage decreased between 2003 and 2013 was almost entirely replaced by the increased usage of renewable energy (118.6 decreased natural gas usage) and 103.8 trillion BTUs increased renewables, respectively). The decreased production of natural gas (119.5 trillion BTUs) was not entirely replaced by the production of renewable energy sources (75.7 trillion BTUs) though.

The consumption of renewable energy is increasing faster than the rate of production. As noted earlier though, wind produces ones of the largest amounts of renewable energy in Michigan (consumption of wind power energy is equivalent to the amount produced), and the number of wind farms in the state is expected to grow from 21 to 27, as six additional farms are in the process of being developed, according to the state of Michigan.

Production and consumption of nuclear energy in the state varied the least in the state between 2003 and 2013.
Energy by Source Production Change

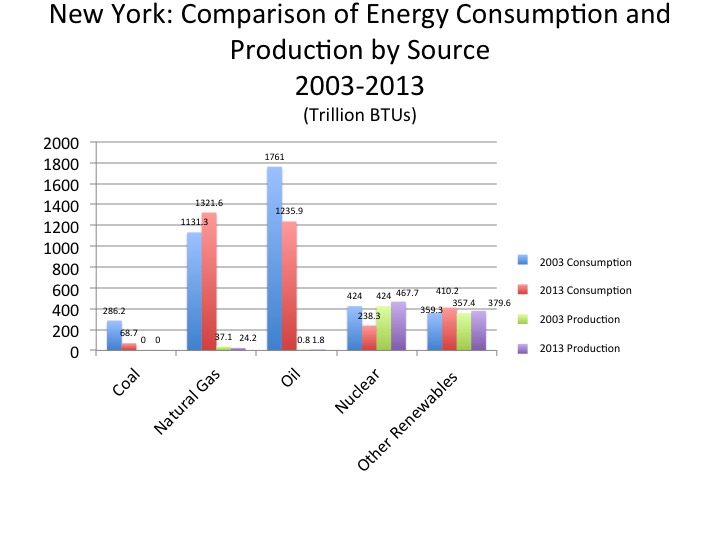
Just as with Michigan, the chart below shows New York’s shift from oil to natural gas for consumption between 2003 and 2013. In 2003 1131.3 trillion BTUs of natural gas was consumed in New York and 1761 trillion BTUs of oil. By 2013 though, the natural gas used increased to 1321.6 trillion BTUs and, the amount of oil decreased to 1235.9 trillion BTUs.

For renewable energy, consumption increased from 359.3 trillion BTUs to 410.2 trillion BTUs. In 2003 in New York, oil, natural gas, nuclear and coal energy sources were all used more than renewable energy sources, despite the fact the amount of renewable energy sources produced in that year was higher than the amount of coal, natural gas and oil produced in the state. By 2013 coal use had declined substantially, while renewable production and use was increasing.
New York Energy Change

Although California’s consumption of oil decreased between 2003 and 2013, the state still used it more than any other source in 2013. In 2003, 3523 trillion BTUs of oil were consumed, while this declined to 3246.6 trillion BTUs by 2013. The shift toward increased use of natural gas and renewable energy sources can be seen, but those numbers still do not exceed oil consumption. The use and production of renewable energy sources in California has continuously outweighed that of coal and nuclear energy. But the increased use and production of renewable energy sources still falls short of the use and production of natural gas. Between 2003 and 2013 the use of natural gas increased by 166.4 trillion BTUs and the use of renewable energy increased by 103.8 trillion. Production of natural gas increased by 166.4 trillion BTUs and production of renewables increased by 42.9 trillion BTUs.
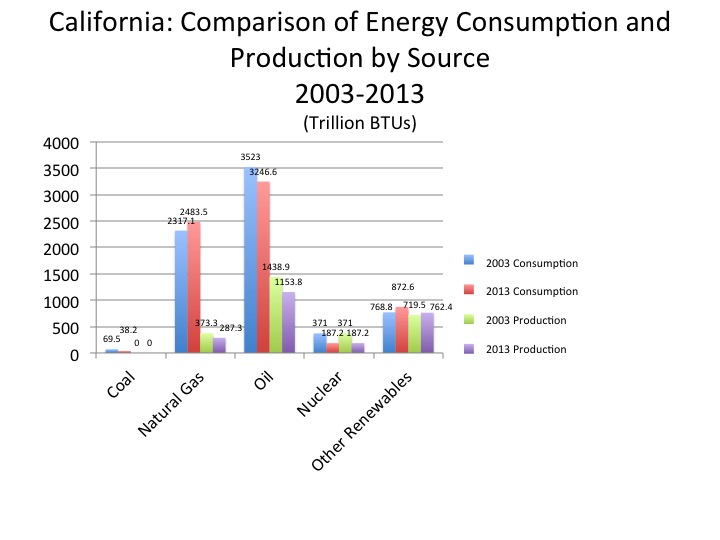
California Energy Change

In sum, the shift toward utilization and production of renewable energy sources is evident. With regulations on coal and oil growing stronger, and policies continuing to shift toward increased production and use of renewables, there is a definite move toward renewable energy. For now, however, the bigger move is that these states are substituting natural gas for oil and coal.

It is encouraging and fascinating, however, that there are substantial overall reductions in energy usage with New York clearly the leader.



Michigan Relies Heavily on Coal-Powered Energy

Of the 15 states featured in this energy series, only one state produced more energy than it consumed. In 2013, North Dakota produced 1,840.1 more trillion BTUs than it consumed. This surplus of energy is due to the state’s production of natural gas and oil. These instances of energy surplus production are two of only three where a featured state produced more trillion BTUs of a fossil fuel type energy source than was consumed in that state. The third instance was in Illinois where coal production trumped consumption.

Coal

Illinois

Production: 1149.6

Consumption: 1026.9

Natural Gas

North Dakota

Production: 317.9

Consumption: 83.8

Oil

North Dakota

Production: 1820.9

Consumption: 217.8

In this part of our energy series we further explore the net difference between production and consumption of energy sources. The sheer numbers show that the featured states relied upon coal, oil and natural gas as energy sources, despite their inabilities to produce the amount of energy they need to consume.

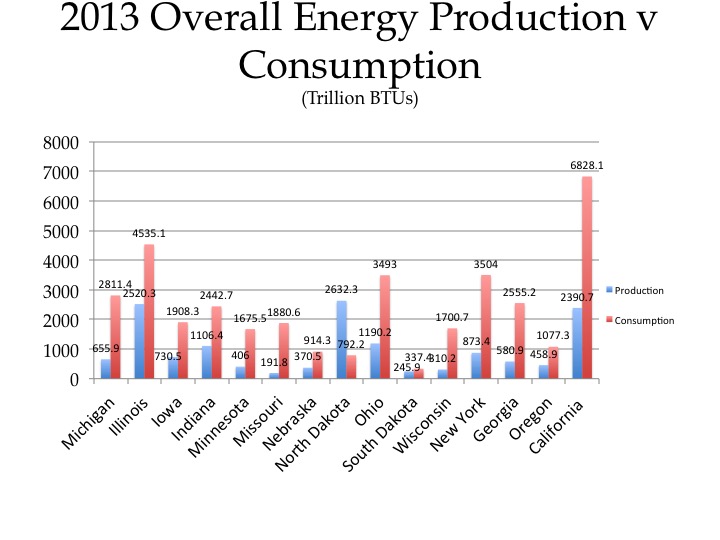
Overall, Michigan consumed 2155.5 more trillion BTUs of energy than it produced in 2013. Our production was 23.3 percent of our consumption. Only Missouri and Georgia produced a smaller percent of the energy it consumed. These states, along with Michigan, are exporting a huge share of their income to energy producers elsewhere. California had the largest absolute difference at 4,437.3 trillion BTUs, but California did produce 35 percent of its energy.. The state that came closest to North Dakota in terms of breaking even for energy consumption v production was South Dakota. Still, South Dakota consumed 114.1 more trillion BTUs than it produced.

In this post a nuclear energy chart is not included because each state produced nuclear energy as a power source consumed that same amount, meaning there was no net surplus or deficit. The amount of nuclear energy consumed and produced is included in the overall production v consumption chart below though.

The states featured in this series are:

  • Michigan
  • Illinois
  • Iowa
  • Indiana
  • Minnesota
  • Missouri
  • Nebraska
  • North Dakota
  • Ohio
  • South Dakota
  • Wisconsin
  • New York
  • Georgia
  • Oregon
  • California

Energy Comparison

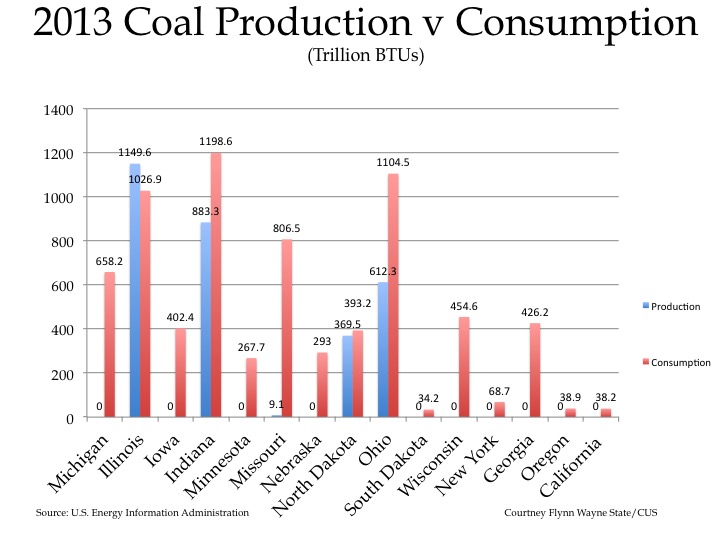
There was only one state of the 15 featured in this post were more coal-powered energy was produced than consumed in that state. This state was Illinois, where 1149.6 trillion BTUs of coal-powered energy was produced and 1026.9 trillion BTUs was consumed. This net surplus of coal-powered energy is an anomaly in this post because, as the chart shows, reliance upon coal for consumption much outweighs how much is produced. In total, in the featured states, 7211.8 trillion BTUs of coal-powered energy is consumed while less than half of that (3023.8 trillion BTUs) is produced. There are also 10 different states where no coal-powered energy is produced there, yet, 2,628.1 trillion BTUs, or 36 percent of the coal-powered energy consumed by these 15 featured states, is consumed there.

Missouri had the largest difference between the amount of coal-powered energy it produced and consumed in 2013. According to the U.S. Energy Information Administration, there was 9.1 trillion BTUs of coal-powered energy produced in Missouri in 2013 but 806.5 trillion BTUs consumed in that same year, meaning there was a net difference of 797.4 trillion BTUs. With such a large difference, Missouri must bring in coal from elsewhere to fuel its coal powered plants. According to the U.S. Energy Administration, Wyoming was the main provider of this energy source to Missouri. Is this the right measure. Michigan had the second largest difference between the amount of coal-powered energy it produced and consumed in 2013 at 658.2 trillion BTUs. Michigan did not produce any coal-powered energy in 2013 but 658.2 trillion BTUs were consumed there in 2013. According to the U.S. Energy Information Administration, Michigan primarily relies on Wyoming and Montana for its coal needs, although other states, such as Kentucky and West Virginia also provide this resource to the state. For about 90 years, between 1860 and 1949, Michigan did produce a substantial amount of coal through its coal mines, however they are not longer active, according to the U.S. Energy Information Administration, leaving Michigan to seek this resource elsewhere.

Coal Energy

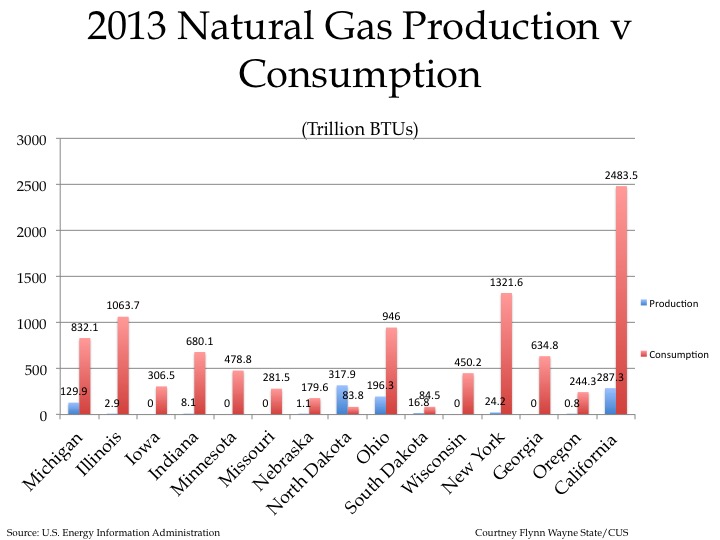
Natural gas is yet another fossil fuel based energy source where consumption typically outweighs production for these states. Of the 15 states discussed in this series, North Dakota is the only one where more natural gas was produced than consumed. In 2013, 317.9 trillion BTUs of natural gas were produced in North Dakota and 83.8 trillion BTUs were consumed, meaning there was a net surplus of 234.1 trillion BTUs. The production of natural gas in North Dakota has been rising since 2007 due to the large increase in the use of shales to produce this energy source, according to the U.S. Energy Information Administration.

California had the largest difference between natural gas production and consumption in 2013 at 2,196.2 trillion BTUs. Although California was one of the largest producers of natural gas of these featured states (287.3 trillion BTUs), those numbers still paled in comparison to the amount of natural gas it utilized (2,483.5 trillion BTUs). According to a recent LA Times article, natural gas is now the single highest source of power generation in California. Various interstate pipelines from Arizona, Nevada, Wyoming and Oregon bring natural gas into California for consumption, according to the U.S. Energy Information Administration.

For Michigan, there was a net difference of 702.2 trillion BTUs of natural gas consumption; 129.9 trillion BTUs of natural gas were produced in Michigan in 2013 and 832.1 trillion BTUs were consumed there. According to the U.S. Energy Information Administration, Michigan is regularly one of the top 5 users of natural gas for residential purposes. While Michigan has a large number of gas wells (about 10,000), production in the state has been declining since 1997. Due to this, much of the natural gas consumed in Michigan is obtained through pipelines that cross through the state from Ohio, Indiana and Wisconsin, with the end destination of these pipelines being the northeastern states and Canada, according to the U.S. Energy Information Administration.

Slide07

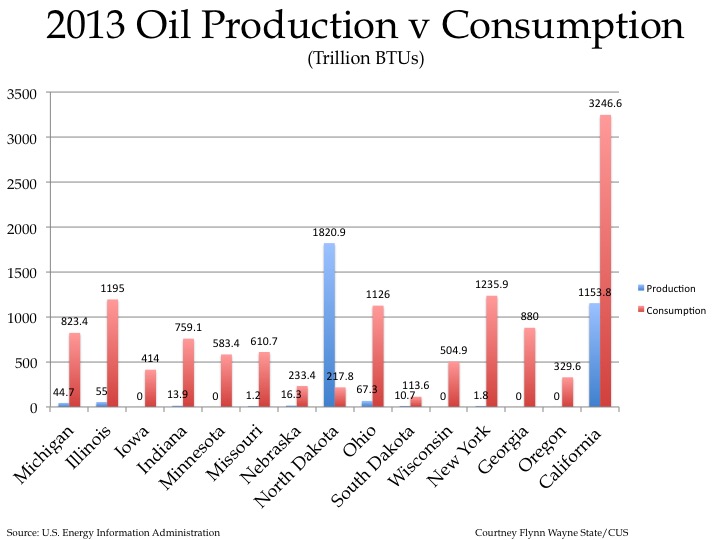
Just as with natural gas, North Dakota again was the only featured state to produce more oil than was consumed in 2013, according to the U.S. Energy Information Administration. In 2013, 1820.9 trillion BTUs of oil were produced there in 2013 and 217.8 trillion BTUs were consumed there. California had the largest net difference between oil consumption and production in 2013. For a net difference of 2092.6 there was 3246.6 trillion BTUs of oil consumed in California and 1153.8 trillion produced there. Despite California producing about 6 percent of the country’s crude oil, its rate of consumption of the fossil fuel outweighs the rate of production. This means, California must rely on other geographic locations to supply its needs. According to the U.S. Energy Information Administration, foreign countries (particularly Saudi Arabia, Iraq and Ecuador) supply more than 50 percent of the crude oil refined in the state. Additionally, North Dakota, Utah, New Mexico and Wyoming also supply crude oil for refining and consumption.

In Michigan in 2013, there was 823.4 trillion BTUs of oil consumed and 44.7 trillion BTUs produced, leaving a net difference of 778.7. The majority of the oil consumed in Michigan takes the form of gasoline. Michigan also has the highest residential consumption of liquid petroleum gasoline (LPG) in the country as a form of heating fuel. While there is a modest amount of oil produced in the state, it does not compare to the amount consumed, which is 18 times higher.

Slide09

Overall, according to the U.S. Energy Information Administration, it is typical of a state to consume about as much renewable energy as it produces. However, there are instances where a surplus of renewable energy is produced; this only occurs though because of additional biofuel production. In Iowa, 674.9 trillion BTUs of renewable energy were produced and only 384.7 trillion BTUs were consumed. The excess came from the biomass feedstock that was used to produce ethanol, which was then blended into motor fuel. Illinois, Indiana, Minnesota, North Dakota, South Dakota and Wisconsin also produced more renewable energy than was consumed, although not as much as Iowa. Again, this was directly related to biofuel production used to create ethanol.

Of the 15 states featured, California both produced and consumed the highest amount of renewable energy. California produced 762.4 trillion BTUs of renewable energy and consumed 872.6 trillion BTUs. For consumption, nearly 5 percent of California’s utility electricity was produced from solar power in 2013, and other renewable sources such as wind and hydroelectric were also used for consumption. In terms of production, California produces about 8 percent of the country’s wind-powered electricity and is also home to the world’s largest complex of geothermal plants, according to the U.S. Energy Information Administration.

Michigan ranked in about the middle for the 15 states in terms of energy production and consumption. In 2013 179 trillion BTUs was produced in Michigan and 195 trillion BTUs was consumed. Aside from biofuel production, which created 95.5 trillion BTUs of energy, wind-powered energy was the largest production source for renewable energy in the state in 2013; 26.7 trillion BTUs was created. With more than 100 hydroelectric power plants, this form of renewable energy also contributed to the 13.5 trillion BTUs of renewable energy produced in the state in 2013.

Renewable Energy

In this post we saw the vast difference between a state’s consumption of energy and its production, and rarely did these states produce more than they consumed, relying upon other states and imports for their energy. A reliance on fossil fuels for energy was evident in 2013 and next week we will show how this reliance was even heavier in 2003. For the final post of this series we will show how Michigan, New York and California have changed in their reliance on certain energy sources from 2003 and 2013.


Michigan Relies on Natural Gas the Most as an Energy Source

Last week we saw a large variation on the amount of energy produced between 15 carefully selected states, based on information provided by the U.S. Energy Administration. This week, we look at the major energy sources the 15 featured states consume energy from. Those featured states are:

  • Michigan
  • Illinois
  • Iowa
  • Indiana
  • Minnesota
  • Missouri
  • Nebraska
  • North Dakota
  • Ohio
  • South Dakota
  • Wisconsin
  • New York
  • Georgia
  • Oregon
  • California

(If one of the above states is not colored in a map it means it produced zero energy for that source. The other 35 states are not highlighted though because they were not chosen for comparison; this does not mean they didn’t utilize a source of energy).

The sources of energy discussed in this post are: coal, natural gas, motor gasoline, biomass and other renewables (which include solar and wind power).

Slide04

Michigan used more natural gas for energy consumption in the state in 2013 than any other source. In 2013 828.5 trillion BTUs of natural gas were consumed in Michigan; 129.9 trillion BTUs of natural gas were produced in the state in that same year. Of the featured states, the most amount of natural gas was consumed in California at 2,483.5 trillion BTUs. The featured state where the least amount of natural gas was consumed in 2013 was North Dakota at 83.8 trillion BTUs. South Dakota wasn’t far behind though, 84.5 trillion BTUs was consumed there in 2013.

Natural Gas Consumption

Motor gasoline is another consumption category which the U.S. Energy Administration chose to highlight in its data category breakdowns (others mentioned but not included in this post include residual fuel, liquefied petroleum gas and jet fuel). California again came out on top in terms of consumption, 1636.6 trillion BTUs of motor gasoline was consumed within the state in 2013. In Michigan, 515.5 trillion BTUs of motor gasoline were consumed in 2013; nine of the other featured states consumed less motor gasoline than Michigan in 2013. The state where the lowest amount of motor gasoline was consumed in 2013 was South Dakota at 49.8 trillion BTUs.

Gas Consumption

Nuclear power was another energy source that was not produced by all of the featured states, and, as can be seen in the map below it wasn’t an energy source that was consumed in every featured state either. Of the energy sources discussed in this post, nuclear energy was the only source not consumed by every featured state. The featured states where there was no nuclear energy utilized were Indiana and North Dakota; these states also didn’t produce any. Illinois utilized the highest amount of nuclear energy in 2013 of the featured states at 1014.9 trillion BTUs. All nuclear energy produced in these featured states was consumed there. This means Michigan not only produced 302.2 trillion BTUs of nuclear energy but also that that amount was consumed there.

Nuclear Consumption

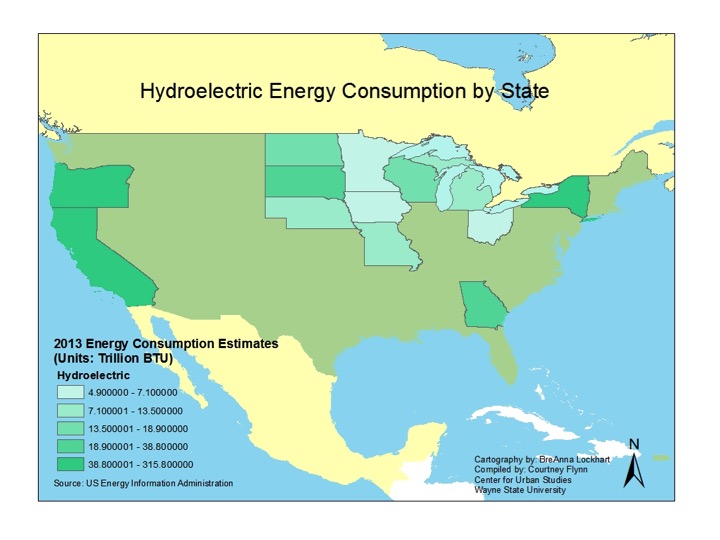
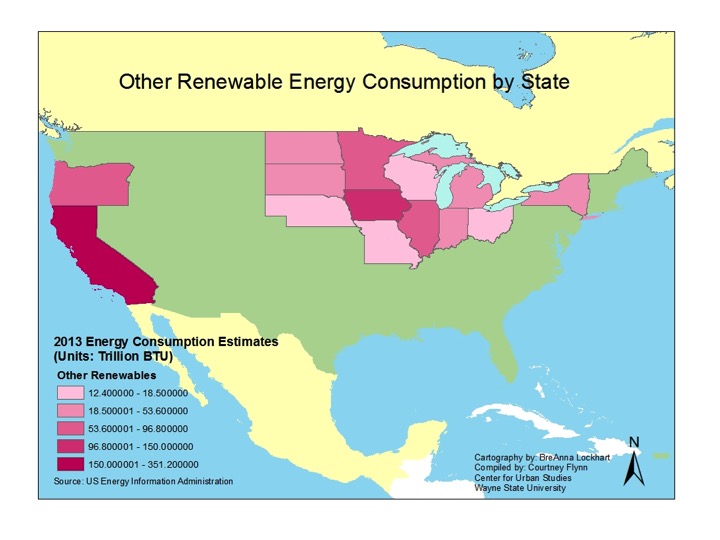
When examining which states consumed the highest amount of renewable energy sources the western states fared better when comparing consumption of these energy sources. California consumed the most amount of biomass of the featured states in 2013 at 294.7 trillion BTUs. It also consumed the highest amount of “other renewable” energy sources (which include wind and solar) at 351.2 trillion BTUs. The amount of hydroelectricity consumed in California was 226.6 trillion BTUs. Oregon and New York were the only states where more hydroelectricity was consumed, 315.8 and 238.3, respectively. Oregon was also the only other featured state (aside from California) that consumed more biomass, “other renewable” and hydroelectricity than coal in 2013. In Oregon in 2013, 71.4 trillion BTUs of biomass, 77.3 trillion BTUs of “other renewables” and, as noted, 315.8 trillion BTUs of hydroelectricity was consumed. About 40 trillion BTUs of coal-powered energy was consumed in Oregon in 2013.

In Michigan 13.5 trillion BTUs of hydroelectricity, 148.8 trillion BTUs of biomass and 33.1 trillion BTUs of “other renewables” was consumed in 2013. Overall, Michigan consumed slightly more renewable energy than it produced, that net gain was due to biomass consumption.

Biomass Consumption

Hydroelectric Consumption

Renewable Consumption

Over the past two weeks we have presented the basics for energy consumption and production by source in a select number of states. Next week, we will begin our deeper dive into the energy production surpluses and deficits on a state-to-state basis, showing reliance on certain energy sources despite the state’s lack of or limited production of it.