Life Expectancy Declines in Michigan, US

The average life expectancy for Americans decreased in 2020, according to the National Center for Health Statistics, and the same goes for Michiganders.

According to the National Center for Health Statistics, which is run by the Centers for Disease Control, the average life expectancy of an American in 2019 was 79 years of age and by 2020 that decreased 77 years of age. In 2021, the National Center for Health Statistics reported the average life expectancy of an American decreased to 76 years of age. For Michigan, the Michigan Department of Community Health did not have data for 2021, but for 2020 the average life expectancy of males and females, both white and black, declined.

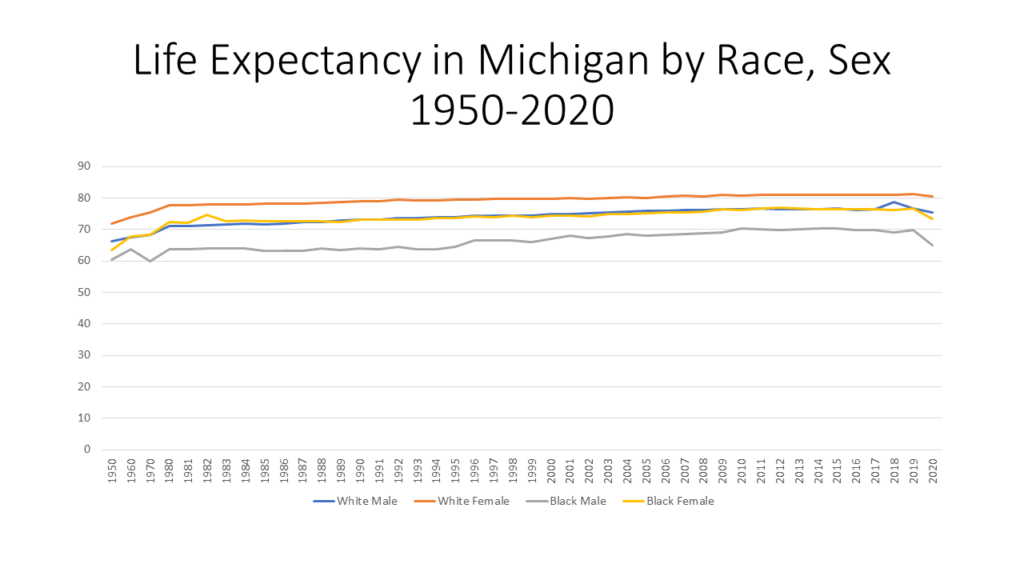
The first chart below shows that between 2019 and 2020 the life expectancy for females declined from 80.6 years of age to 79.2; for males the average life expectancy declined from 75.7 years of age to 73.6. Prior to the reported 2022 average life expectancy ages, the last times they were as low was in 2002 for females (79 years of age) and 1999 for males (73.4 years of age).

According to the Centers for Disease Control, the top 10 contributing factors to death for those who live in Michigan in 2020 were:

•Heart Disease (117,087 deaths)

•Cancer (21,118)

•COVID-19 (11,362)

•Accidents (6,044)

•Stroke (5,873)

•Chronic Lower Respiratory Disease (5,644)

•Alzheimer’s Disease (4,860)

•Diabetes (3,408)

•Kidney Disease (1,940)

•And Influenza, Pneumonia (1,880)

While we know the leading causes of death, it is believed by the CDC that the pandemic likely drove the recent decline in the average life expectancy for Americans, across the board. In Michigan, COVID-19 itself attributed to 11,362 deaths in 2020. We also know that the number of deaths related to heart disease, accidents, influenza/pneumonia, kidney disease, diabetes and stroke increased between 2019 and 2020, as did the drug overdose rates.

So, while the numbers above help frame the story as to why Michigan’s average life expectancy is decreasing, digging into the data another way also tells another story.

The Michigan Department of Community Health publicly presents data on the average life expectancy broken down by both sex and race. As shown above, overall, females have long had a higher life expectancy over males. However, when further breaking down the data, we see that black females and white males in Michigan have had nearly the same life expectancy since 1910. In 2020, the average life expectancy for black females in Michigan was 73.3 years of age, a decrease of 3.3 years from 2019. The average life expectancy of white men in Michigan was 75.3 years of age in 2020, a decrease of 1.3 years from 2019. White females in Michigan experienced a 0.9 decrease in average life expectancy, which was the smallest decrease of the four groups. It was black males who had the largest decrease in life expectancy between 2019 and 2020 in Michigan at 4.8 years; in 2020 the average life expectancy for black males in Michigan was reported at 64.9 years of age. The last time the average life expectancy for black males was that low, or lower, was in 1995 when it was reported to be 64.4 years of age.

According to the Michigan Department of Community Health, the top leading causes of death for black males in Michigan in 2020 were:

•Heart Disease (2,430 deaths)

•COVID-19 (1,610)

•Malignant neoplasms (1,272)

•Accidents (799)

•Assault ( 512)

Note that assault is not even among the overall the top 10 causes for Michigan citizens overall.
While we mentioned the effect COVID-19 has had on life expectancy, as well as drug overdoses and the increase mortality rates related to other diseases, it should also be noted that number of individuals with access to health care has increased in recent years. So, as the average life expectancy is decreasing, more individuals are receiving greater access to health care, an odd result, but probably the effect of COVID has overtaken the benefits of better care.

Overall, decline in life expectancy for all sexes and races is concerning as it means people are dying earlier than they should be.
Lower Life Expectancy Related to Lack of Health Insurance

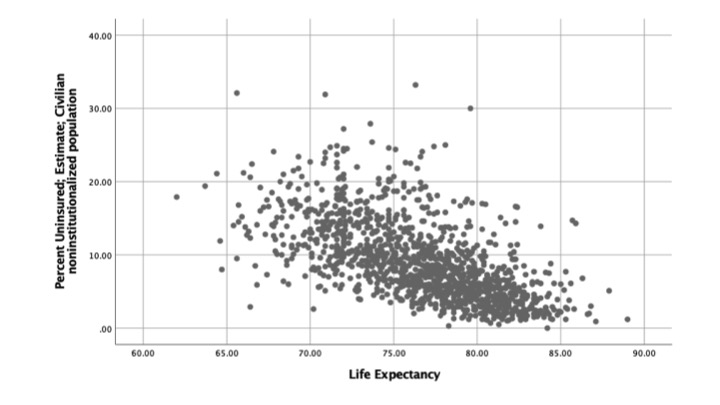
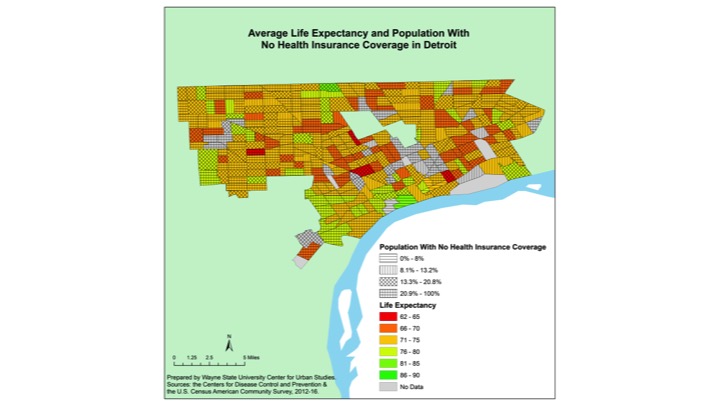
The correlation between life expectancy and those who are uninsured is -0.617 (sig. 0.00), meaning that there is moderately strong tendency for the length of life to decline as lack of access to health care (i.e. being uninsured) increases. In general, those without health insurance tend to live shorter lives. For example, in the City of Detroit, there are more than 25 different Census Tracts where residents have a life expectancy of 70 years of age or less. Of those Census Tracts, majority of them have 21 percent of the population or more living without health insurance. Even as life expectancy increases to the median range of the spectrum in Detroit, the evidence shows that majority of the Census Tracts have about 13 percent of the population or more without health insurance. Interestingly though, only one of the four Census Tracts where the average life expectancy is 65 years of age has 21 percent or more of the population living without health insurance. The other three Census Tracts with such an average life expectancy has between 13 and 21 percent of the population living without health insurance.

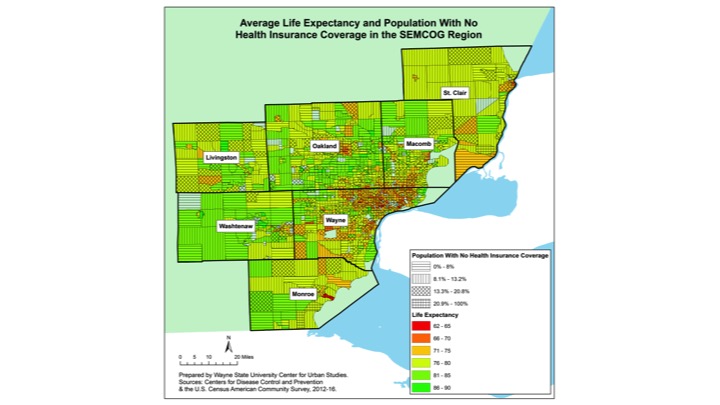
When moving beyond the boundaries of Detroit, in many of the outer-ring suburbs life expectancy increases as does the percentage of residents with health care. For example, majority of Washtenaw, St. Clair and Monroe counties have less than 13 percent of the populations living without health insurance and average life expectancies at 76 years of age or higher. With the exception of one Census Tract in southern Monroe County, no other areas in those three outlying counties have more than 21 percent of the population living without health insurance. As you do move in closer to Detroit though, there are wider ranges of life expectancies and access to health care. In Wayne County, for example, areas such as Romulus and Lincoln Park also have lower life expectancies (70 years of age or less) and more than 21 percent of the population not having health insurance. But, there are also areas, such as Grosse Ile, where the average life expectancy is 86 years of age and above and 8 percent or less of the population do not have health insurance. While the average life expectancy tends to be higher in Macomb and Oakland counties, there are still pockets, such as South Warren, Mt. Clemens and Pontiac, where the average life expectancy is 70 years of age or less and those without health insurance is at about 13 percent or higher.

As has been shown through some of the examples above, there is a moderately strong negative correlation between the percentage of the population living without health insurance and the average life expectancy of Census Tracts in Southeastern Michigan. This is further demonstrated in the chart above, which ultimately shows that as the percentage of the population living without health insurance increases the average life expectancy decreases. The chart also shows though that majority of the Census Tracts in Southeastern Michigan have an average life expectancy of about 75 years of age or higher with 10 percent of less of the population living without health insurance.


Overall, these maps and the graph show that while there is a range in life expectancies in Southeastern Michigan, there is also a range in those with access to health care, particularly those in and around Detroit. Access to health care is important as health care providers can not only treat, but also prevent, a plethora of illnesses and diseases. Such knowledge and treatment is vital for longer life expectancies.