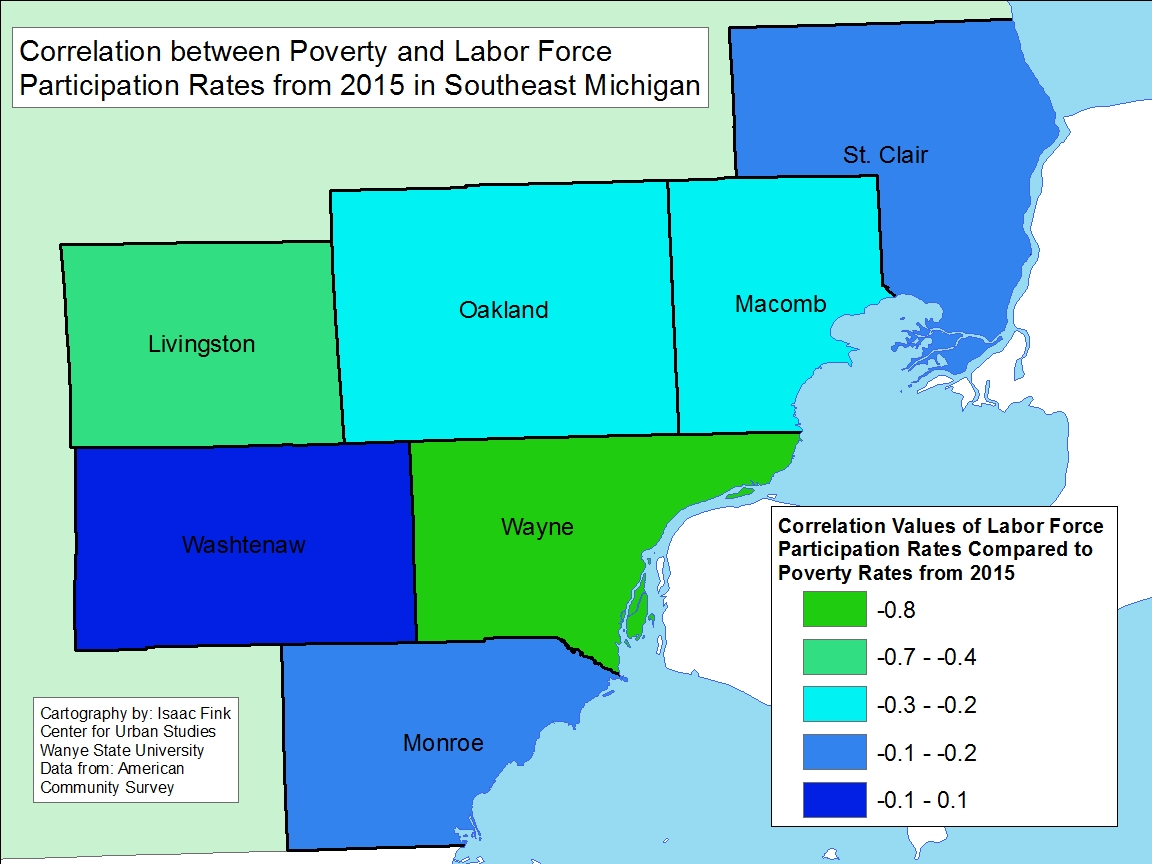
As discussed throughout our most recent series, data about labor force participation highlights decreasing percentage of individuals who are not active participants in the work force. To further explore the recent labor force and poverty rate discussions, this post delves into the correlation between the 2015 labor force participation rate and the 2015 poverty levels across the Southeastern Michigan area.
A correlation is statistical technique that can be used to describe the relationship between two variables. The correlation coefficient, often expressed as ‘r’, is a numerical value that is always between +1 and -1. When r is closer to +1, it implies a positive correlation; as one variable increases, the other does as well. When r is closer to -1, it implies an inverse correlation; as one variable increases the other decreases. When the value of r is closer to 0 the implication is that there is no relationship between the two sets of data.
Looking across the region we find that labor force participation with poverty at a level of -0.46, a moderate correlation. (Note that we are using municipalities as the unit of analysis here.) This correlation tends to indicate that as labor force participation declines, poverty increases, all other factors being equal. This helps to explain why we are seeing increasing poverty in areas, including many suburban areas, where labor force participation was hit hard by the Great Recession.
We also examined the variation in this correlation across the counties in the region.
Correlation Coefficients for Southeastern Michigan Counties: Labor Force Participation and Poverty
- Livingston County: -.4
- Macomb County: -.24
- Monroe County: -.18
- Oakland County: -.28
- St. Clair County: -.18
- Washtenaw County: .08
- Wayne County: -.84
These results present correlations calculated across municipalities within counties. We found that, aside from Washtenaw County, every other county in Southeastern Michigan had a negative correlation, meaning that as labor force participation declined, poverty increased. Of those six counties, Wayne County was the only one to have a strong negative correlation—(-0.84). This implies that municipalities in Wayne County with lower labor participation are very likely to have higher levels of poverty.
The correlations for five other counties–Macomb, Livingston, St. Clair, Monroe and Oakland–were negative but weak or moderate, meaning that there was still a tendency for poverty to increase with a lower labor participation rate, but it was weaker.
Washtenaw County was the only county in the region to have a correlation coefficient above 0, the value being +0.08, indicating a very low positive association between poverty and labor force participation.
Overall, these analyses show that six of the seven counties had weak to moderate correlation between their labor participation rates and their adult poverty rates. Wayne County was the exception to this, with a strong correlation coefficient of -0.84. Previous posts have shown that Wayne County communities also experienced some of the largest decreases in its labor force participation rates since 2010 and had some of the highest overall adult poverty rates. For example, in 2015 Highland Park had the lowest adult labor force participation at 54 percent, while the poverty rate is 49.3 percent.
In the suburbs, particularly those located nearer to Detroit (with some notable exceptions), there have been overall declines in labor force participation rates. At the same time data clearly shows that the percentage of adults in poverty has been increasing for many of the suburbs in Southeastern Michigan in recent years.


