Detroit’s Infant Mortality Rate Reaches 13 Year High

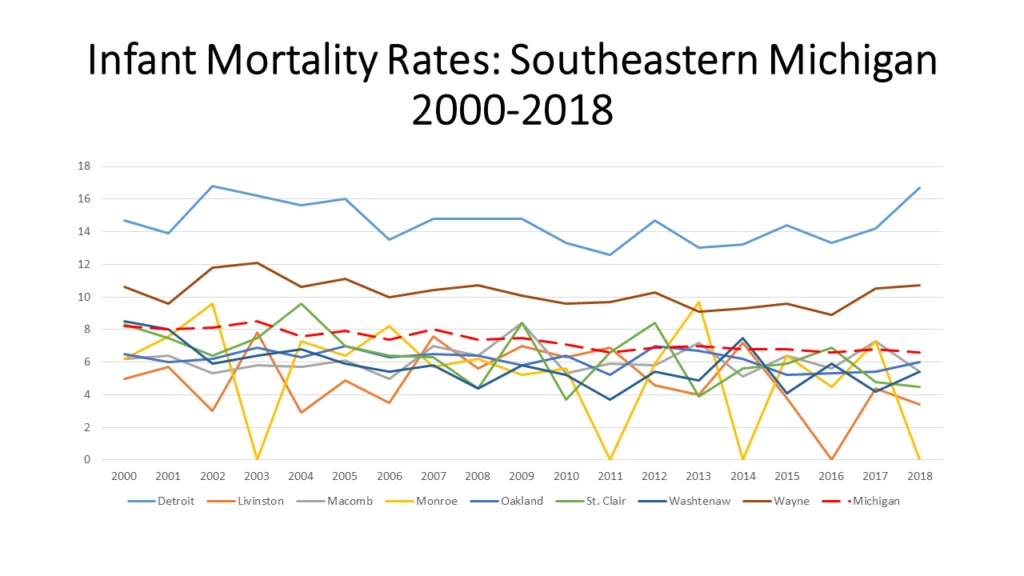
Michigan ranks 36th in the country in infant mortality and the City of Detroit has the highest number of infant deaths in the State, according to the Michigan Department of Health and Human Services. In 2018, the most recent year for which data was available, Detroit’s infant mortality rate was 16.7, the highest its been since 2002 when the rate was 16.8 These two rates translate to 9,476 (2018) infant deaths and 14,187 (2002) infant deaths, respectably. The infant death rate is the number of resident infant deaths divided by total resident live births X 1,000.  Infant deaths are deaths occurring to individuals less than 1 year of age.

As shown in the first chart below, Detroit infant mortality rates are consistently much higher than those of any county in Southeastern Michigan, and any other county in the State. Detroit’s infant mortality rates are also consistently higher than the State average. And, while the State’s infant mortality rates have been declining overall since 2000 Detroit’s rate has increased 3 points since 2016. It is important to remember that over 50 percent of children in Detroit families live below the poverty rate, far higher than elsewhere in the state.

Monroe and Livingston counties have regularly had the lowest rates; in some years not enough data was available for a rate. While we know that Detroit and Wayne County’s infant mortality rates are much higher than those in Monroe, Livingston and Washtenaw counties we also know that race plays a role in infant mortality rates. According to the US Department of Health and Human Services Office of Minority Health, African Americans • Have 2.3 times the infant mortality rate as non-Hispanic whites;

•Are 3.8 times as likely to die from complications related to low birthweight as compared to non-Hispanic white infants;

•Had over twice the sudden infant death syndrome mortality rate as non-Hispanic whites, in 2017.

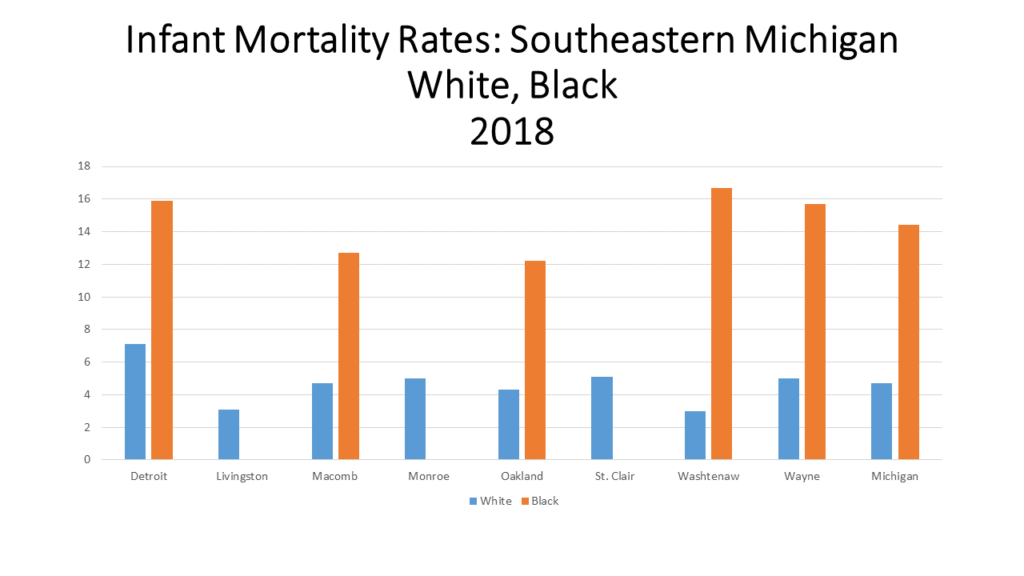
Additionally, in 2017, African American mothers were 2.3 times more likely than non-Hispanic white mothers to receive late or no prenatal care. The evidence of these statistics are also apparent in the second chart below.

In 2018, the most recent year for which data was available, the infant mortality rate for black babies in Detroit was 15.9 while for white babies it was 7.1. That gap between infant mortality rates of white and black was even larger at the State level ( 14.4 for black babies and 4.4 for white babies) and at the county level in the region (compared to that in Detroit), where median incomes tend to be higher. Furthermore, Detroit’s overall infant mortality rate is likely the highest in the State because it has among of the highest percentage of black residents. According to the US Census Bureau, 78 percent of Detroit’s population is black, 39 percent of Wayne County’s population is black while 1 percent of Livingston County’s population is black and 2 percent of Monroe County’s is black. Statewide, 14 percent of the population is black.

Not only should the increasing infant mortality rates of Detroit and Wayne County be of concern, but so should the causes. As alluded to above, race and income are contributing factors to infant mortality rates, as is racism. According to the Michigan League for Public Policy’s report “Strong Moms for Thriving Babies: Right Start 2020“ issues such as poverty and racism must be addressed in order for local infant mortality rates to decrease. Recommendations to do this include extending Medicaid coverage to 12 months postpartum; allowing for and enhancing reimbursement rates; increasing the number of high-quality home visiting programs to establish healthy starts for families by offering moms and their children, valuable health screenings and connecting families; restoring Michigan’s Earned Income Tax Credit; and advocating for paid paternity leave.

Statewide, a $12.6 million annual budget for the new program “Healthy Moms, Healthy Babies” was approved as part of the 2021 budget. This program is aimed at decreasing the infant mortality rate while providing the resources in order to accomplish that goal. Components of this program include:

• Plans to expand healthcare coverage for a mother to a year;

•Moving a woman’s first postpartum visit to within three weeks, with a comprehensive visit within twelve weeks;

•Requiring implicit bias training for medical professionals;

•Expanding home visits;

•Allowing the woman to chose what form of birth control works best for her.

The problem, however, is that divided evenly this would provide only about $116 per child under one. If it were concentrated on only the 19%  of children in poverty, this would set aside a bit over $500 per child. Is it likely this is enough to make substantial change?

Ten Things Joe Biden and Kamala Harris Should Do for Detroit

There are two reasons Detroit should have a special place in President-elect Joe Biden’s heart. First, because Detroit needs real help–now. And second is because Detroit is one of the key places that brought his victory. Detroiters voted in massive numbers for him and Vice President-elect Kamala Harris, and Democrats will need Detroit voters to win again. As the saying goes, you need to dance with the ones who brung you.

Here, then, are ten agenda items Biden and Harris should prioritize—giving back to a City that helped bring them into office.

1.Make plenty of vaccine doses available. Unemployment linked to COVID-19 closures have hit the poor and those in service jobs far harder than other industries. Unemployment numbers are more than double in Detroit than in Michigan. More vaccines mean it’s safer to go back to work, and Detroiters need that work and the accompanying income now. That will improve many other things mentioned here, including reducing violence.

2. Reduce the violence. We’ve seen major increases in murders and shootings. On surveys through the years, Detroiters have consistently said public safety is at the top of their agenda, but that does not translate to a desire for heavy duty police enforcement across the board. Rather than defund the police, Biden should talk about demilitarizing the police and making them responsive to the true needs of the community. Detroit citizens want tough action against the repeated violent offenders, but they want first time offenders and others diverted out of stigmatizing court process into community service, education and job training programs. For example, police regularly stop hundreds of people and arrest them for carrying illegal weapons. We need to divert these citizens into training programs that teach them about the risks of violence. We need to use conflict deflectors and de-escalators to reduce violence. Increased participation in youth sports and utilization of open community centers will also help deter violence. While many of these outlets have been closed and cancelled due to COVID restrictions, we must find ways to continue to offer such opportunities.  

3. Reduce domestic violence. Domestic violence, already high in Detroit, has increased under COVID-19, and the enforcement of parole violations for domestic violence offenders by Michigan Department of Corrections has declined.

Detroit has far fewer shelter beds than surrounding communities for survivors of domestic violence (DV) or intimate partner violence (IPV). This needs to be corrected immediately. Beyond that, survivors need to have far more access to advocates who can help them navigate the complex legal and support systems that do exist. They need more financial help to pay for things like moving to safe locations and serving Personal Protection Orders that are intended to help shield survivors from further violence.

4. Increase jobs for youth.  Detroit youth have extraordinary unemployment levels, well above the already high adult unemployment levels. This is a crisis, especially because we know that this will affect their lifetime earnings and connection to the workforce. Such high levels have led to challenges to democracy itself in other times and countries.

We need broad, youth employment programs funded by the federal government and operated by non-profits that do real work to help improve Detroit.  These jobs must create job ladders for youth so they have a future in which to invest.

5.Increase support for youth to go to college, apprenticeships, and training at community colleges. Many youth have no real way to pay for college.

We need to increase Pell Grants very substantially so youth who want higher education can get it without having a lifetime of debt, as so many do now. Apprenticeships and training in the skilled trades also often lead to good jobs with benefits and high wages—sometimes higher than college-educated jobs. These opportunities also need more funding so the youth have access to an even wider range of skills and jobs.

6.Fully fund special education. In Michigan, charter schools are implemented in a manner where they generally recruit higher performing students from the public schools, leaving the public schools with fewer higher performing students—who tend to cost less to educate. In major urban areas, charter schools proliferate and the public schools end up with a disproportionate share of special education students, which the charter schools avoid. These students cost more to educate. Because special education is not fully funded by the federal government, the costs are off loaded onto urban school districts in Michigan. These costs drive urban school districts into debt and decline. None of this makes it onto the debate stage, but this is the crucial work that needs to be completed to help Detroit and other cities like it. More federal funding is needed for special education students.

7.Invest massively in home repair. Detroit’s housing is crumbling with 63% of the housing units having at least one major health hazard. Lead paint, lack of heat, flooding, asbestos, Volatile Organic Compounds (VOCs), structural hazards, fire hazards—these are all present across the range of homes in Detroit both for homeowners and renters.

Detroiters don’t have the money to pay for all these repairs, and Community Development Block Grant dollars continue to decrease. Money for repairs of existing homes is needed to make them safe and to protect existing residents from disease, injuries and break-ins. This will also protect them from gentrification.

8.Protect homeowners from foreclosure. This is a perennial issue in Detroit that turns into a crisis with every recession. In the Great Recession, many thousands of homes were wrenched from homeowners. Now foreclosures are high again.

Short term cash and longer term re-writing of mortgage agreements are critical to short circuiting this endless cycle of foreclosures that has already made Detroit a majority renter city. This too will protect existing homeowners from gentrification.

9.Invest heavily in weatherization. One the highest costs that Detroiters face are their utility bills, both for renters and homeowners. Leaky old houses mean huge heating bills that often take up a large part of the budgets of low and moderate income households. In neighborhoods like Southwest Detroit, where industry and traffic pollute the air, this weatherization should also include air filters to clear the air that people breathe most of the time (Americans typically spend 80% of their time in their homes).

The Obama Administration initiated a large weatherization program but the budget for that got nixed by the GOP in Congress. Now is the time to move forward with this both for the sake of everyday Detroiters and the sake of the planet.

10.Build Community Solar. Unlike many cities, Detroit has lots of open space that could be used for solar energy production. DTE, our local utility, mainly produces electricity from coal, which hurts the planet and the lungs of Detroiters. And, Michigan produces none of this coal. Another way to help Detroiters reduce their utility cost is use some of the massive amount of vacant land in the city for building community solar installations. With investment from the federal government, these could be owned by Community Development Corporations or others who could sell the solar power at cost to homeowners nearby. Investing in these small-scale production facilities would produce installer jobs for Detroiters, increase reliance on alternative sources of electricity, cut costs for citizens and make appropriate use of vacant land.

COVID’S Economic Impacts Continue in Michigan and Beyond

Twenty-twenty may be a wrap but the COVID-19 pandemic continues on and the economic impacts continue to be felt, nationally and locally. According to the Michigan Department of Health and Human Services, on Jan. 2, 2021 there were 497,127 confirmed COVID-19 cases; that is 8,983 new confirmed cases since Dec. 29, 2020 (the State did not release data over the New Year’s holiday). According to the five-day rolling average (shown in the chart below) there were 489,096 confirmed COVID cases in Michigan on Dec. 31, 2020. New case numbers continue to remain in the thousands, and while the vaccine is in its first phase of distribution, we still have a ways to go until the affects of this virus—physically, economically, socially and mentally—are no longer felt.

In November of 2020 the unemployment rates for the State of Michigan and for the City of Detroit increased after general declines between July and October. The State of Michigan reported an unemployment rate of 6.3 in November, a higher rate than what was reported in October, which was 5.7—the lowest rate reported since the pandemic began. While the November unemployment rate was still lower than what was reported between April and September of 2020, it was still an increase from October and likely a reflection of the stronger COVID-19 restrictions imposed by the State and growing caution from citizens as the confirmed case numbers began to rapidly increase.

For the City of Detroit, the unemployment rate for November of 2020 was 18.7, which is higher than the October rate of 15.4. While Detroit’s unemployment numbers remain much higher than what they were a year ago and above the State’s, the city is following the same trend as the State. Furthermore, the November unemployment data shows how the unemployment gap between the State and Detroit continues to grow wider as the case numbers increase.

A direct reflection of the unemployment data above is the number of small business closures. According to the Southeastern Michigan Council of Governments (SEMCOG), 33 percent of small businesses in Metro-Detroit closed as of Dec. 30, 2020. While this lower than the May 12, 2020 local small business closure percentage of 54 it is still far above the 3 percent closure rate on April 1, 2020—less than a month after COVID hit Michigan.

The data on the percentage of small business closures is determined through the Opportunity Insights Economic Tracker. This source uses credit card transaction data from 500,000 small businesses and estimates closures from the number of small businesses not having at least one transaction in the previous three days. The data covers industries such as healthcare services, leisure and hospitality, and retail and transportation.

Michigan’s economy continues to rely heavily on the auto industry and between February and March of 2020 auto sales for cars, trucks and light weight vehicles were cut in half. Since then, the number of auto sales has slowly, yet steadily, grown—but not to pre-pandemic levels. In November of 2020 auto sales for: light weight vehicles was 15.5 million, compared to 16.9 million the year prior; light truck sales was 11.8 million compared to 12.6 million in November of 2019; car sales was 3.8 million, compared to 4.4 million the year prior. All three types of vehicles have experienced a decline, with light weight vehicles experiencing the largest decline when comparing 2019 sales to present sales.

Below shows the consumption expenditures of goods in the U.S. between 2019 and 2020. According to the U.S. Bureau of Economic Analysis, durable goods have an average useful life of at least 3 years (e.g. motor vehicles) while nondurable goods have an average useful life of less than 3 years (e.g. food) and services are commodities that cannot be stored or inventoried and are consumed at the time of purchase (e.g., dining out). The chart below shows how in March of 2020 consumption of nondurable goods increased while consumption of durable goods and services decreased. Following the initial panic of the COVID-19 pandemic, consumption expenditures of nondurable goods decreased in April, 2020 and have since somewhat leveled off. In November of 2020 $3167 billion in nondurable goods was consumed and in November, 2019 $3017 billion in nondurable goods was consumed.  Overall, there has been an increase in consumption expenditures of nondurable goods since last year. For durable goods, $1813 billion was consumed in November of 2020 and in November of 2019 $2032 billion was consumed; this shows an overall decrease.

Services have been the hardest hit in terms of expenditure consumption. In November of 2020 $8014 billion in services was consumed and in November of 2019 $8589 billion was consumed.

In addition to COVID impacts on employment rates and consumption of goods and services, it has also impacted the sale prices of homes. However, the pandemic seems to have had the opposite effect—home prices have continued to increase.

According to the Case-Shiller Home Price Index, the average price of single-family dwellings sold in Metro Detroit was $135,760 in September of 2020; this was $164 higher than the average family dwelling price in August. The September 2020 price was an increase of $8,290 from September of 2019.

Michigan’s Unemployment Benefits Lowest in the Region

The national average for weekly unemployment benefits in the United States is $468; $362 per week is what is provided in Michigan. Michigan has the lowest unemployment benefits of any state in the Great Lakes region and ninth lowest in the nation. In addition to the unemployment amount being $362 a week, that amount is traditionally paid for 20 weeks (it has currently been extended to 26 weeks due to the COVID-19 pandemic). Even with extended and additional unemployment benefits, families in Michigan continue to financially struggle.

According to the most recent Kids Count report, 56 percent of adults living in a household with children have reported losing income as of Nov. 9, 2020 in Michigan. The same report states that only 4 percent of adults living in a household with children in Michigan are receiving their full pay and not using leave for time not working, while 92 percent who are off work are not receiving any pay for their time off.

The October 2020 unemployment rate in Michigan was 5.1 percent, compared to 3.5 percent in October of 2019 (the most recent data available).  At the national level, according to the U.S. Bureau of Labor Statistics the unemployment rate was 6.9 percent of the non-farm working population. At the national and local level, unemployment rates aren’t as high as they were in April, when the pandemic first hit, but they are higher than they were compared to 2019.

So, as the pandemic continues we are more likely to see higher unemployment rates and more people unable to meet their needs from the unemployment benefits they receive (or should be receiving). According to a recent Money.com article, unemployment benefits in most states do not cover the basic needs of most families. This is due to the cost of living in a state (food, rent, utilities) compared to the amount and length of unemployment benefits received.

The map below shows the maximum unemployment an individual can receive in each state. Massachusetts has the highest amount of unemployment paid to an individual (with dependents) at $1,234 a week; it is also one of the wealthiest states. Conversely, Mississippi pays the lowest amount at $235. According to the article, Kentucky and Maine are among the poorest states in the Country but their unemployment benefits ($552 and $667, respectively) allow residents to cover their basic needs.  The unemployment benefits in Kentucky and Maine are higher than that of Michigan’s $362 a week.


According to the Economic Policy Institute, families with two adults and two children in the Detroit-Livonia-Warren metro need an annual income of $79,308 – or $6,609 per month – to live comfortably. With the an unemployment amount of $362 a week for 26 weeks (factoring in the pandemic) for an adult household of two (two adults bringing in income, but with two children as well), that brings in about $19,000 for the year—far below the amount a family with two children needs to live comfortably.

As the pandemic continues on, citizens and certain lawmakers continue to urge for additional relief to aide affected families and the economy. Just last week, Gov. Gretchen Whitmer called on the legislature to permanently extend the unemployment benefits length to 26 weeks and also increase the weekly amount (no amount was specified). No movement has been made on the request. Michigan’s current unemployment benefits were inked into law in 2002 and are due for an overhaul. The way it currently stands, hundreds of people could be left without unemployment benefits the day after Christmas because of a combination of having maxed out their time receiving Michigan unemployment benefits and the fact that federal COVID unemployment programs created through the CARES Act are set to expire. Changes to unemployment benefits need to take place at the State level, but help from the federal government is also necessary, especially during the pandemic. 

Where are the Deer at in Southeastern Michigan?

There are about 2 million deer in the State of Michigan and they are most active in the spring and fall at dusk and dawn. Such activity, especially in areas more heavily populated by deer and vehicles, can be attributed to thousands of deer-vehicle crashes a year. According to Michigan Traffic Facts, in Southeastern Michigan in 2019 Oakland County had the highest number of deer-vehicle crashes at 1,836. It is estimated by data3 from ArcGIS that Oakland County has a deer population of about 13,000, or 15 deer per square mile. Regionally, Livingston County has the highest deer population at about 25,400, or 45 deer per square mile. According to the data, there were 905 deer-vehicle crashes in Livingston County in 2019. Wayne County reported the fewest number of crashes in 2019 at 499; Wayne County’s deer population is estimated to be about 9,200 per square mile.

Washtenaw County data is forth coming.

While the size of a deer population plays a role in the number of deer-vehicle crashes in a county, so does the amount of traffic and how their living environment has been impacted. The Average Annual Daily Traffic map from the Southeastern Michigan Council of Governments shows that Livingston County has far less daily traffic than Oakland County. So, while Livingston County may have a higher deer population than Oakland County, the amount of traffic clearly plays a role. Also, according to the Michigan State Police, 80 percent of deer-vehicle crashes occur on two-lane roads.

As areas further develop, deer and humans are also interacting more, particularly as deer become more comfortable with their new neighbors. Backyard gardens, bird feeders and other items the deer prefer to munch on also bring them more in contact with humans, and the areas they live in—including their roadways–as they look for easily accessible areas to eat.

Deer-vehicle crashes may not be entirely avoidable but there are solutions to at least curb them. Such ways to avoid crashes with a deer include:

  • Watching the sides of the road as you drive, particularly in low visibility or tall grasses and woods near the road;
  • Being aware for groups of deer. If one deer crosses the road there is a good chance more may cross as they tend to travel in groups;
  • Using high beams at night (when possible) to help see farther ahead and to identify the eye-shine of a deer;
  • Avoiding swerving around a deer, instead break firmly and honk the horn;
  • Slowing down.

Government entities can also help curb the amount of deer-vehicle crashes by:

  • Enforcing speed limits;
  • Installing fences 8 feet or higher in high deer traffic areas to keep them off the road;
  • Studies to identify frequently used pathways of deer and setting up warning signs for drivers.
  • Installing specific devices that warn deer of oncoming traffic to scare them away from the road.

Oakland County’s COVID Numbers Surpass Wayne County

Michigan reported 5,772 new COVID cases on Nov. 18, 2020, bringing the total number of confirmed cases to 277,806. In Chart 1 we show that the State total for the number of confirmed COVID cases on Nov. 16 was 264,884–a five-day rolling average. The five-day rolling average for the total number of COVID cases (Chart 1) reflects a smoother curve and adjusts for fluctuations in testing and/or the quality of reporting or failure to report. This chart also shows that the curve continues to increase at a much higher rate than previously.

Chart 2 shows that on Nov. 16, according to the five-day rolling average, Oakland County reported the highest number of confirmed COVID cases in Southeastern Michigan at 32,190; Oakland County surpassed Wayne County as having the highest number of confirmed cases on Nov. 11. Wayne County reported the second highest number of cases on Nov. 16 at 31,527. Macomb County reported 28,088 COVID cases on Nov. 16 and Detroit reported 17,893.

As shown in Chart 3, new daily numbers continue to spike above early daily highs, although there has been a decrease in the last few days. Wayne County reported the highest number of new daily confirmed cases on Nov. 16 at 93, followed by Macomb County with 92 new confirmed cases and Oakland County with 91. Detroit reported 43 new daily confirmed COVID cases on Nov. 16. These numbers are also based on a five-day rolling average.

The daily data highlighted in these posts is from Michigan.gov/coronavirus, where data is updated daily at 3 p.m. Historical data were supplied from covidtracking.com, which republishes COVID data from the State. Additionally, the case totals do not reflect the number of people who have recovered, just those who have been infected. In early June the State changed how it reports its data on the website, making data more accurate in the long-term but more complicated to track as well. The State regularly updates older data and as we continue to publish regular updates on COVID the State’s changes to past data many not always be reflected in our posts. The data published in new posts is accurate for the day we received it on though.

The chart below (Chart 4) shows that Macomb County has the highest number of COVID confirmed cases per capita. According to the data released on Nov. 18, Macomb County had 33,506 COVID cases per million people. Wayne County had the second highest number of confirmed cases per million people at 31,496. Detroit had 12,068 confirmed COVID cases per million people; no other counties in the region had fewer number of cases per capita.

In Chart 5, the five-day rolling average for the number of deaths, shows the number of deaths in the State of Michigan reached 8,078 on Nov. 16. The actual cumulative COVID-19 deaths on Nov. 18 was 8,190, an increase of 62 deaths from the prior day. Chart 6 (a five-day rolling average) shows that on Nov. 16, the City of Detroit reported 1,565 deaths. Wayne County had the second highest total at 1,389 deaths on Nov. 16. Death related numbers overall remain flat, however hospitalizations are rapidly increasing according to Bureau of Epidemiology at the Michigan Department of Health and Human Services Director Sarah Lyon-Callo.

Yesterday (Nov. 18) marked the beginning of a three week pause on certain operations such as indoor dining, high school and college in-person learning and recreational activities such as movie theater going and indoor skating. This pause is meant to slow the spread of the virus in Michigan, which has been particularly rampant the last several weeks. Currently,  Michigan has sixth highest number of COVID-19 cases in the country and the fifth highest number of deaths.  A pause will not suffice in slowing the spread though; continued diligence in wearing a mask, washing hands, keeping a distance from others and not participating in group activities it what is truly needed to bring new daily case numbers back down.

COVID Continues to Impact Michigan Economy

The COVID-19 pandemic continues to have an impact on the national, statewide and local economy. This will most certainly continue as new daily case numbers continue to rise. On Nov. 9, 2020 the State of Michigan reported 216,804 confirmed COVID cases, between Nov. 7 and Nov. 8 the Michigan Department of Health and Human Services estimated that was an average of 4,505 new COVID cases a day. Although Gov. Gretchen Whitmer does not have the executive powers she once did, the Michigan Department of Health and Human Services, and other agencies, have the ability to institute certain mandates. Currently, several—but certainly not all — businesses remain open, but scrutiny on safety precautions to slow the spread is increasing.

Current unemployment rates are discussed in this post to show one facet of the economic impact the pandemic has had on the economy. In future posts we will continue to dig into the other economic impacts of the virus, and also how local governments have fared with federal and state aide.

In September of 2020 the unemployment rates for the State of Michigan and for the City of Detroit declined from recent record highs as a result of COVID-19. However, unemployment rates remain higher now than at this time last year. The State of Michigan reported an unemployment rate of 8.2 in September, a lower rate than what was reported in August, which was 8.9. The State unemployment rate for September of 2019 was 3.5. In September of 2008, when the Great Recession was just getting underway, the unemployment rate was 8.4 percent.

For the City of Detroit, the unemployment rate for September of 2020 was 20.4, which is only slightly lower than the August rate of 20.9. In September of 2019 the unemployment rate was 8.1.

The data above shows a story that we are all familiar with now, the pandemic has had a direct affect on our economy locally and statewide. Another image the data highlights though is that the unemployment gap between the State and Detroit has grown wider since the pandemic hit. Federal Reserve Chairman Jerome Powell was recently quoted in the Detroit Free Press saying women, minorities and low-income workers are suffering the most in this downturn. Detroit is home to the largest black population in the state and also has among the highest percentage of residents who live at or below the poverty level.

The chart below displays the unemployment rates for each of the seven counties in Southeastern Michigan for September of 2019 and 2020. In September of 2020 Wayne County had the highest unemployment rate at 12.5. Washtenaw County had the lowest unemployment rate at 5. Each county though had a higher unemployment rate in September of this year compared to September of 2019. Just as Wayne County had the highest unemployment rate it also had the largest increase between 2019 and 2020; in that year it increased 7.1 points. Washtenaw County had the lowest increase at 1.7 points.

In addition to COVID impact employment rates, it has also impacted the housing stock and sale and rental rates. According to a recent Detroit Free Press article, housing prices continue to increase due a high demand but low stock of homes, low mortgage rates and also the fact that the early shutdown of the economy pushed the spring home selling season farther out into summer and now fall.

The chart below shows the Standard and Poor’s Case-Shiller Home Price Index for the Detroit Metropolitan Statistical Area. The index includes the price for homes that have sold but does not include the price of new home construction, condos, or homes that have been remodeled. While it does show an increase in average home prices, it has yet to reflect those of late summer and early fall.

According to the index, the average price of single-family dwellings sold in Metro Detroit was $132,460 in July of 2020; this was $131 higher than the average family dwelling price in June. The July 2020 price was an increase of $3,240 from July of 2019.

Looking Back: Voter Turnout in Southeastern Michigan’s Past Presidential Elections

Voting matters, and so does voter turnout. 

While record breaking turnout is expected for tomorrow’s election, we won’t know the results for a few days still. However, past data and current polls can help put this into context. So, we are re-examining the voter turnout change between the 2012 and 2016 Presidential Elections.

In 2016 Republican areas in Southeastern Michigan experienced marginally increased turnout between the 2012 and 2016 Presidential elections. The focus of that increase was southern Macomb County and the Downriver area in Wayne County. Conversely, the traditionally Democratic areas in Wayne County experienced some of the largest voter turnout decreases. Detroit saw especially large decreases.

In Macomb County, 15 communities experienced voter turnout increase, with increases ranging between 2.5 and 0.06 percent. Ray Township experienced the largest voter increase at 2.5 percent. Another interesting community that experienced voter turnout increase was St. Clair Shores; this city that flipped from Democratic to Republican, and here voter turnout increased by 1.6 percent. There were also eight of the communities that experienced a voter turnout decrease between the 2012 and 2016 Presidential elections. It was Chesterfield Township that experienced the largest decrease in the county at 5.35 percent. Although Warren and Sterling Heights have been noted for having several precincts flip from Democratic to Republican between the two Presidential elections, both cities had areas that remained Democratic in 2016. Sterling Heights experienced a 2.7 percent voter turnout decrease in 2016 and Warren experienced a 1.5 percent decrease.

We have previously  highlighted how in Oakland County higher income communities like Bloomfield Hills and Birmingham flipped from being Republican in the 2012 presidential election to Democratic in the 2016 election. These communities though experienced a voter turnout decrease between the two elections, as did majority of the Oakland County communities that went Democratic in 2016. With the exceptions of Ferndale, Madison Heights and Clawson, all of the Democratic communities experienced a voter turnout decrease in 2016. Ferndale had the largest voter turnout increase in the county at 11.6 percent while Berkley had the largest decrease at 23.7 percent.

Wayne County communities experienced some of the largest decreases in voter turnout in 2016, with Inkster experiencing a 26 percent decrease, River Rouge experiencing a 23 percent decrease and Redford and Detroit experiencing 11 percent decreases, each. Again, these communities all went Democratic in the 2016 election; they also went Democratic in the 2012 election.

Throughout much of Downriver, an area that flipped from Democratic to Republican in 2016, an increase in voter turnout occurred. Rockwood had the largest increase at 7 percent. The city of Flat Rock did flip from Democratic to Republican between the two elections, but experienced a 16.36 percent voter turnout decrease.

Hamtramck and Highland Park experienced the largest voter turnout increases in Wayne County; Hamtramck had a 12 percent increase and Highland Park had an 11 percent increase. Both cities went Democratic in the 2012 and 2016 elections.

In Washtenaw County, Ann Arbor Township had the highest voter turnout increase at 3.37 percent; this community went Democratic in both elections. The only Washtenaw County community that went Democratic in the 2016 election and experienced a voter turnout increase was Sylvan Township; it had a 0.37 percent increase. There were, however, several Republican communities in Washtenaw County  that experienced voter turnout increases. For example, Northfield Township experienced a 19.6 percent voter turnout increase.

Overall, the data comparing the 2012 and 2016 Presidential elections show there were very few communities in Southeastern Michigan that experienced large voter turnout increases (above 10 percent). The marginal increases though occurred in areas that went Republican in the 2016 Presidential election, particularly in northern Macomb County, St. Clair County and the Downriver area in Wayne County. Voter turnout for this election will certainly impact the results. 

According to the Michigan Secretary of State there are more than 8 million registered voters in the State of Michigan as of Nov. 1, 2020. Additionally, 6.76 million of those are considered active voters, according to the Michigan Secretary of State. Election officials are expecting the Nov. 3, 2020 Presidential Election to be record breaking in terms of the number of ballots cast, and as of late last week Michigan Secretary of State Jocelyn Benson said more than 2.6 million Michigan residents had already cast a ballot, while about 3.3 million absentee ballots have been requested. Have questions about voter registration, your ballot or your polling location? Click here

Michigan’s New Daily COVID Numbers Continue to Rise Above 1,000

Michigan reported 1,586 new COVID cases on Oct. 20, 2020, bringing the total number of cases reported to 149,392. In Chart 1 we show that the State total for the number of COVID cases on Oct. 18 was 145,751–a five-day rolling average. The five-day rolling average for the total number of COVID cases (Chart 1) reflects a smoother curve and adjusts for fluctuations in testing and/or the quality of reporting or failure to report.

Chart 2 shows that, based on the five-day rolling averages, the growth of new COVID cases in Wayne, Oakland and Macomb counties continues to increase at higher rates than the other counties in the region and than Detroit. On Oct. 18, Wayne County reported the highest number of cases in the region at 20,322. Oakland County reported 18,589 cases and Macomb County reported 16,065. Detroit reported 14,969 COVID cases on Oct. 18; Macomb County surpassed the total number of confirmed cases in Detroit on Oct. 6. While the more densely populated areas in the region have the highest number of confirmed cases, Washtenaw County has pulled away from the other more rural counties in with higher numbers as well. Washtenaw County reported 4,190 confirmed cases on Oct. 18.

As shown in Chart 3, Oakland County reported the highest number of new daily confirmed cases on Oct. 18 at 94, followed by Wayne County with 78 new confirmed cases and Macomb County with 73. Washtenaw County reported 35 new daily confirmed COVID cases on Oct. 18 while Detroit reported 21. These numbers are also based on a five-day rolling average.

The daily data highlighted in these posts is from Michigan.gov/coronavirus, where data is updated daily at 3 p.m. Historical data were supplied from covidtracking.com, which republishes COVID data from the State. Additionally, the case totals do not reflect the number of people who have recovered, just those who have been infected. In early June the State changed how it reports its data on the website, making data more accurate in the long-term but more complicated to track as well. The State regularly updates older data and as we continue to publish regular updates on COVID the State’s changes to past data many not always be reflected in our posts. The data published in new posts is accurate for the day we received it on though.

The chart below (Chart 4) highlights how Wayne County not only has the highest number of confirmed total COVID cases in the region (this data does not include Detroit’s numbers) it also has the highest number of confirmed cases per capita. According to the data released on Oct. 20, Wayne County had 23,598 COVID cases per million people. Macomb County had the second highest number of confirmed cases per million people at 19,351. Detroit had 10,019 confirmed COVID cases per million people; the only two counties in the region with few number of cases per capita were Livingston and St. Clair counties.

In Chart 5, the five-day rolling average for the number of deaths, shows the number of deaths in the State of Michigan reached 6,996 on Oct. 18. The actual cumulative COVID-19 deaths on Oct. 20 was 7,053, an increase of 22 deaths from the prior day, with one of those deaths being added to the total through death record reviews. Chart 6 (a five-day rolling average) shows that on Oct. 18, the City of Detroit reported 1,546 deaths. Wayne County had the second highest total at 1,309 deaths on Oct. 18. Although the curved has flattened for the number of COVID deaths in Southeastern Michigan, the numbers are still growing, just at a much slower pace.

COVID-19 numbers in Michigan continue to increase at a quicker rate than what has occurred in months. Classrooms and gatherings some of the main areas where outbreaks are occurring. According to the State of Michigan, as of Oct. 15, there were outbreaks in 84 Michigan school buildings in 31 counties. Overall, between Oct. 8 and Oct. 15 there was a 25 percent increase in K-12 classroom outbreaks. Furthermore, universities are also seeing increases in the student population contracting COVID. To slow the spread within this community some universities and local health departments are taking their own precautions. For example, the Washtenaw County Health Department just issued a 2-week stay at home order for University of Michigan undergraduate students to curb the spread. In Washtenaw County last week the number of new confirmed and probable COVID cases increased by more than 600. 

As the daily number of confirmed COVID cases continue to increase by more than 1,000 daily we must continue practice the mandates set forth by the Michigan Department of Health and Human Services, which includes wearing masks, remaining socially distant and limiting social gatherings.

A Look At Michigan’s Local Income Taxes

In the State of Michigan local governments have the ability to levy a local income tax on those who live and/or work in the municipality. There are 24 municipalities in Michigan that levy a local income tax for residents, non-residents and corporations. According to the Citizens Research Council of Michigan, the cities of Detroit and Hamtramck were the first two municipalities in the state to levy local income taxes in 1962. As of 2018 Detroit levied at 2.4 percent income tax on residents and a 1.2 percent income tax on non-residents. In Hamtramck, a 1 percent income tax was levied on residents and a 0.5 percent income tax was levied on non-residents. According to Michigan tax law, and as is shown, non-residents cannot be taxed more than 50 percent of the local income taxed on residents. 

According to Michigan tax law, in general, a 1 percent income tax can be charged on residents and corporations and a 0.5 percent income tax can be changed to non-residents earned in the imposing city. The city council in cities over 600,000 (Detroit) may impose rates of up to 2.4 percent on residents, 2 percent on corporations and 1.2 on non-residents. Furthermore, a city that levied an income tax and where more than 22 mills had been levied for city purposes and at least 65 mills for all purposes during the prior calendar year is allowed to impose local income tax rates of up to 2 percent on residents and corporations and 1 percent on non-residents if approved by voters before Nov. 15, 1988. Additionally, cities that levied an income tax before March 30, 1989, and with (a) populations between 140,000 and 600,000 (Grand Rapids); or (b) populations between 65,000 and 100,000 in a county with a population below 300,000 (Saginaw) may increase the tax rate to not more than 1.5 percent on residents and corporations and 0.75 percent on nonresidents if approved by voters. 

According to the State of Michigan, Detroit has the highest income tax at 2.4 percent, followed by the City of Highland Park at 2 percent (both of which are imposed on residents). A 2 percent local income tax was imposed on corporations in Detroit and Highland Park as recent as 2018, according to the Citizens Research Council. 

 In 2017 (most recent data available) Detroit levied about $292.7 million through its local income tax on residents, non-residents and corporations; Hamtramck levied $2.3 million Grand Rapids and Sagniaw each levied 1.5 percent income taxes on residents and corporations. Grand Rapids levied the second highest amount in local income taxes at about $94 million. Of course, the amount each city levies is not only dependent on the amount levied by the three groups but also by the population of who lives there, who works there and what businesses are there. 

In addition to the cities above the, the following cities issue income taxes of 1 percent on residents and corporations:

  • Albion
  • Battle Creek
  • Benton Harbor
  • Big Rapids
  • East Lansing
  • Flint
  • Grayling
  • Hamtramck
  • Hudson
  • Ionia
  • Jackson
  • Lansing
  • Lapeer
  • Muskegon
  • Muskegon Heights
  • Pontiac
  • Port Huron
  • Portland
  • Springfield
  • Walker

The city that earned the lowest amount in a local income tax is Hudson at about $484,000.

In addition to the cities discussed above, the City of Mount Clemens has also discussed levying a local income tax to earn more local revenue. Mount Clemens is the county seat in Macomb County, which employs about 2,000 county employees. Local income taxes are a means for a local government to generate additional revenue. And, while it helps the local governments–especially ones who lack additional means to levy revenue–it also impacts those who live in the municipality and those who work and/or own a business there.