A Look At Our Fathers

We may have just celebrated Father’s Day, but year-round dads work and take care of their children. For many, this is reflective in a more traditional, nuclear setting but there are thousands of instances where the dad is the sole caretaker–in more ways than one. 

According to the 2019 American Community Survey, information on the percentage of children living with only their father is categorized by those 6 years of age and under and then those between the ages of 7-17. Throughout Southeastern Michigan less than 5 percent of children 6 years of age or younger in each county live solely with their father. According to the data, in 2019 Macomb County had the highest percentage of children 6 years of age or younger only living with their father at 3.4 percent, followed by Monroe County where 3.2 percent of children 6 years of age and younger lived with only their father. In St. Clair and Wayne counties 3 percent of children 6 years of age and younger lived with their father. For those between the ages of 7 and 17, Macomb County again had the highest percentage of children living with only their father at 6.8 percent. Wayne County had the second highest percentage of children living with only their father at 6.4 percent and Washtenaw County had the lowest percentage of children between the ages of 7-17 living with only their father at 3.3 percent.

In addition to tracking data on the percentage of children living with only their father, the Census also tracks how many children live in a home with both a mother and father, but where only the father works. For the 6 years of age and younger group, Monroe County had the highest percentage of married fathers being the sole income providers for the family at 9.5 percent, followed by Macomb County at 9.2 percent. Washtenaw County had the lowest percentage of married fathers with children 6 years of age or younger who were the sole income providers at 5.8 percent. For the 7-17 age range, Livingston County had the highest percentage of children of married fathers being the sole income providers for the family at 15.4 percent, followed by Macomb County at 13.7 percent. 

While this post shows data on fathers that is not traditionally seen, in researching data on fathers it was also discovered that data sets on them are not as extensive as on mothers. None-the-less, fathers deserve thanks year-round, whether they are serving as the sole income provider for a home, supporting their family with a partner or raising children on their own. 

Rental Prices in Southeastern Michigan Continue to Rise

The rental market in Southeastern Michigan is mirroring that of the home-buying market. With low supply and rising prices, being further driven up by high demand, many are finding it difficult to secure a rental home, especially one they can afford, according to various news sources. 

According to Re/MAX of Southeastern Michigan, there are fewer rental units on the market than homes for sale. There were 2,480 single-family homes for rent from January through April, across 18 counties in central and southeastern Michigan, according to Realcomp. That number has decreased for two consecutive years, with 3,090 rental homes being available the same period in 2020, and 3,514 through the same period in 2019. 

Below shows the percentage of vacant rental units available in 2019 by county in Southeastern Michigan, according to the American Community Survey. As shown, Oakland County had the highest percentage of vacant rental units at 23.8 percent, followed by Macomb County at 22.9 percent. St. Clair County had the lowest available rental stock at 7.3 percent. As mentioned above though, available rental stock across the region, and state, has decreased, increasing demand and making it more difficult and competitive for individuals to find rental units. According to Re/MAX, another factor driving low rental unit stock is that would-be homebuyers are remaining in rentals longer due to the low stock and high price of homes for sale.

According to a recent Detroit News article, rental prices have increased upwards of 20 percent in the last year. According to the 2019 American Community Survey, Washtenaw County had the highest median gross rent at $1,114, followed by Oakland County with a gross median rent of $1,040 and Livingston County with a gross median rent of $1,053. These were the only area counties with gross median rents above $1,000 but with rental prices increasing upwards of 20 percent throughout the region, others, such as Macomb County (2019 median rent of $962) will be above that threshold. 

According to the Detroit News, which used ApartmentGuide.com as a source, the average rent for a one-bedroom apartment in Detroit rose from $1,332 to $1,516 between April 2020 and April 2021, and a two-bedroom apartment in Detroit rose from $1,764 to $2,319. In Farmington Hills, which is also in Wayne County, the average rent for a one-bedroom increased from $1,134 to $1,289 from April 2020 to April 2021, and a two-bedroom increased from $1,442 to $1,655. The City of Troy experienced the largest year-to-year change at 63.3 percent, according to the data, while Southfield experienced a 33 percent change and Rochester Hills experienced a 30 percent change. Ann Arbor, Grand Rapids, Lansing and Ypsilanti, all college towns, experienced decreases in average rental prices between 2020-2021, likely due to the decreased numbers of students needing housing because of the COVID-19 pandemic.

With increased rental unit pricing comes the concern of affordability. The average rule of thumb is that those who rent should spend about 30 percent of their income on their rental unit. In 2019, according to the American Community Survey, the average resident living in Wayne and Monroe counties was already living above that. According to the data, the average percentage of gross income spent on rent in Wayne County was 32 percent and in Monroe County it was 30.7 percent. Macomb, St. Clair and Washtenaw counties were all at the 30 percent threshold (29.3%, 29.7% and 29.8%, respectively). Oakland County had the lowest percentage of gross median income spent on rent at 26.8 percent.

Increasing rental prices, driven by lack of supply, will affect thousands of people throughout the region. According to the 2019 American Community Survey, in Wayne County, 38 percent of occupied housing units in the county were occupied by renters. In Washtenaw County that percentage was 39, but it likely decreased in 2020 and 2021 due to the lack of students on college campuses because of the pandemic. Livingston County had the lowest percentage of occupied housing units occupied by renters at 15; all other counties in the region had percentages above 20.

The low rental stock and increase of rental prices is now drawing even greater concern as the Centers for Disease Control and Prevention’s moratorium on some evictions is set to end June 30. According to Michigan’s 2-1-1 service, which is a United Way service that connects individuals with various agencies to provide assistance, 21,318 inquiries were made between March 5, 2020 and June 9, 2021 about rental assistance. Furthermore, according to the Census Bureau’s Pulse Survey, about 250,000 Michigan residents said they were behind on rent or mortgage payments as of April 26, 2021.  In March of this year, Gov. Gretchen Whitmer approved allocating about $282 million in federal rental aid, $220 million of which is for emergency rental assistance. Michigan also received $660 million in rent aid from Congress in December of 2020, but how it can be allocated must be approved by the Michigan legislature. There may also be another round of funding of about $223 million to come to Michigan from the federal government, according to the Michigan State Housing Development Authority.

Number of Michigan Concealed Pistol Licenses Continues to Rise

As of June 1, 2021 there were 751,102 approved Concealed Pistol Licenses (CPLs) in Michigan, a number that has been increasing over the years. Of that total, 46 percent of those license holders reside in Southeastern Michigan. Within Southeastern Michigan, Wayne County has the highest number of CPL holders at 120,164, followed by Oakland and Macomb counties (89,596 and 72,515, respectively).

In order to obtain a CPL a Michigan resident must meet the following requirements:

  • Be at least 21 years of age
  • Be a citizen of the United States or an alien lawfully admitted into the United States
  • Be a legal resident of Michigan and reside in Michigan for at least six months immediately prior to application.
  • Not have been convicted of various crimes
  • Meet certain requirements regarding mental illness
  • Complete a CPL class

To view the entire criteria list click here

In 2016 County Gun Boards were eliminated; these bodies had the power to deny an individual a CPL if the license was deemed detrimental to the applicant or others. Now, County Clerks and the Michigan State Police process concealed weapon applications. As noted earlier, since then the number of CPLs in Michigan has increased. As of December 2016 there were 497,016 active CPLs in Michigan and now there are 751,102.

The cost of the CPL application process varies between counties (specifically County Clerk departments) and according to the Michigan State Police, in Southeastern Michigan it cost Washtenaw County the most, on average, to process an application at $36.08. Livingston County had the lowest average cost at $14.81. 

The data used for this post is from the Michigan State Police.

A Look Into Southeastern Michigan’s Housing Price Spike

It’s no secret that over the last year-and-a-half the housing market has experienced an increase in the number of sales and prices and a decrease in stock. At a time when economic stability has been uncertain for hundreds of thousands, an obvious question is—what is driving the housing market up? As the data sets below show there are several factors behind rising sales and decreasing housing stock.

First, understanding how the average price of a single-dwelling unit has changed over the last several years is important in understanding how housing prices got to where they are today. According to the Case-Shiller Home Price Index, the average price of single-family dwellings sold in Metro Detroit was $148,500 in February of 2021; this was $1,500 higher than the average family dwelling price in January. The February 2021 price was an increase of $14,070 from February of 2020 (over a 10 percent increase) and $49,430 from February of 2014. Home prices have continued to increase year-after-year but the recent average price of single-family dwellings sold in the Metro-Detroit area has increased at a higher rate than in previous years.

One reason behind the increased cost of a single family dwelling unit is the supply. Simply put, the availability is not meeting the demand. According to a RE/MAX of Southeastern Michigan housing report from March, the supply of inventory for available homes is at less than a month. A balanced housing market has six months supply of inventory, according to RE/MAX. According to the National Association of Realtors a months supply of inventory means the number of months it would take for the current inventory of homes to sell if no other homes were to hit the market.

One way to increase inventory is to build more homes. However, this takes time and also costs money. According to the Federal Reserve of Economic Data there were 942 housing starts in the Detroit-Warren-Dearborn Metropolitan Statistical Area as of March 1, 2021; on March 1, 2020 there were 452 housing starts. While the data shows an increase in housing starts since 2020, housing starts have not reached the peak levels of 2017 (1,308 on May 1, 2017). In order to move housing starts along there needs to several things, including demand, enough workers to meet demand, and supplies.

Lumber is a large component in building homes, and completing remodels. With a higher demand for new housing starts and remodels, the price of lumber has increased nationally. According to the National Association of Home Building, lumber prices have increased by more than 300 percent since April 2020; this has caused the average price of a new single-family home to increase by nearly $36,000.

The chart below shows an overview of how framing lumber prices have fluctuated, and grown, in recent months. As of May 14, 2021 the average price of lumber per thousand board feet was about $1,500; in early November of 2020 the price was recorded at just under $600. The information is sourced each week using the Random Lengths Framing Lumber Composite which is comprised using prices from the highest volume-producing regions of the U.S. and Canada.

In addition to supply and demand of housing stock and materials, low mortgage rates are also behind an increase in home sales. According to the National Association of Home Builders the average annual rate of a 30-year fixed mortgage in April 2021 was 3.15 percent; the average annual rate for a 15-year fixed mortgage in April 2021 was 2.47 percent. The data shown below goes back to February of 2015 and in that time frame rates have never been as low as they have been within the last year. While the April rates are slightly up from the December 2020 rates, overall mortgage rates have been decreasing since December of 2018.

Work from Home Capabilities Continue to Drive Movement to the Metro-Detroit Suburbs

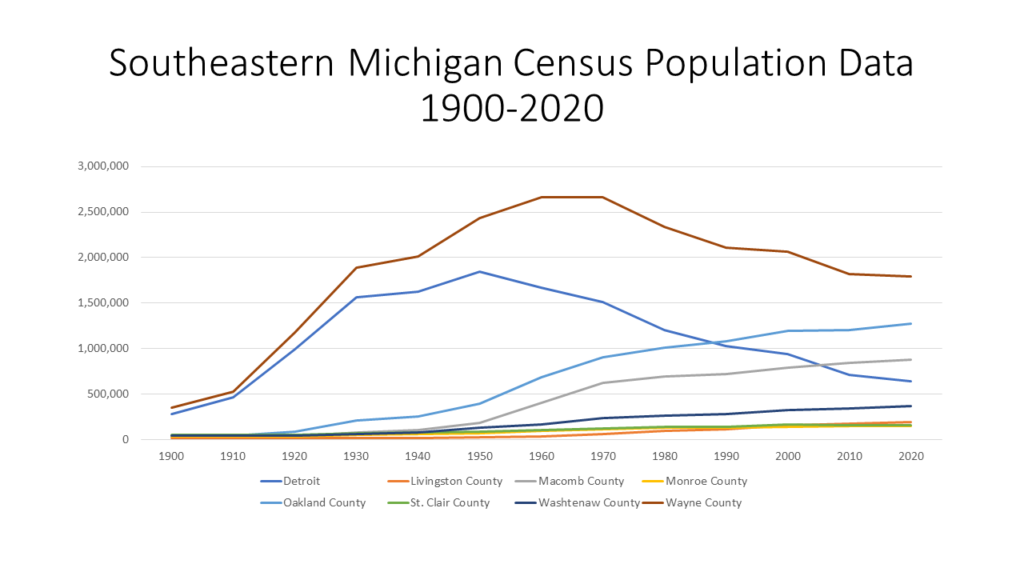
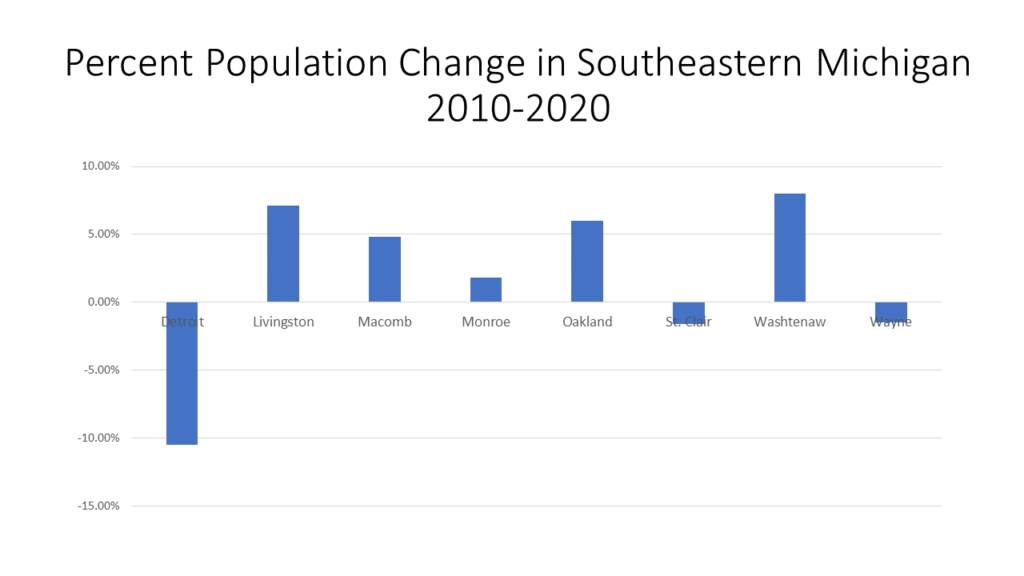
Suburbs are “in” again, according to recent research highlighted in the Wall Street Journal, after nearly a decade of increased migration to and interest in cities. However, while the pandemic has changed how many of us live, and plan to live, Census data shows that in Southeastern Michigan there has been a trend for some time of people leaving the more heavily populated areas and moving to the less dense areas, and increasing density there.

In 2019 Wayne County had the highest population density at 2,872 people per square mile. Detroit is located in Wayne County and in 2019 it had a population density of 4,689 per square mile, which remains the highest in the state despite decades of decline. As both the second and third map below show migration out of Wayne County has been the highest in the region since at least 2010. Between 2019 and 2014 there was a 1.8 percent decline in the population density of Wayne County and between 2010 and 2019 the total decline came in at 6 percent. Wayne County had a population of 1.75 million people in 2019 as compared to 1.77 million in 2014.

Washtenaw County, which had a population density of 520 people per square mile in 2019, experienced the highest percentage increase in population density between 2014-2019 and 2010-2019. According to Census data, between 2014-2019 there was a 4.3 percent increase in population density and between 2010-2019 there was a 6.7 percent increase. In 2019 Washtenaw County had a population of 367,601.

In Southeastern Michigan, Wayne, Macomb and Oakland counties all had the highest population densities at 2,872, 1,814 and 1,475, respectively. While Wayne County has lost population in recent years, Macomb and Oakland counties gained it, and with that came an increase in density. Between 2010-2019 Macomb County experienced a 3.9 percent increase in its population density and Oakland County experienced a 4.4 percent increase. Aside from Washtenaw County, Livingston County was the only other one to experience an increase; between 2010-2019 Livingston County experienced a 3.6 percent increase in population density. Monroe and St. Clair counties remain the least densely populated and have lost density since 2010 (a smaller decrease than Wayne County).

According to HomeSnacks.com, which ranks the fastest growing communities based on Census data, the following places have experienced the highest percentage of population growth since 2010 in Michigan:

  • Rockford
  • Novi
  • Coldwater
  • Auburn Hills
  • East Grand Rapids
  • Chelsea
  • New Baltimore
  • Milan
  • Kentwood
  • Rochester

Of these 10 communities, three are  in Oakland County (Novi, Rochester, Auburn Hills), one is in Macomb County (New Baltimore) and two are in Washtenaw County (Chelsea and Milan); none are in Wayne, Washtenaw or Monroe counties, all of which have been losing residents.

So, while Southeastern Michigan has been experiencing the migration of residents out of the Detroit for sometime, it is expected to continue. According to a recent Wall Street Journal article, the pandemic has caused the largest cities in the country to experience an exodus of residents, in part, due to an increased accessibility of remote work. According to the Wall Street Journal’s analysis of US Post Service data and Census data, the Midwest, Northeast and West all lost residents since the pandemic began while the South gained residents.

A shift in migration also means there will be, eventually, a shift in the fiscal health of cities and regions. In areas where people are leaving, tax revenue will also depart. What this could mean for places like Detroit and Michigan has yet to remain seen. However, with the continued out-migration of residents from Michigan over the last decade we do know that the State is losing another Congressional seat.

Certain Detroit Crime Incidents Decrease in 2020

The Detroit Police Department publishes public data on the number of crime incidents that occur by type of crime, precinct and year on its open data portal. The information provided below has been retrieved from this data portal and highlights the number of incidents, not victim counts, for each Detroit precinct in 2019 and 2020. The crimes reported on in this post are:

•Assault: attempt to cause physical injury to another person;

•Aggravated assault: assault, without a weapon, that results in a serious or aggravated injury;

•Homicide: the killing of another person, whether intentional or not;

•Sexual assault: forcing or coercing an individual to engage in any non-consensual sexual contact or sexual penetration.

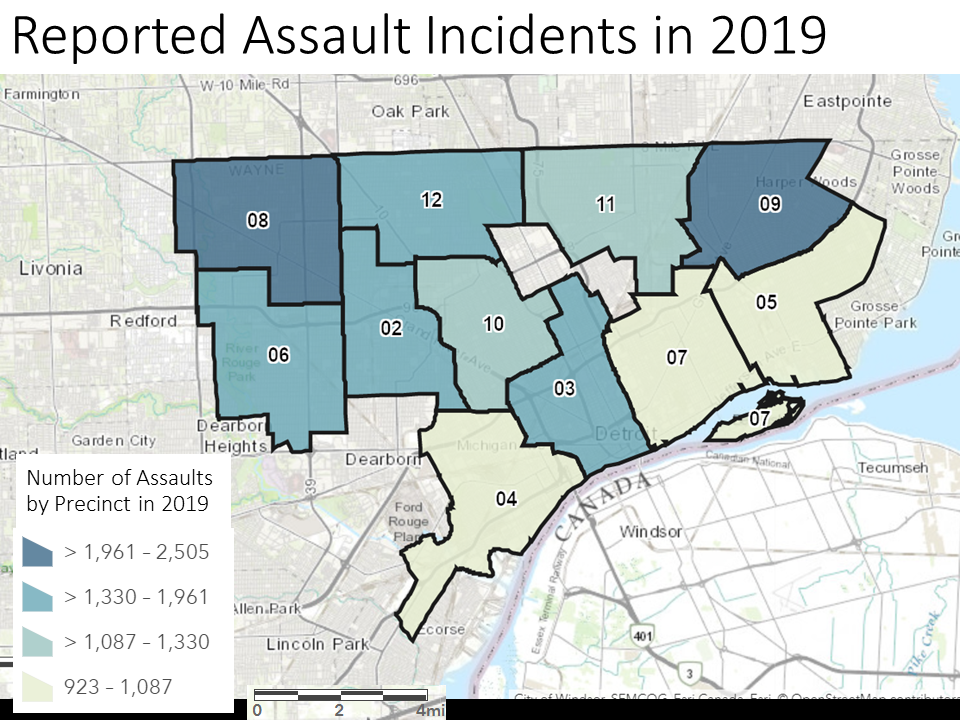
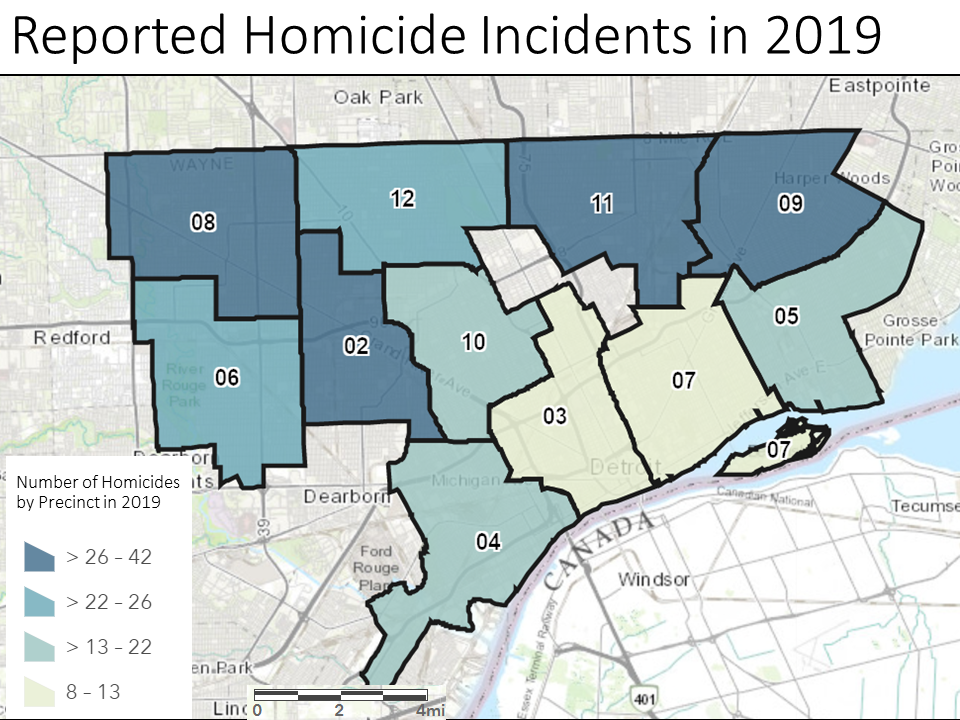
The number of reported incidents for each type of crime varies across the precincts but one data piece stands out amongst all four types of crime: there was a decrease in reported incidents between 2019 and 2020. In both 2019 and 2020 the highest number of reported incidents was under the assault category, followed by the aggravated assault category and then sexual assaults and homicides.

In 2019 the Detroit Police Department reported 17,233 assault incidents and in 2020 it reported 12,534 assault incidents. Of the 11 precincts, Precinct 8 had the highest number of assault incidents in both 2019 and 2020. In 2019 there were 2,505 assault incidents reported in Precinct 8 and 1,660 in 2020. Precinct 4 had the lowest number of reported assault incidents in 2019 at 913 and Precinct 7 had the lowest number of assault incidents in 2020 at 657.

In 2019 the Detroit Police Department reported a total of 7,708 aggravated assault incidents and in 2020 a lower number of 7,311 incidents was reported. In both 2019 and 2020 Precinct 9 had the highest number of reported aggravated assault incidents at 1,210 and 1,107, respectively. Precinct 3 had the lowest number of reported incidents in 2019 and 2020 at 421 and 315, respectively. 

Between 2019 and 2020 there was a decrease in the number of reported homicides in the City of Detroit, according to the police department’s open data portal. In 2019 there were 276 reported homicides and in 2020 there were 244. Precinct 9 had the highest number of reported homicides in both 2019 and 2020 at 42 each year. Precinct 3 had the lowest number of reported homicides in 2019 and 2020 at 8 and 12, respectively.

In 2019 there were 817 reported sexual assault incidents in the City of Detroit, according to the police department’s open data portal. In 2020 467 sexual assault incidents were reported. Precinct 9 had the highest number of reported incidents in 2019 at 131; this was the only precinct in 2019 and 2020 with more than 100 sexual assault incident reports. In 2020 Precinct 8 had the highest number of incidents reported at 57. In 2019 Precinct 7 had the lowest number of reported sexual assault incidents at 40 and Precinct 4 had the lowest number of reported incidents at 27 in 2020.

Recent 2019 FBI data highlights how crime rates across the country continued to increase from 2018 to 2019. For example, in Detroit, shootings and homicides rose for the second-straight year, by 53 percent and 19 percent, respectively. And, while national FBI crime data helps paint a broad picture on crime trends, the 2020 data provided by Detroit’s open data portal shows that in 2020 there was a decrease in crime incidents. Of those reported on here—assault, aggravated assault, homicide and sexual assault—there was a decrease from 2019 to 2020 across the board.

According to the United Nations Office on Drugs and Crime the COVID-19 pandemic impacted crime statistics for several reasons. Certainly the initial lockdown, which kept many social interactions at bay, likely impacted the number of crimes that would have occurred early on. The drop in crime is correlated with the mobility of the population, so when restrictions were tighter there were fewer crimes reported, particularly property crimes (at homes, not businesses) and homicides. However, nationally, there was a spike in homicide rates in early summer, but it is unknown if that relates to the pandemic or other factors.

Additionally, while there was likely a decrease in the number of incidents there was also likely a decrease in reporting.

As we near the halfway mark of 2021, with vaccination rates increasing and restrictions loosening the question is whether crime rates increase from 2020 levels, remain the same or continue to decrease. As the pandemic continues to affect society, the changes in crime statistics helps us develop a deeper understanding of its affect on long-term crime rate trends.

Unemployment Rates Leveling Off, Consumer Consumption Increasing

In March of 2021 the unemployment rates for the State of Michigan and for the City of Detroit continued to a decline, which is a more recent trend. The State of Michigan reported an unemployment rate of 5.2 in March, which is the same at its February rate. However, since December of 2020 the State’s unemployment rate declined from 7.3 to 5.2.  For the City of Detroit, the unemployment rate for March of 2021 was 9.3, which is 0.3 points lower than the February unemployment rate and 11 points lower than the December 2020 rate. Both the Michigan and the Detroit rates were similar to the January 2020, pre-pandemic rates.

The chart above shows unemployment rates beginning to level off and the chart below reflects a similar message for some counties. Livingston, Macomb, Oakland and Wayne counties all reported higher unemployment rates in March of 2020 than March of 2021. In March of 2020 St. Clair County had the highest unemployment rate of 5.9, followed by Wayne County with an unemployment rate of 5.7.  Washtenaw County had the lowest unemployment rate in March 2020 at 2.7, but by March of 2021 that increased to 4.3. Washtenaw and Monroe counties were the only two in the region with higher unemployment rates in March of 2021 than March 2020. Both Monroe and Wayne counties had the highest unemployment rates in March of 2021 at 5.6. Livingston County had the lowest unemployment rate in March of 2021 at 3.2.

Just as the unemployment rate in the region is declining, so is the number of continued unemployment claims. These claims, also referred to as insured unemployment, are the number of people who have already filed an initial claim and who have experienced a week of unemployment and then filed a continued claim to claim benefits for that week of unemployment. Continued claims data are based on the week of unemployment, not the week when the initial claim was filed, according to the Southeastern Michigan Council of Governments.

The chart below shows a spike in April and May of 2020, when COVID restrictions tightened throughout the State. Since then though there has been a steady decline in the number of continued claims. The largest declines occurred between May and June of 2020 and September and November of 2020. Although there have been some increases in the number of continued unemployment claims since November of 2020, the April 10, 2021 number of 102,721 unemployed claims is the lowest number of claims in over a year.

Although unemployment numbers have been on the decline, there has been a recent increase in the number of small business closures, according to the Opportunity Insights Economic Tracker. This source uses credit card transaction data from 500,000 small businesses, Opportunity Insights estimates closures from the number of small businesses not having at least one transaction in the previous three days. The data cover many industries, including healthcare services, leisure and hospitality, and retail and transportation. The date source does says it has less coverage in manufacturing, construction, and finance.

According to the data, 31 percent of small businesses closed as of May 1, 2021. This number was an increase from the 26 percent of small business that were estimated to be closed on April 23, 2021. 

Since April of 2020 the percentage of small business closures has increased, but those numbers are not as high as when the pandemic began.

Below shows the consumption expenditures of goods in the U.S. between 2019 and 2021. According to the U.S. Bureau of Economic Analysis, durable goods have an average useful life of at least 3 years (e.g. motor vehicles) while nondurable goods have an average useful life of less than 3 years (e.g. food) and services are commodities that cannot be stored or inventoried and are consumed at the time of purchase (e.g., dining out). The chart below shows how consumption of services continues to remain steady, but not back to pre-COVID levels. On March 1, 2021 it was estimated that there was $8,182 billion in consumption of services, a slight increase from the month prior but below the January 1, 2020 levels.

The expenditures on durable and non-durable goods are now increasing above pre-COVID levels with the amount spent on durable goods being $2,314 billion as of March 1, 2021 and the amount spent on non-durable goods being $3,342 billion.

According to the Case-Shiller Home Price Index, the average price of single-family dwellings sold in Metro Detroit was $148,500 in February of 2021; this was $1,500 higher than the average family dwelling price in January. The February 2021 price was an increase of $14,070 from February of 2020 and $49,430 from February of 2014. Home prices have continued to increase year-after-year but the recent average price of single-family dwellings sold in the Metro-Detroit area has increased at a higher rate than in previous years.  

Boston Edison/Dexter Linwood Area of Detroit Has Highest Percentage of Children with Elevated Blood Lead Levels

In 2019, the Michigan Department of Health and Human Services (MDHHS) reported 1,299 children under 6 years old had Elevated Blood Lead Levels (EBLL) in the City of Detroit. The Detroit zip code with the highest percentage of children under the age of 6 with EBLL was 48206, which is located in the Boston Edison/Dexter Linwood area of the City. Here, 15.5 percent of tested children under the age of 6 had an EBLL. Overall, there were 8 zip codes in Detroit where 10 percent or more of tested children under the age of 6 had an EBLL. Furthermore, the number of children with EBLL is likely substantially under reported of the true number. This is because only a third of the eligible children are tested, so if all were tested, it is likely than many more would have an EBLL. In addition, testing has substantially decreased during the pandemic.

The 8 zip codes with EBLL above 10 percent in Detroit in 2019 were:

  • 48202 (10.6%)
  • 48203 (10.5%)
  • 48204 (13.1%)
  • 48206 (15.5%)
  • 48213 (14.4%)
  • 48214 (12.3%)
  • 48215 (10.4%)
  • 48238 (10.9%)

These neighborhoods are amongst the oldest residential neighborhoods in the Detroit-Metro area. And, with a few exceptions, the zip codes with high numbers of children with EBLL have high percentages of black residents. The first map below shows the zip codes in Detroit with the percentage of children under the age of 6 with EBLL; the second map shows the percentage of black residents in Detroit and Metro-Detroit. The overlap is apparent.

According to the Centers for Disease Control and Prevention (CDC), there is no safe level of lead, and even a small amount can cause irreversible damage. Yet, in Detroit several areas continue to be plagued with by lead exposure. There are several reasons behind this, many of which are impacted by income, poverty, access to safe and updated housing.

Lead paint was banned from use in 1978 yet there are more than 337,000 homes in Detroit built before 1980 (when lead paint came off the shelves), according to Census data. Additionally, income directly impacts what type of housing an individual and/or a family can afford. With a median income of $31,000 and 35 percent of families in the City living at or below the poverty level it is fair to suggest that many families are living in older, less expensive housing where hazardous issues are likely more prevalent, and these families cannot afford the $20,000 to $40,000 cost of abating the major lead hazards in the home. Lead paint is a top contributor to lead poisoning and without it being mitigated, lead poisoning will continue. Additionally, some children are lead poisoned through soil, spices, pottery and water. Also, leaded gasoline and demolitions have added lead dust to the soils in Detroit.

Children’s cognitive and physical health will continue to be impacted without mitigation of lead poisoning and its causes, specifically lead paint remaining in homes throughout the City. Children with EBLL can be impacted by the following side effects of the neurotoxin of lead:

 •Decreased Intelligence

•Decreased impulse control and thus increases reactivity

•Calcium deficiencies

•ADHD and Behavioral issues

•Osteoporosis

•Decreased school performance

•Permanent damage to kidneys and the heart

Concerns over lead poisoning and the resources needed to eliminate it have long been a topic of discussion, however without funding there can be no action. Funding needs to be direct and plentiful as well.  So a multi-faceted plan needs to provide regular lead testing, funding for lead abatement, and relocation means to get families out of homes that aren’t worth salvaging and into safer ones. Lead abatement and housing relocation programs exist, but the necessary funding to make a greater impact and create long-term sustainability clear has not been realized.

Long-term funding and policies to reduce and eventually eliminate lead poisoning should include:

•Universal blood lead testing for all children under 6 in each County in Southeast Michigan;

•A required Lead Investigation/Risk Assessment (LI/RA) for all homes at sale (for homes built before 1980) and required abatement of hazards, when they are found.

•A requirement for all landlords to complete a LI/RA and abate all hazards for homes older than 1980.

•An increase in the home abatements in Metro-Detroit by 400-500% annually.

•The financial and programmatic ability to support the relocation of several hundred households a year, where abatement is not available for their homes.

•A cleaning program for homes where children or pregnant women are living, and/or where a child has been identified with an EBLL or the home has lead paint hazards. This program would provide ongoing training and support to teach and incentivize families to super clean their homes until their home can be abated or until the family can relocate.

USPS Reports Decreased Vacancy Rates in Detroit

In December of 2020 the US Postal Service reported 74,313 total vacant properties in the City of Detroit, equivalent to a 19 percent vacancy rate. This rate is the lowest report rated since 2015, as can be seen in the first chart below. Additionally in 2020 the Postal Service reported 317,272 occupied addresses.

According to the first map below, while the overall vacancy rate in December of 2020 was 19 percent, there were several areas in the City with much higher rates. The highest rates stemmed off of I-96 and Gratiot Avenue in the City of Detroit, with the highest overall rate for a Census Tract being 52.3 percent in the Morningside/Chandler Park area. Conversely, vacancies remained the lowest in the Downtown Detroit area and Green Acres/Pembroke/Bagley areas. High vacancy rates in the City ranged from 31-52.3 percent and low vacancy rates ranged from 1.9 to 9.3 percent. Between September and December of 2020 the vacancy rate decreased by 0.3 percent. Additionally, the vacancy rate had an annual 2 percent decrease plus a 2.8 percent decrease over a five year time period. The second map below shows the long-term trends; all but seven Census Tracts experienced a decrease in vacancy or little to no change between 2019 and 2020. The Chandler Park area had the highest increase in vacancy rates between December 2019 and 2020 at 3.5 percent.

The USPS provides aggregate vacancy and no-stat counts of residential and business addresses that are collected by postal workers and submitted to on a quarterly basis the Department of Housing and Urban Development. While occupancy status is recorded, USPS does not capture any information about the nature of the vacancy or the address itself, other than whether it is a residential or business address. To the USPS, the address is either occupied and requires mail service or is vacant and does not. An address is deemed vacant if it did not collect mail for 90 days or longer. In addition to occupied and vacant addresses there are also “no stat” addresses. A “no stat” address is deemed that if it is under construction and not yet occupied or is in an urban area and identified by a carrier as not likely to be active for some time.

As noted, overall vacancy rates in the City of Detroit have been declining, and this also true at both the residential and business levels. Residential vacancy rates in September of 2015 were 22.6 percent, which was equivalent to 81,666 residential vacancies. By December of 2020 that number of vacancies decreased to 19.3 percent, or 67,442 total vacancies.

For business vacancies there was a total of  6,871 vacant businesses out of 28,438 total businesses in the City, this was equivalent to 24.2 percent. In September of 2015 the vacancy rate was 24.6 percent for a total of 7,337 vacant businesses out of 29,885.

Examining both charts below we see that there has been a steadier decline in residential vacancy rates than business vacancy rates. Between 2015 and 2019 business vacancies were actually climbing, and reached a high of 28 percent in December of 2018. Then, through the Pandemic declined substantially, though it is not clear why.

According to the USPS there was 27,878 “no stat” addresses reported in Detroit in December of 2020, an increase of 3,884 from the year prior.

Access to Michigan Child Care Needs Re-evaluation

Child care has long been a critical need for parents, and as the COVID-19 pandemic drags on that need continues to grow. When the virus first arrived in Michigan child care centers shutdown as many unknowns loomed. Over a year later, some centers have reopened, while others have not, and capacity has been reduced at many of them. Additionally, the work environment for many parents has shifted as well–essential workers are tasked to the brim, and those working from home have had to juggle a new reality of work and children in the same space in some cases. Not only has the child care landscape shifted in the COVID era, but its financial accessibility has long been an issue. This shift means decreased enrollment, leaving some providers to ask if they should close their doors. But, even more doors closing means the families that still need child care have fewer options, and likely even more expensive options, due to higher demand because of a tighter market. Since COVID first hit Michigan 5.8 percent of women in the workforce have left, many of whom have cited childcare as the reason. Costs are and accessibility are certainly behind that.

According to the Michigan League for Public Policy, the average cost of child care in the State of Michigan was $708 a month for infant care and $726 for toddler care in 2020. In Southeastern Michigan the cost of infant and child care was equal to or higher than the state average in five of the seven counties. In Oakland County, the cost was the highest for both types of care. The average cost of infant care in Oakland County was $929 and the average cost of toddler care was $894. Monroe County had the lowest average monthly cost of infant and toddler care, regionally, at $627 and $615, respectively.

There are some programs that provide financial assistance to families for child care, however, very few are eligible for such subsidies. According to the Michigan League of Public Policy, 5.3 percent of Michigan children 5 years of age or younger were approved for child care subsidies in 2020. In Southeastern Michigan, Wayne County had the highest percentage of children 5 years of age or under who were approved for subsidies at 8.3 percent. These subsidy percentages are among the lowest they have been in decades, according to the Michigan League of Public Policy. The percent of children receiving a child care subsidy has declined 65 percent over the past two decades.

Just as the cost of child care often makes it difficult for families to utilize the service, so does its accessibility. According to the Michigan League of Public Policy, St. Clair County had the highest percentage of open child care centers as of January 2021 at 71 percent, followed by Washtenaw County at 68 percent. Oakland County had the lowest percentage of open child care centers at 60 percent. Furthermore, areas with higher median incomes and housing values tend to have more child care centers, as residents of such areas tend to be able to afford child care more easily. The numbers in the chart above do not necessarily reflect the long-term data that shows areas of higher incomes have greater access to child care as many child care centers closed currently are based on personal business decision related to COVID. An item to consider on this as well are that areas such as Oakland County, where the median incomes tend to be high, have amongst the lowest percentage of open child care centers because they have more income to afford in-home care or for a parent to remain with the children at home, leaving less need for child care centers at this time.

Income clearly plays a role in a parent’s ability to utilize child care services. Although we noted that some subsidies are available, a higher percentage needs to be allocated, which means the state and federal government needs to allocate additional dollars. Also, Gov. Gretchen Whitmer recently launched the MI Tri-Share Child Care Pilot Program, which splits the cost of child care equally between the employee, the employer and the state. Those eligible to participate in the Tri-Share pilot must be employed by a participating employer, have an income above 150% of the Federal Poverty Line (FPL) and below 250% FPL, and not otherwise be eligible for the Child Development and Care Program. The three regional facilitator hubs chosen for the Tri-Share pilot are: Goodwill Industries of West Michigan, serving Muskegon County; Saginaw Intermediate School District, serving the Great Lakes Bay Region; and the United Way of Northwest Michigan, serving a five-county rural region in Northwest Lower Michigan. This program is a step in the right direction but additional actions need to be taken to ensure child care is affordable and accessible to all.