DTE Rates Continue to Increase in Michigan

The Michigan Public Service Commission (MPSC) did not grant DTE the rate hike it originally proposed late last year, but it did still grant the utility company a rate hike. 

In November of 2024 the MPSC approved a $113.8 million rate increase for DTE Gas, which was a 57 percent reduction from what the utility sought. In January of 2024 the company proposed increasing its rates by $266 million, but $106 million of that had previously been approved for infrastructure improvements. 

What does this increase mean for the average utility user? According to a November press release about the rate increase approval, a typical residential customer using 100 ccf (hundred cubic feet) of natural gas per month will see an increase of $1.98 on their monthly bill. In addition, due to the approved Infrastructure Recovery Mechanism (IRM) surcharge, customers experienced an increase of 66 cents, beginning Nov. 21, 2024. The IRM surcharge will increase annually until 2029, resulting in an additional increase of $6.28 by Jan. 1, 2029, over the initial rate and IRM approval. 

Prior to the 2024 increase, the MPSC approved a $368 million, or 6.4 percent, electricity rate increase in December of 2023. This increase translated to a $6.51 increase in the average monthly residential bill. This approval was also less than what the utility company had proposed; in February of 2023 DTE proposed a $622 million increase to its rates.

According to Michigan law, utility companies can only file for a rate increase once every 12 months. Once an application for such an increase is submitted it can take up to 10 months for the cases to be decided. As has been demonstrated with DTE’s rate increase requests over the years, the MPSC often only grants a portion of their total asks.

According to DTE, the proposed increases over the years are to cover a portion of inflation, needed infrastructure improvements to reduce outages and outage times and to continue investment in clean energy infrastructure. While these upgrades may be valid, public outcry wants to see DTE services improve without the utility company being approved for millions of dollars in rate hikes. 

According to a September 2024 MLive article, nearly 50 Michigan residents attended an MPSC meeting to express concerns about the proposed $266 million rate increase, citing long power and frequent outages and utility bill affordability as reasons why the utility company doesn’t deserve more money. State representatives, including State Rep. Kimberly Edwards and former State Rep. Jamie Churches also issued notice that they weren’t in support of the proposed increase, along with Congresswoman Rashida Tlaib and Attorney General Dana Nessel. Nessel said in her legal testimony, according to MLive, that DTE shouldn’t have received any more than a $139.5 million rate hike in 2024 and with that hike funds should be prioritized for “proven outage-reducing strategies like tree-trimming and away from more expensive capital and technological investments.”

These public concerns about DTE’s rate hikes came even before the MPSC released independent audit results on the operations of both DTE and Consumers energy; both of these companies combined provide electricity to more than 80 percent of the electric customers in Michigan. Highlights of the audit include the fact that DTE and Consumers Energy both have “worse than average” service interruptions, restoration delays, and tree trimming cycles compared to other utility companies. According to the audit, DTE and Consumers operations were compared to Commonwealth Edison, Ameren Illinois, and the Lansing Board of Water and Light.

In addition to finding that DTE and Consumers provide “worse than average” services, the audit also found:

  • The average time it took for both utility companies to restore power to their 1.4 million customers outside of major weather events was worse than average among other utility companies in 2022 and 2023;
  • More than 13 percent of DTE Electric customers experienced four or more outages and 45 percent of customers experienced outages that lasted eight hours or more in 2023;
  • More than 10 percent of Consumers Energy customers experienced four or more outages and over 25 percent of them had outages that lasted at least eight hours in 2023; 
  • Both companies have outdated infrastructure, which could be the cause for the long-lasting interruptions. 

While the audit highlights the less than average performance of DTE and Consumers, a 2024 report from the Citizens Utility Board highlights how Michigan overall ranked 43rd of the 50 US states, plus Puerto Rico and Washington DC, for having the overall longest average number of minutes of outage per customer, with major event days included. Michigan also ranked 42nd in the overall number of outage minutes per customer, with major event days excluded.

The chart above shows the average number of outage minutes for Michigan’s utility companies, either when there were no major weather events or including such events. Major weather events do have a larger impact on the duration of outages, as is shown above. Again, while data has shown that DTE and Consumers have below average performances, the chart above shows that Upper Michigan Energy Resources and Upper Peninsula Power both had longer outage times without major event days than DTE and Consumers did. With major events, Upper Michigan Energy Resources, Upper Peninsula Power, Indiana Michigan Power and Northern States Power all had longer average outage times. These companies are also smaller than DTE and Consumers. 

As the cost of energy continues to rise in Michigan, beyond, we will take a look at how Michigan residents receive their energy and where Michigan draws its energy from in a future post.

Do Leaking Underground Storage Tanks Play a Part in why Detroit has the Worst Preterm Birth Rate Among Major U.S. Cities?

According to the 2024 March of Dimes Report Card for Michigan, the preterm birth rate for the State of Michigan improved between 2022 and 2023 but worsened in the City of Detroit and Macomb, Washtenaw and Wayne counties. “Preterm birth” refers to infants who are born prior to 37 weeks of gestation. As shown in the image below, Detroit received an F grade and had the worst rate of the 100 U.S. cities with the most live births at 15.6 percent in 2023.

Earlier data provided by the Michigan Department of Health and Human Services through 2021, also shows that preterm births for Detroit and Macomb, Washtenaw and Wayne counties has been increasing in recent years. However, since 2000, the percent of preterm births in five of the counties in the region has increased. This earlier data shows that preterm births in Detroit were recorded at 12.9 percent in 2021. Detroit has consistently had the highest percentage of preterm births in the region, and the state.  And, as noted above, Detroit had the worst preterm rate of the 100 U.S. cities with the most live births at 15.6 percent in 2023.

  Oakland and Wayne (excluding Detroit) counties also experienced slight decreases in the percentage of preterm births between 2000 and 2021. 

Among birthing people, the most common factors associated with preterm births are smoking, hypertension, diabetes and an unhealthy weight. Environmental pollution resulting in poor air quality, climate change impacts such as extreme heat, and exposure to contaminants in drinking water have also been linked to increased preterm births. Leaking underground storage tanks (USTs), introduced in a previous post, can be a significant source for pollutants such as volatile organic compounds (VOCs) spreading through the soil and impacting drinking water sources.   

Researchers affiliated with the WSU Center for Leadership in Environmental Awareness (CLEAR) are studying the impacts of VOCs on preterm birth, testing the hypothesis that VOCs traveling through the soil may be related to VOC levels in homes. The CLEAR project teams are investigating the levels of VOC contamination in the air in homes, in plants and their water sources and in the soil, establishing innovative monitoring and remediation strategies, modeling the effects of VOC exposure on zebrafish and placental mammals to unveil ways to reduce preterm births in humans, and measuring the association of VOCs with preterm births in the human population in Detroit. 

The map below presents preliminary evidence of VOCs, in particular, benzene in homes in Detroit, based on testing by CLEAR. Benzene is a colorless chemical that is often a liquid or, at room temperature, a gas. It smells sweet, but it can be a human carcinogen when people are exposed over the long-term. Over the short term it can cause nausea, dizziness and headaches. It is also one of the chemicals that CLEAR is assessing relative to preterm births. Benzene, as a vapor, can intrude into homes from underground. Smoking can also produce benzene in a home. 

Another research team at WSU) is currently investigating the possible indirect link between exposure to PFAS, resulting bacterial infections, and preterm birth. According to a synopsis of the Wayne State University PFAS-Pre-term Birth Study, the forthcoming research will focus on the “placenta as a major target of PFAS toxicity.” The placenta is a maternal organ that provides nutrients from the mother’s blood and passes them to the baby’s blood through the umbilical cord. The Wayne State Study will examine different regions of the placenta to see which cell types are affected by the PFAS. 

Due in part to this research, the risks associated with human exposure to VOCs and PFAS contamination have been made more public in recent years. However, many remain unaware of the potential hazards posed by leaking underground storage tanks (USTs) on water quality, and thus on human health (Marcus, 2021)

According to a 2021 study conducted by Vanderbilt University professor Michelle Marcus focused on sites in Pennsylvania, Florida, and New Jersey, exposure to a leaking UST while pregnant increased the probability of preterm births by between 7 and 8 percent. Marcus also found that the probability of exposure dropped by 16.5 percent after the Environmental Protection Agency (EPA) developed regulations mandating that owners of USTs protect against spills, overfilling, and corrosion.

Both individual and environmental factors associated with preterm births are likely more severe for those with greater levels of social vulnerability. Communities at or above the 90th percentile for density of active USTs and releases are considered “disadvantaged,” according to the federal government’s Climate and Economic Justice Screening Tool. The Southeast Michigan Council of Governments (SEMCOG) provides an interactive map of these areas, which are concentrated primarily in Detroit and other urbanized census tracts in the metropolitan area.

Continued study is needed to determine just how much of a factor leaking USTs might play in Detroit’s high preterm birth rate. Going forward, this will first require that leaks and releases be identified in the most vulnerable census tracts and that this information be disseminated to nearby residents. Marcus (2021) found in her study that birthing people living closest to USTs were more likely to be younger, non-white, and less educated. The EPA has developed guidelines for states on how to tailor engagement with residents about leaking USTs, but local governments with closer ties to neighborhoods should also communicate about the risks of exposure.

Academic References

Marcus, M. (2021). Going beneath the surface: Petroleum pollution, regulation, and health. American Economic Journal: Applied Economics, 13 (1), 1–37. https://doi.org/10.1257/app.20190130 

Southeastern Michigan’s Economy Shows Signs of Slowing Down, as does Inflation

Michigan’s unemployment rate has been slowly increasing over the last few months, a trend which the City of Detroit is also experiencing but at a more increased rate. According to Michigan Department of Technology, Management and Budget, Michigan’s unemployment rate was reported at 4.5 percent in September of 2024. This unemployment rate has gradually increased for 3.9 percent since May of 2024. 

In Detroit, the September 2024 unemployment rate was reported at 8.9 percent. This was a decrease from the 13.9 percent unemployment rate spike in July of 2024, however, in April of 2024 the unemployment rate for Detroit was 7.4 percent and it has continued to increase since then. 


According to a recent Detroit Free Press article, there are several reasons for the increased jobless rates, including inflation, lack of interested people to fill open positions and the fact that some major Michigan employers have been cutting back on positions. For example, last week General Motors announced about 1,000 layoffs and since August Stellantis has cut about 2,850 positions. There are fields that are growing though. The construction industry in Michigan has experienced about an 8 percent increase in jobs and there has been about a 3 percent increase in government jobs.

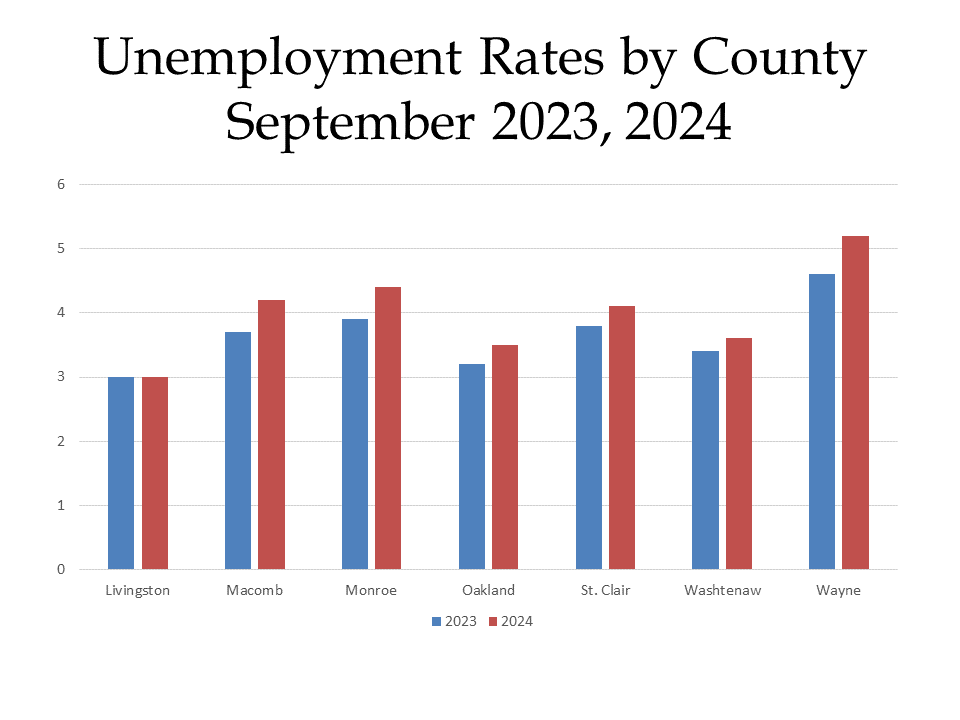
When comparing the unemployment rates of the seven counties in Southeastern Michigan between September of 2023 and September of 2024 the data shows that unemployment rates have increased for almost all counties over the last year. Livingston County was the only county where the unemployment rate remain unchanged; the reported unemployment rate was 3 percent. Wayne County not only had the highest unemployment rate in September of 2024 at 5.6 percent but it also had the largest increased from the year prior. Between September of 2023 and September of 2024 Wayne County’s unemployment rate increased 1.6 percent.

When comparing the unemployment rates of the seven counties in Southeastern Michigan between September of 2023 and September of 2024 the data shows that unemployment rates have increased for almost all counties over the last year. Livingston County was the only county where the unemployment rate remain unchanged; the reported unemployment rate was 3 percent. Wayne County not only had the highest unemployment rate in September of 2024 at 5.6 percent but it also had the largest increased from the year prior. Between September of 2023 and September of 2024 Wayne County’s unemployment rate increased 1.6 percent.

The charts below show the percent changes in the Consumer Price Index (CPI) on a month-to-month basis and a year-to-year basis for each month in years 2019, 2020, 2021, 2022, 2023 and 2024 in the Midwest Region. The CPI is a measure that examines the weighted average of prices of consumer goods and services, such as transportation, food, energy, housing and medical care. It is calculated by taking price changes for each item in the predetermined group of goods and averaging them.

The first  chart below highlights how the CPI changed on a month-to-month basis between 2019 and 2024. Currently in 2024, the region’s prices were up 0.2 percent in the month of August. The highlights for the change include:

  • Overall food prices increased by 0.4 percent, but the price of meat, fish, poultry and eggs increased 1 percent and the price of fruits and vegetables increased by 1.1 percent
  • The energy index decreased by 2.4 percent.
  • The cost of transportation decreased by 0.7 percent, and the cost of motor fuel decreased by 5.5 percent. 

When examining the second chart, which shows how prices changed on a year-to-year basis,  we see how prices remain lower than this point in time in 2021, 2022 and 2023.

In September of 2024 the CPI was reported to be 2.5 percent above what it was the year prior. Contributing factors to the continued increase in the CPI include:

  • Food and beverage prices increasing 2.4 percent over the last year, with away from home food prices increasing 3.9 percent and food at home increasing 1.3 percent.
  • Housing increasing 4.9 percent, with rent increasing 4.9 percent and the equivalent of rent increasing 5.2 percent.
  • The cost of transportation decreased by 1.1 percent, with motor fuel decreasing 15.5 percent and motor vehicle insurance increasing 16. percent. 

 Home prices in Metro-Detroit for 2024 are again higher than in years’ past, with gradual increases occurring from month-to-month. In August of 2024, the average price of a single-family dwelling sold was $188,7600, according to the Case Shiller Index. In July of 2024, the average price of single-family dwellings sold was $188,000, which is $760 a difference from the month prior. While there was an increase, it is much lower than what we have seen in months’ and years’ past. However, the year-to-year comparison does show home prices continue to increase at high rates.

 Between August of 2024 and 2023 the average price of a single-family dwelling increased $10,570; between August of 2024 and 2022 the price increased $17,350, between August of 2024 and 2020 the average price has increased $54,640 and between August of 2024 and 2014 the average price has increased $90,040.

Building permits reached an annual peak in June of 2024 and then decreased for the remainder of the summer. The number of single-family dwelling building permits pulled in August of 2024 was 277. The last time fewer single-family dwelling permits were pulled was in January of 2023; 187 were pulled at that time. Despite the fewer number of building permits pulled, there was a call from the Governor to earlier this year to build more. 

Underground Storage Tanks in Metro-Detroit, and Beyond, Pose Environmental Problems

On Feb. 21, 2022, anglers on the Huron River in downtown Flat Rock, Michigan, noticed an oily sheen on the surface of the water near Flat Rock Metal, a steel processing company. Following investigation by the emergency response branch of the Environmental Protection Agency (EPA), the source was determined to be a leaking 10,000-gallon underground storage tank located underneath Flat Rock Metal’s headquarters. The building was originally constructed by Henry Ford approximately 100 years prior and originally operated as the Ford Motor Company Lamp Factory. Flat Rock Metal purchased the building from Ford in the 1980s, and neither the owners nor the State of Michigan claim to have known about the tank until this incident occurred (Dickson, 2022; Ellison, 2022; House, 2022).

Underground storage tanks (USTs) are tanks with associated pipe systems that contain at least 10 percent of their volume underground. USTs that contain petroleum or other hazardous substances, such as those found at gas stations, industrial plants, and municipal facilities, are regulated at both the federal and state level; these are also referred to as non-residential USTs. Smaller USTs frequently found at older residential properties and farmsteads that would have been originally used to store heating oil are not covered by these same rules.

The primary source of regulation for non-residential USTs nationally is the Energy Policy Act of 2005, which requires owners to inspect USTs every three years and retain records of doing so (EPA, 2024a). In Michigan, Part 201 of the Natural Resources and Environmental Protection Act of 1994 (NREPA) revolves around remediation for any environmental contamination. Part 213 of this same act focuses specifically on leaking USTs, mandating that owners/operators perform corrective actions such as assessment, cleanup, removal, and monitoring, among others. The following maps show facilities in violation of Part 201 or Part 213 in the City of Detroit and in Macomb and Oakland counties.

The map above shows that there are 2,323 Detroit USTs in violation of the regulations mentioned above. The highest concentration of these UST sites is along Detroit’s riverfront, where many industrial sites are located. The map of Oakland and Macomb counties below shows that the concentration of USTs tends to be along major travel corridors (Gratiot Avenue, Van Dyke, I-275 and 8 Mile Road) and in the area surrounding the City of Pontiac).

As of 2024, Michigan remains one of only 10 U.S. states without an approved UST program, alongside the other Great Lakes states of Wisconsin, Illinois, Ohio, and New York. According to the EPA, to receive program approval, states must establish standards for program criteria that are not less restrictive than federal standards, provide for enforcement of regulations, and, at a minimum, regulate the same USTs are also regulated by the federal government (EPA, 2024b). In Michigan, USTs are regulated by two different State departments. The Department of Energy, Great Lakes, and the Environment (EGLE) transferred much of the oversight of USTs and aboveground storage tanks (ASTs) to the Department of Licensing and Regulatory Affairs (LARA) in 2012. The Remediation and Redevelopment Division of EGLE still reviews assessment and closure reports following the detection of a release from a UST (EGLE, n.d.).

The most common reasons for leaking USTs are corrosion and faulty installation of the tanks and/or associated piping. While more modern USTs are usually constructed using double-walled fiberglass, many of the decades-old USTs were constructed out of bare steel, which, over time, breaks down to soft ore. The rate at which this happens depends on soil characteristics, groundwater chemistry, and weather (Wang et al., 2009). According to the EPA’s UST mapping tool, the UST Finder, 405 USTs in the City of Detroit are currently in use with “active” status, and 899 are currently in use with “active – expired” status (meaning their permit is expired but they remain in use). Of the total active/active-expired facilities, nearly 11 percent are identified as having asphalt-coated or bare steel construction (EPA, 2024c). 

Drinking water in the City of Detroit and the inner ring suburbs is drawn primarily from surface water in the Detroit River (Great Lakes Water Authority, n.d.). While the immediate threat of leaking USTs is to groundwater, contaminants will eventually discharge back into the nearest stream or water body as part of the hydrologic cycle (U.S. Geological Survey, 2019). However, a number of the USTs with recorded releases in the metropolitan area outside of Detroit are located within groundwater wellhead protection areas (EPA, 2024c; EGLE, 2024), further highlighting the need for regulation, and removal, of USTs.  

The overall best solution to leaking USTs is the systematic removal of them and remediation of the surrounding areas where they were installed. Professionals from variety of disciplines will be needed to effectively implement this solution, including geologists, environmental engineers, public health officials, planners, and communication professionals. Currently, many removal and remediation projects are initiated only after a release from a leaking UST. Recently, EGLE’s Remediation and Redevelopment Division launched the Remediation Information Data Exchange (RIDE), which allows the public to view information about contaminated facilities. However, the State of Michigan and the EPA regional office must actively work together to develop an approved program that meets the federal agency’s requirements. At the same time, a more active program removal of leaking tanks should be undertaken by the State and local governments along with a steady pace of legal action to force owners or former owners to clean up their mess.

References

Department of Energy, Great Lakes, and Environment (EGLE). (n.d.). Leaking Underground Storage Tanks Program. https://www.michigan.gov/egle/about/organization/Remediation-and-Redevelopment/lust 

Department of Energy, Great Lakes, and Environment (EGLE). (2024, April 16). Wellhead Protection Areas. https://gis-egle.hub.arcgis.com/datasets/wellhead-protection-areas-whpa/explore?location=42.623196%2C-83.298896%2C12.99

Dickson, J. D. (2022, March 4). Underground storage tank believed culprit in Flat Rock spill. The Detroit News. https://www.detroitnews.com/story/news/local/wayne-county/2022/03/04/flat-rock-chemical-spill-huron-river-likely-underground-storage-tank/9374643002/ 

Ellison, G. (2022, March 4). Century-old buried storage tank the culprit in Huron River oil leak. MLive. https://www.mlive.com/public-interest/2022/03/century-old-buried-storage-tank-the-culprit-in-huron-river-oil-leak.html 

Environmental Protection Agency (EPA). (2024a, January 12). Inspecting underground storage tanks: 2005 Energy Policy Act. https://www.epa.gov/ust/inspecting-underground-storage-tanks-2005-energy-policy-act 

Environmental Protection Agency (EPA). (2024b, July 15). State underground storage tank programs. https://www.epa.gov/ust/state-underground-storage-tank-ust-programs#how  

Environmental Protection Agency (EPA). (2024c, February 23). UST Finder. https://www.epa.gov/ust/ust-finder 

Great Lakes Water Authority. (n.d.). Our Water System. https://www.glwater.org/our-system/water-system/

House, K. (2022, March 2). Flat Rock’s second chemical spill points to hazards of underground tanks. Bridge Michigan. https://www.bridgemi.com/michigan-environment-watch/flat-rocks-second-chemical-spill-points-hazards-underground-tanks 

U.S. Geological Survey. (2019, March 2). Groundwater/Surface Water Interaction. https://www.usgs.gov/mission-areas/water-resources/science/groundwatersurface-water-interaction#:~:text=Surface%20water%20seeps%20into%20the,and%20groundwater%20quality%20and%20quantity. 

Wang, L. K., Shammas, N. K., Wang, P., & Clesceri, N. L. (Eds). (2009). Remediation of sites contaminated by underground storage tank releases. Handbook of advanced industrial and hazardous wastes treatment (pp. 687-758). Taylor & Francis Group.

Education on the November ballot in Detroit and beyond

While there are no statewide proposals on the November ballot this year, Detroit residents will be asked to weigh in on two education-related measures.

Following years of financial crises at Detroit Public Schools (DPS), that entity now exists only to collect property taxes and pay down its legacy debt. As a replacement the Detroit Public Schools Community District (DPSCD) oversees and operates public education in the city. DPSCD funding is on the ballot as Proposal S (on the ballot, the full title is “School District of The City of Detroit Proposal S: Operating Millage Restoration”). This proposal asks voters to restore the millage rate that non-homestead, commercial property owners pay by increasing it 6 mills, or $6 for every $1,000 of a property’s taxable value. According to DPSCD officials, the revenue earned from this millage restoration would help DPS pay off its debt. If this happens, DPSCD would be able to use future-generated property tax revenue to fund other DPSCD needs. DPSCD is holding virtual information sessions for those with questions about Proposal S on Wednesday, Oct. 30 and Monday, Nov. 4. Voters are also being asked to choose three DPSCD Board members in the nonpartisan section of the ballot.

The other proposal on the ballot in Detroit is to support the Wayne County Regional Educational Service Agency (Wayne RESA). The Wayne RESA is an intermediate school district that helps to support the 33 local school districts and 97 charter schools (also known as public school academies) across Wayne County, including DPSCD. Detroiters and other Wayne County residents will be asked to vote on the Wayne RESA “Renewal of Regional Enhancement Millage Proposal,” which seeks to renew a property tax millage of 1.98 on all property, equating to $1.98 for every $1,000 of taxable value. According to the proposal language,  if passed, this revenue will be distributed across the Wayne RESA service area on an “equal per pupil basis” for six years, beginning in 2028. Voters originally approved the Wayne RESA millage in 2016 and supported its renewal in 2020. 

Other communities across southeast Michigan also being asked to vote on school district operating millages and bond proposals for infrastructure improvements include: 

  • Livingston County: Livingston Educational Service Agency (Livingston ESA)
  • Macomb County: L’Anse Creuse Public Schools, Memphis Community Schools, South Lake Schools, Van Dyke Public Schools, Warren Consolidated Schools
  • Oakland County: Almont Community Schools, Clarkston Community Schools, Farmington Public Schools, Madison District Public Schools, Troy School District, Walled Lake Consolidated Schools
  • St. Clair County: East China School District, Marysville Public Schools
  • Wayne County: Airport Community Schools (also in Monroe County), Gibraltar School District (2), Flat Rock Community Schools (also in Monroe County), Wayne-Westland Community Schools
  • Washtenaw County: Milan Area Schools (also in Monroe County), Lincoln Consolidated School District (also in Wayne County), Washtenaw Intermediate School District (WISD), Whitmore Lake Public Schools

According to a recent analysis by Bridge Michigan and Gongwer News Service-Michigan, support for school bond proposals across the state has been decreasing in both Democratic-leaning and Republican-leaning districts for the past several years. 

Thirty-Five Southeastern Michigan Communities Identified as Disadvantaged Due to Environmental Burdens

There are 35 communities in Southeastern Michigan described as Justice40 communities by local, state and federal government agencies because they have Census tracts that face underinvestment and have higher rates of pollutants than their neighboring communities.  Throughout the United States there are  27,251 Census tracts that are identified as disadvantaged by the Climate and Economic Justice Screening Tool (.gov) (CEJST). CEJST identifies census tracts as disadvantaged if they meet the threshold for environmental and/or climate burdens, along with an associated socio-economic burden.

With communities across the nation facing such disadvantages, President Joe Biden signed several Executive Orders into law that focus on helping such disadvantaged areas tackling climate change and addressing environmental injustices through dedicated funding and priorities.

The Justice 40 initiative sets a goal for federal and state investment in pollution remediation and reduction, climate change mitigation, and sustainability while ensuring that 40 percent of related federal investments reach disadvantaged communities, including to the 35 Justice40 communities in Southeastern Michigan. These 35 communities with identified disadvantaged Census tracts are: 

As noted, the CJEST tool helps to identify which Census tracts, and communities, that are deemed disadvantaged because they meet the threshold for environmental and/or climate burdens, along with an associated socio-economic burden.These burdens, and the criteria that helps determine if a community/Census tract are disadvantaged are described below, per the CEJST.

Climate change: at or above the 90th percentile for expected agriculture loss rate OR expected building loss rate OR expected population loss rate OR projected flood risk OR projected wildfire risk;

Energy: at or above the 90th percentile for energy cost OR PM2.5 in the air;

Health: at or above the 90th percentile for asthma OR diabetes OR heart disease OR low life expectancy;

Housing: Experienced historic underinvestment OR are at or above the 90th percentile for housing cost OR lack of green space OR lack of indoor plumbing OR lead paint;

Legacy pollution: have at least one abandoned mine land OR Formerly Used Defense Sites OR are at or above the 90th percentile for proximity to hazardous waste facilities OR proximity to Superfund sites (National Priorities List (NPL)) OR proximity to Risk Management Plan (RMP) facilities;

Transportation: at or above the 90th percentile for diesel particulate matter exposure OR transportation barriers OR traffic proximity and volume;

Water and wastewater: at or above the 90th percentile for underground storage tanks and releases OR wastewater discharge;

Workforce development: at or above the 90th percentile for linguistic isolation OR low median income OR poverty OR unemployment and have more than 10 percent of people ages 25 years or older whose high school education is less than a high school diploma.

Additionally, all categories (except workforce development) include the criteria that the Census tract is at or above the 65th percentile for low income.

The map below is a screenshot from the Equity Emphasis Tool created by the Southeastern Michigan Council of Governments, which shows communities/Census tracts that meet the threshold for environmental and/or climate burdens, per the CEJST. The map also highlights the equity, and inequity, of the region based on criteria such as income, race, sex, disability, education, access to transportation and age.The areas highlighted in blue are the census tracts deemed as disadvantaged because they meet the threshold for environmental and/or climate burdens, along with an associated socio-economic burden.


The first map above does show that the number of areas deemed disadvantaged by the CEJST map expands beyond the areas with high Equity Emphasis index scores. This is likely because the Equity Emphasis index scores are based on socioeconomic data while the CEJST designations also look at environmental factors, such as potential flood and wildfire risks of an area and proximity to underground storage tanks.

Detroit, its inner-ring suburbs and the City of Pontiac are highlighted in both the CEJST and Equity Emphasis maps, again highlighting how socioeconomic data impacts policy decisions, or lack thereof, related to the environment.

While the data above highlights where the focus areas of the Justice40 Initiative are, it is also important to understand what type of investments will be made in these areas.

The categories of investment are: climate change, clean energy and energy efficiency, clean transit, affordable and sustainable housing, training and workforce development, remediation and reduction of legacy pollution, and the development of critical clean water and wastewater infrastructure.

Moving forward we will carefully dig into the specifics of what criteria have made some Southeastern Michigan’s communities Justice40 Communities, and what funding they are receiving to mitigate future social, economic and environmental injustices.

Crime In Detroit is Declining, Again

Crime in Detroit is declining again. Nearly all major categories of crime decreased in the first six months of this year. Murder, sexual assault and robberies, were all down — by double digits year to date. Among violent crime, only simple assault increased. Aggravated assault is down recently, but not below pre-Covid levels.

Among property crimes, damage to property dropped by double digits, while burglary and larceny fell by single digits so far this year. Auto theft peaked in late 2022, but has come down since then, though police are challenged by new technological techniques that thieves are using.

These declines are good news for Detroit, helping to overcome a bad reputation that has held Detroit back for decades.

Note, though, the “again.”

Detroit, like many major cities, had seen massive declines in crime over recent decades until these were halted by the COVID-19 pandemic and its aftermath. Covid reversed the decreases for several years, but then crime levels headed back down. FBI data on crime levels lags somewhat, but it confirms a temporary COVID increase that has been replaced by a post-COVID decrease in crime rates in Detroit.

The FBI data also suggests one cause for decrease, an increase in clearance rates (i.e., the extent to which a perpetrator is caught). This is one several causes of the drop in crime. The clearance rate increase indicates that the police are getting better at their jobs.

They don’t catch every perpetrator, but they are catching about double the number they were—a huge improvement. This, in turn, points to other things Detroit’s police are doing well. These include:

Targeting high crime areas. For over a decade now they have been identifying hot spots for crime and completing proactive patrols in those areas, providing more protection for citizens and increasing the risk for criminals who might be planning a crime. The criminals often decide that the crime is too risky, and those decisions lead to reduced crime rates.


Using technology and working with community organizations to reduce violence. The city has experimented with using cameras at gas stations and other locations, and it has used a gunshot detection system to identify where guns are fired in the city so they can target crimes as they occur. At the same time they have engaged residents in some neighborhoods to identify and engage people at the greatest risk of violence, who are then helped to pursue a different path.


Tracking down repeat offenders. Criminals on parole or probation, who commit additional crimes, now are far more likely to find themselves back in police custody. Partly this because of increasing close cooperation between police and corrections officers. Higher quality data tracking of the probationers and parolees and their crimes accelerates this process.


Sustained partnerships with federal, state and local agencies that include aggressive investigation and prosecution of the relatively small number of individuals responsible for the most violence in the community.


One important reason that crime is falling in Detroit is beyond the control of the police. This is a reduction in the number and percentage of youth in the city. The 2010 Census and the 2022 American Community Survey document a decline in the number of children in Detroit and a stronger decline in youth 15 to 24. This is the cohort that has historically had the most difficulty getting jobs and who have long been represented disproportionately in crimes. These trends are projected to continue with Detroit’s population gradually getting older with fewer and fewer youth.

A final question: Are Detroiters recognizing these changes? Two surveys by the University of Michigan indicate that Detroiters are seeing the declines that the crime statistics show. Comparing 2019 data to 2021 data the UM data indicates that fewer Detroiters were victims of crime in each category from auto theft to physical attacks. A majority or nearly a majority said police were doing a good job in 2018, 2020 and 2021.

Not all were so positive. Younger people, in particular, were far less likely to believe that the police were doing a good job. The data indicate young people are more likely to have had “forceful” interactions with the police.

Overall, Detroit police are now more representative of the people they police. They are better trained. They use more technology. Many are good at engaging with the community. They have fewer youth to police. The economy has been good, reducing the negative impact of unemployment on crime. All these trends are converging to reduce crime levels. It’s time to applaud the progress and find ever more new and inventive ways to continue the positive trends in the city.

This piece can also be found in Crain’s Detroit here, as an Op-Ed written by Lyke Thompson.

Metro-Detroit CPI Rises and New Builds Decline

Michigan’s unemployment rate continues to remain stable and below 5 percent, a trend that has occurred since June of 2022. In January of 2024, the State of Michigan’s unemployment rate was 4 percent. While this a good sign, Michigan Labor Market Information Director Wayne Rourke was recently quoted in a Michigan Public Radio article saying that the job market in Michigan is beginning to cool off. He did add though that the job market is still good.

In Detroit, the 2023-2028 Economic Outlook produced as part of the City of Detroit-University Economic Analysis Partnership between U of M, the City of Detroit, Michigan State University and Wayne State University, shows even more optimism. According to report, payroll jobs are expected to increase by 3,000 in 2023 and by 8,900 from now until 2028. Such growth will is expected to decrease Detroit’s unemployment rate to 7.2 percent in 2028. Detroit’s unemployment rate was 8.2 percent in January of 2024, which was a slight increase from where it was in November and December of 2023.

When comparing the unemployment rates of the seven counties in Southeastern Michigan between January of 2023 and January of 2024 we again see signs of economic optimism, with unemployment rates being down or remaining stable for all seven counties. Monroe County had the largest decrease in its unemployment rate between January 2023 and January 2024 at 0.7 percent; it also had the highest unemployment rate in January of 2023 at 4.9 percent. In January of 2024, Wayne County had the highest unemployment rate at 4.7 percent, which is what it was the year before too. Washtenaw County had the lowest unemployment at 2.9 percent in January of 2024.

The charts below show the percent changes in the Consumer Price Index (CPI) on a month-to-month basis and a year-to-year basis for each month in years 2019, 2020, 2021, 2022, 2023 and 2024 in the Midwest Region. The CPI is a measure that examines the weighted average of prices of consumer goods and services, such as transportation, food, energy, housing and medical care. It is calculated by taking price changes for each item in the predetermined group of goods and averaging them.

The first  chart below highlights how the CPI changed on a month-to-month basis between 2019 and 2024. Currently in 2024, the region’s prices were up 0.6 percent in the month of February. The highlights for the change include:

•Overall food prices remained unchanged, but the price of meat, fish, poultry and eggs increase 0.5 percent.

•The energy index increased by 4 percent over the month, due almost entirely to an increased price in gasoline (8 percent). There was a 1.5 percent increase in natural gas services too though.

•Rent (+0.4 percent) and apparel (+ 3.1 percent) also contributed to the increase in the month-to-month CPI increase. This increase was slightly offset by the 0.9 percent decrease in medical care services though.

When examining the second chart, which shows how prices changed on a year-to-year basis,  we see how the CPI advanced by 2.8 percent from the last year.

In January of 2024 the CPI was reported to be 2.8 percent above what it was the year prior, meaning consumer prices continue to rise. Contributing factors to the continued increase in the CPI include

•Food prices increasing 2.2 percent over the last year, with “away from home” food prices increasing 3.9 percent

•The cost of electricity decreased by 5.1 percent, with the 11.3 percent decline in the price of natural gas slightly offsetting the 4.5 percent increase in prices paid for electricity.

•Owners’ equivalent rent of residences increasing 6.5 percent and rent of primary residence increasing 6.3 percent.

Home prices in Metro-Detroit for 2023 again set a record. In December of 2023, the average price of a single-family dwelling sold in December of 2023 was $182,890, according to the Case Shiller Index. In January of 2023, the average price of single-family dwellings sold was $168,300, which is a $14,590 difference from what the average prices were at the end of the year. While average home prices during the first six months of 2023 remained on par with what they were in 2022, the data shows that price began to increase again in latter part of the year.

Between December of 2023 and 2022 the average price of a single-family dwelling increased $13,400; between December of 2023 and 2020 the price increased $41,230 and between December of 2023 and 2014 the average price has increased $85,900.

With the cost of home prices increasing, it also appears the number of building permits being pulled in Southeast Michigan have been declining overall since 2021. The number of single-family dwelling building permits pulled in March of 2021 was the peak between then and now. At that time, 618 single-family dwelling building permits were pulled. The highest number of single-family dwelling building permits pulled in 2023 was 494 (March, 2023). While Michigan Gov. Gretchen Whitmer said in her 2024 State of the State address that we need more housing to decrease the cost to purchase/rent a home, building is actually declining.

According to a February 2024 Detroit Free Press article, some reasons for the decline in building new single-family dwelling units are the cost to build, modest statewide population growth and a shortage of skilled trade workers. Also, increased costs to build a home means those homes cost more to purchase, which is also proving to be difficult in today’s economy.

Cost of Water Continues to Rise in Southeast Michigan, Ratepayers Foot the Bill

Water rates have grown for most ratepayers across Southeastern Michigan for years, whether it be from the increases passed down to wholesale customers by the Great Lakes Water Authority and/or the increases passed down from the municipalities to their citizens. These increases, in short, are based on the servicing of debt and the cost of delivering clean and safe drinking to residents across the region. As Michigan’s infrastructure continues to age, ratepayers and government entities will have to foot the bill to ensure that the necessary replacement and improvements continue.

In Southeastern Michigan there are 86 communities that are part of the Great Lakes Water Authority (GLWA) system. This system officially went online in 2016 after approval by Wayne, Oakland and Macomb counties in 2014 with the promise to provide improved services to the former Detroit Water and Sewer Department (DWSD) customers. The approval of the GLWA meant that all former DWSD wholesale customers (who are local government entities) became customers of the GLWA. The exception was the City of Detroit, which continued to own and operate its own system.  At the time of the creation of this regional authority there was a promise that annual overall budget increases would be 4 percent or less. As the GLWA passes on more water and sewer (we are not exploring sewer system charges in this post) increases for one local city or townships could go above 4 percent. However, according to the annual budgets produced by the GLWA, water system increases for suburban wholesale customers have not exceeded 4 percent, except in Fiscal Year 2017.

As the chart below shows, Fiscal Year 2017 had an overall increase of 4.3 percent.  Fiscal Year 2018 had an increase of 2 percent. Fiscal Year 2019 had the lowest increase for water charges for suburban wholesale member partners at 1.7 percent. For Fiscal Year 2024 the increase is 2.75 percent.

These percentage increases are passed down to the communities who purchase wholesale water from the GLWA, but water rate increases for these communities’ ratepayers are not always in line with the increases passed down by the GLWA. Rather, municipalities typically add their own operating costs on top of GLWA’s charges, according to the GLWA’s explanation of charges. These rates are known as the retail rates and are ultimately what customers pay.

At the same time, the GLWA may pass down standard rate increases to their wholesale customers  as costs per million cubic feet (mcf) based on who the customer is. These rates vary according to whether the wholesale customer has the ability to store water, how many ratepayers there are in a community  and the distance and elevation of the community from where the water is being transported from. There is no standard commodity rate for individual communities. It is important to note that the GLWA charges at an mcf rate while local communities charge at centrum cubic feet (ccf) rate[1]. While this does not allow for a simple comparison between the two rates (wholesale v ratepayer), there is an even deeper explanation on why there is not an apples-to-apples comparison between wholesale and ratepayer rates.

As noted, retail water rates are set by elected boards, often at the recommendation of their finance and public works departments. These recommended rates are based on the wholesale prices communities pay to GLWA, the investment needed to maintain and update the city or township’s infrastructure, debt service and their staffing levels. Water rates can also be lower but fees such as a “water meter fee,” which is a fixed cost on the bill, can account for a “lower” water rate (in appearance only). Also, the elected bodies may choose not to pass on increased costs from the GLWA or for infrastructure investment.

Because of how retail water rates are set, which vary from how wholesale rates are set, there is not an easy comparison between these either. GLWA’s wholesale rates are based on the fixed monthly charge and the wholesale commodity rate charged to communities. These charges are determined by the amount of water usage by each community as well as the distance and elevation of that community from the water source (it takes more energy to pump water uphill or long distances than it does to pump it to areas near the source). The local water storage capacity of each member community can affect the rates they pay because when a community can store water they don’t need to purchase it at higher, or “peak,” rates.

The GLWA adopted wholesale rates for communities can be found here. While a comprehensive of list of retail rates does not exist, the above chart shows a comparison of retail water rates amongst several communities in South Oakland County (data provided by the South Oakland County Water Association), along with the rates for Allen Park, Washington Township and Detroit. The chart shows that Detroit, which sets its own rate, has the lowest water rate of the communities. Detroit purchases its water from the Detroit Water and Sewer Department, and not GLWA. The City of Southfield has the highest retail water rate at $5.79 per ccf. Washington Township, which is 36 miles from Detroit, has a retail water rate of $3.24 per ccfs.

The elements of water rates are important to understand as the public debates the potential creation of a statewide affordability fund for low-income residents to access. It should also be noted that part of the revenue the GLWA earns from its customers goes into the Water Residential Assistance Program (WRAP). With this program,0.5 percent of the GLWA’s revenues go into an Income Based Plan that provides bill credits to eligible households. This plan makes it so that the water bill does not exceed 3 percent of household income for up to two years (or ongoing for households with senior citizens and persons with permanent disabilities).

This post demonstrates not only how complicated our water system is, but also the way in which rates are determined. The true cost of delivering clean water is only a piece of the equation, and that varies from one community to the next. Even with such fluctuation in what ratepayers/taxpayers pay for their water, one thing is certain, rates are only increasing. Water infrastructure is aging, the cost of electricity (used to help deliver water) is increasing, staffing costs are increasing and clean water remains a necessity for life. With such factors coming into play in determining already complicated retail water rates, a reliable source of assistance for those in need can, and should be, a constant. For this reason we support the proposed State of Michigan plan to add a $2 flat fee on all our monthly bills to help the poor pay for their water. No one should have to go without water.


[1] A centrum cubic feet equals 100 cubic feet or approximately 748 gallons of water.

Proposed Michigan Water Affordability Bill Meets Opposition

Access to clean water and the ability to afford it is boiling over to a new proposal to help households with their water bills. Recently, Democratic lawmakers in the Michigan House of Representatives and the State Senate introduced bills that, if passed, would create a statewide affordability fund for low-income residents to access. The fund would be created by charging a $2 monthly fee to water customers across the state.

This proposal, discussed in detail below, is now drawing fire from Macomb County leaders and Republicans who say it will primarily benefit Detroiters.

 According to a bill analysis by the Senate Fiscal Agency (SFA), the estimated amount collected in the proposed water affordability fund, assuming  all 2.5 million retail water meters in Michigan were subject to the $2 per month funding factor fee would be $90 million. When the fund reaches $90 million, 3 percent of the monies, or $2.7 million, could be allocated for administrative costs associated with the program. The remainder of that assumed initial balance, $87.3 million, would be available for:

  • Actual administrative costs of the water providers, which would be limited to 15 percent of the balance in the Fund which after 18 months could be estimated at $13.1 million;
  • Payment or advancement to providers for income-based bill discounts; income-based bill caps, or income-based rates;
  • Arrearage payments;
  • Water loss mitigation programs.

Those eligible to benefit from this program would be customers who had a household income of up to 200 percent of the Federal Poverty Guidelines or who was eligible for certain assistance programs. Eligible customers for this program, which would be housed under the Michigan Department of Health and Human Services, would not pay more than 3 percent of their household income on a water bill.

This program has been lauded by some and opposed by others. In recent weeks, Detroit Mayor Mike Duggan, the Oakland County Board of Commissioners, Oakland County Executive David Coulter, Royal Oak, Harper Woods and Warren officials, Oakland County Water Resource Commissioner Jim Nash and Wayne County Deputy County Executive Assad I. Turfe have come out in support of the bills to create this fund. Area organizations, such as the United Way of Southeastern Michigan, Clean Water Action, the Sierra Club Michigan Chapter and American Waterworks Association, have also come out in support of the proposed bills. Supporters of these bills have discussed how water affordability is a human right, and these programs will allow that human right to continue for thousands of households.

Macomb County Public Works Commissioner Candice Miller is the most vocal official against the bills, stating it would only increase water bills for customers and that there already is access to water affordability programs. She says it will primarily benefit Detroiters. Seventeen Macomb County communities agree with Miller and have passed resolutions opposing the bills that could create the statewide water affordability programs. Those 17 communities are:

  • Armada (Village)
  • Bruce Township
  • Center Line
  • Chesterfield Township
  • Clinton Township
  • Fraser
  • Harrison Township
  • Memphis
  • Mount Clemens
  • Lenox Township
  • Macomb Township
  • New Haven
  • Roseville
  • Shelby Township
  • St. Clair Shores
  • Sterling Heights
  • Washington Township

The Macomb County Board of Commissioners also voted to take a stance against the bills, and ultimately the proposed fund.

According to Miller, water affordability programs, such as the Water Residential Assistance Program (WRAP) administered by the Great Lakes Water Authority (GLWA) are not fully used as is. The counter argument to this is that programs such as WRAP offer short-term support for those in need of assistance and other programs, such as the Detroit Water and Sewerage Department’s Lifeline Plan, have a one-off funding mechanism (ARPA) funds, and more sustainable funding mechanisms are needed. Additionally, there is no statewide assistance program, rather there are various affordability programs depending on the water provider and the location of the ratepayer. There are worries though that the proposed state affordable water fund would primarily support Detroit residents, according to a January, 2024 C&G News article.

According to the proposed bills, eligible customers are households whose income does not exceed 200 percent of the Federal poverty guidelines or who meets any of the following requirements:

  • Has received assistance from a State Emergency Relief Program within the past year.
  • Receives food assistance under the Federal Supplemental Nutrition Assistance Program (SNAP) administered by State.
  • Receives medical assistance administered under the Act. Receives assistance under the Michigan Energy Assistance Program.
  • Receives assistance under the Special Supplemental Nutrition Program for Women, Infants, And Children (WIC). Receives supplemental security income
  • Receives assistance under the Weatherization Assistance Program.

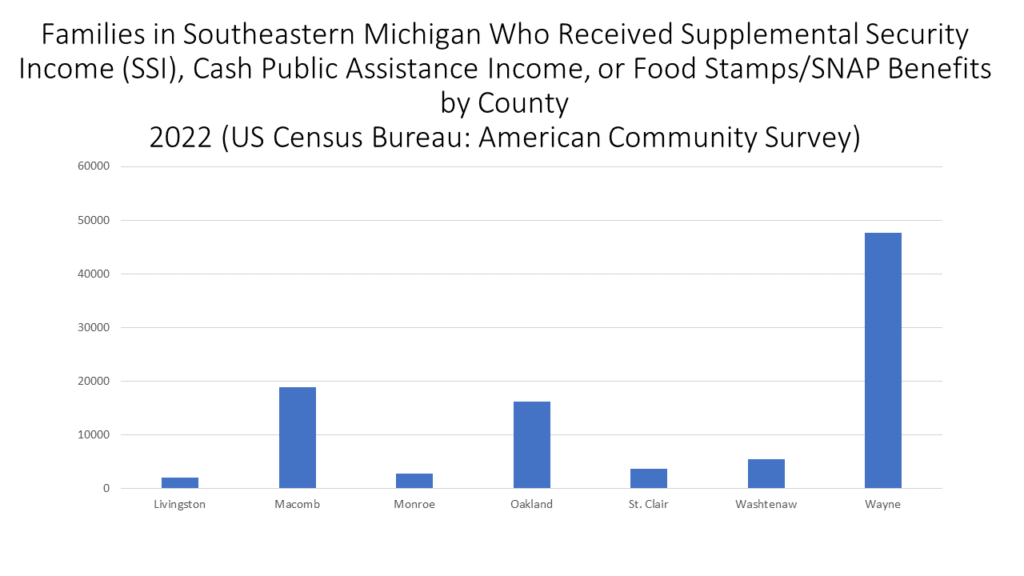
According to the Michigan Department of Health and Human Services, in 2020 more than 317,000 Michigan households were behind on their water bills and facing shutoffs. Furthermore, if looking at eligibility requirements as set out by the proposed bills, there were 309,101 families in Southeastern Michigan who were living at least 200 percent of the poverty level and 190,113 households with Supplemental Security Income (SSI), cash public assistance income, or Food Stamps/SNAP benefits in 2022, according to the US Census Bureau.

According to the Census data, Wayne County had the highest number of families living at least 200 percent below the poverty level at 133,492, followed by Macomb County at 44,218 and Oakland County at 41,037. Looking at the total number of families in Southeastern Michigan who live at least 200 percent below the poverty level, minus Wayne County, there are 124,568. In total, there are 258,060 families living 200 percent below the poverty line in Southeastern Michigan and 48 percent of those families live in either Livingston, Macomb, Monroe, Oakland, St. Clair or Washtenaw counties. Furthermore, with there being 309,101 total families in Michigan that live 200 percent below the poverty line, Wayne County families account for less than half that total.

When looking at the number of families who received Supplemental Security Income (SSI), cash public assistance income, or Food Stamps/SNAP benefits in 2022 it was Wayne County that had the highest number of households, by far, at 47,646. Macomb County had the second highest number of households at 18,792 and Oakland County had the third highest number of households at 16,100. In Michigan in 2022 there were 190,113 families who received some type of assistance and Southeastern Michigan families make up 50 percent of that number.

So, while those who oppose the proposed bills claim the funds from the statewide water bill support program would primarily be filtered to Detroiters, the data shown above tells a different story.

The numbers certainly show there are families who are likely in need of utility bill support and $24 a year per household could go a long way for many. However, annually that number can increase by up to 10 percent to a maximum of $3 per retail water meter per month, according to the Senate Fiscal Agency bill analysis. If these bills are to become law and the program is created there needs to be strong program support, ensuring those in need and eligible for the program are aware of the benefit and have assistance in applying for the benefits. The monies, if charged to ratepayers, need to be used to support those in need throughout the state and ensure access to clean and fresh water.