Detroit, Wayne County Remain Epicenter for Coronavirus

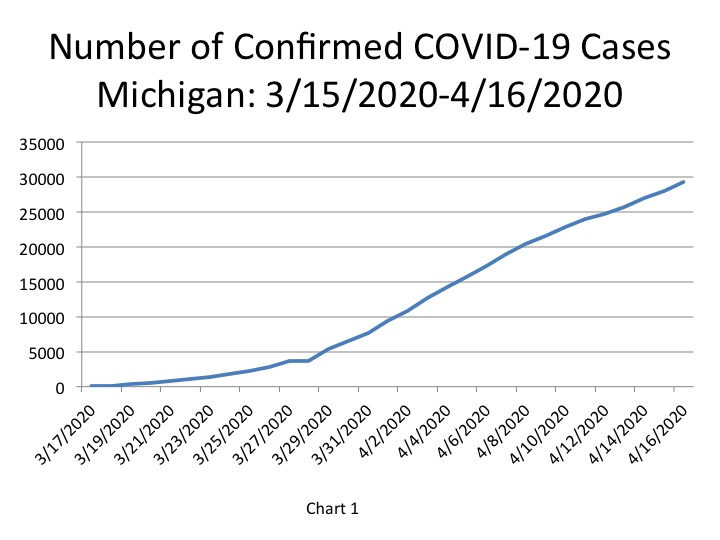
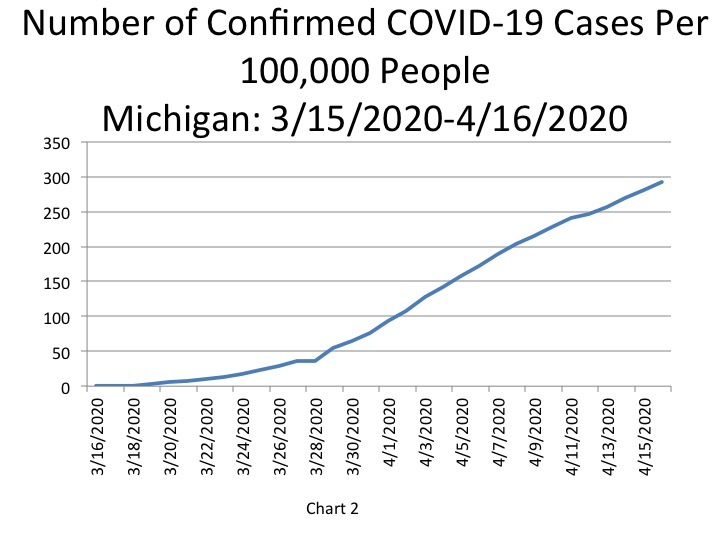
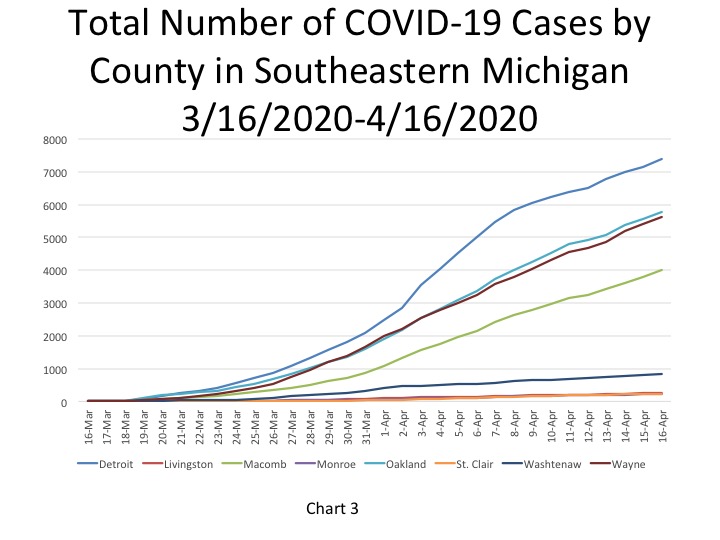
The total number of COVID cases in Michigan increased to 29,263 (Chart 1), which was equivalent to 293 cases per 100,000 people (Chart 2) on April 16. Of those total COVID cases, the City of Detroit had 7,382 cases, Oakland County had 5,778 cases, Wayne County (excluding Detroit) had 5,619 cases and Macomb County had 3,992 cases (Chart 3).  The number of confirmed cases in Washtenaw, Livingston, Monroe and St. Clair counties combined totaled 1,538, with Washtenaw County accounting for 826 of those cases,  according to the most recent data from the State.

The daily data highlighted in these posts is from Michigan.gov/coronavirus, where data is updated daily at 3 p.m. Historical data was supplied from covidtracking.com, which republishes COVID data from the State.

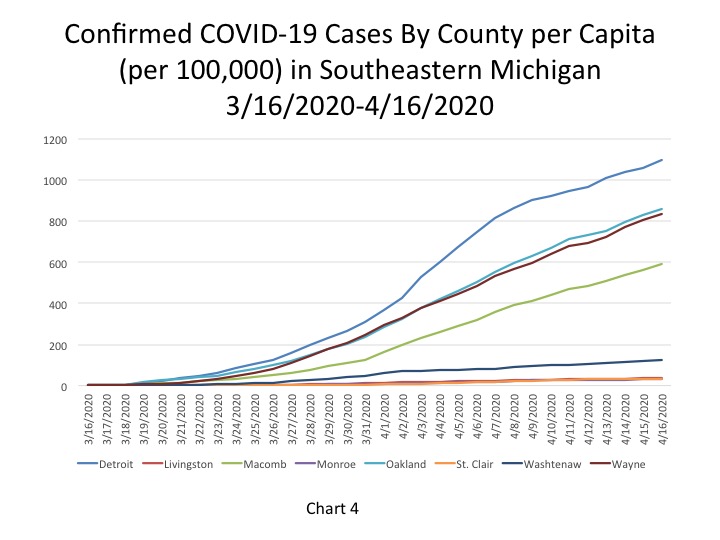
In Chart 4 we see that the City of Detroit has consistently had the highest number of COVID cases per 100,000 people, which was a rate of 1,097 on April 16. Oakland County had the second highest rate at 859 cases per 100,000 people and Wayne County (excluding Detroit) had 835 cases. Macomb County had 593 COVID cases per 100,000 people. When looking at Chart 4 we also see that there were per capita increases for every county between April 15 and April 16, with Detroit having the largest day-to-day per capita rate increase at 36.

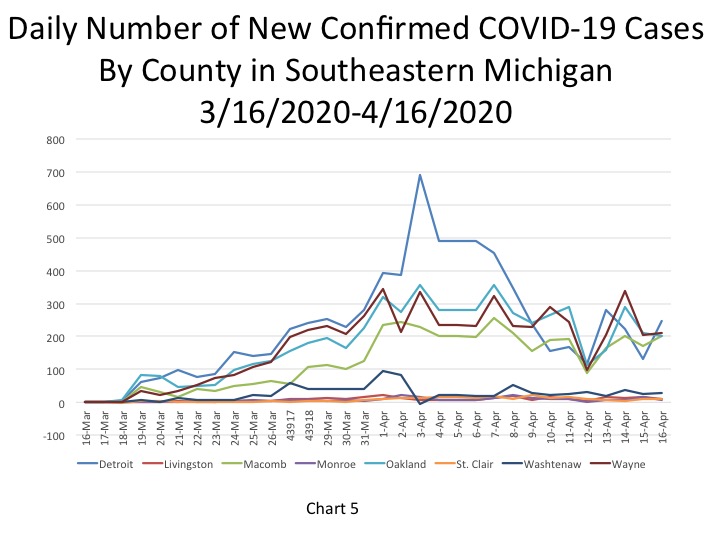
Chart 5 shows that Detroit, Macomb, St. Clair, Wayne and Washtenaw counties experienced decreases in the number of new COVID cases between April 15 and April 16. On April 16, Detroit reported the highest number of new COVID cases at 246. Wayne County had 211 new cases, Oakland County had 202 and Macomb County had 200. Washtenaw County had the fifth highest number in the region at 28 new cases.

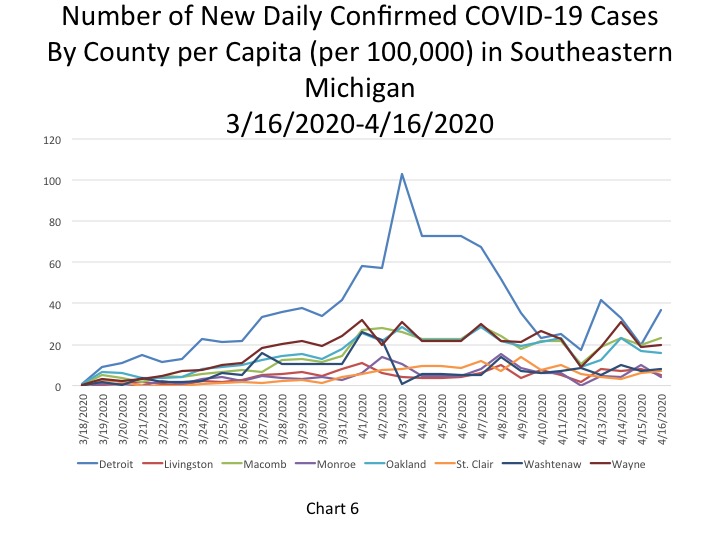
When looking at new COVID cases on a per capita basis, the data shows that Detroit and Macomb County still have the highest rates (Chart 6). According to the data, on April 16 Detroit had 37 new COVID cases per 100,000 people and Macomb County had 23 new COVID cases per 100,000 people; Wayne County had 20 and Oakland County had 16.  In Oakland County, the number of new COVID cases per 100,000 people has been decreasing since April 14.

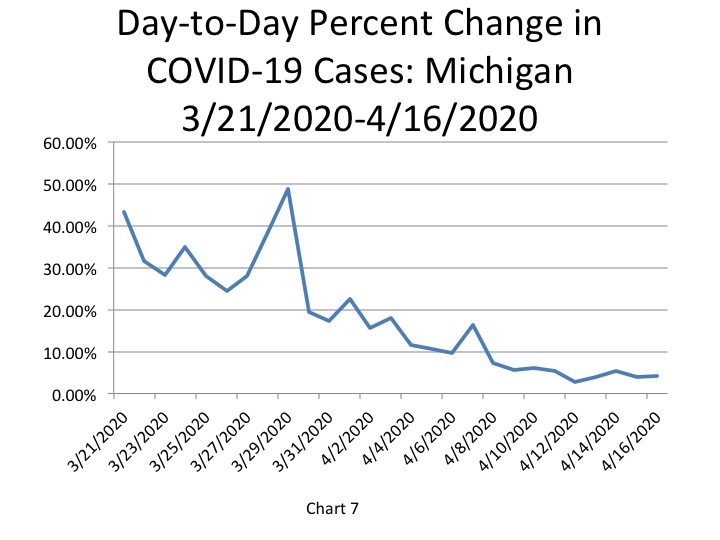
In addition to the raw data of confirmed cases, we also show the percent change in the number of cases reported day-to-day. On April 16 the percent change from April 15 was 4.29 percent, an increase from the day’s prior change of 4 percent.

Originally, we were reporting the day-to-day percent change in the number of cases from March 16. However, there was a spike in the number of tests available early on that made this data set also spike (on March 18 the day-to-day percent change as 320%). We have now started showing percent change data from March 21 forward to allow readers a more precise visual. If you would like to see the earlier versions of this data set please review our earlier posts. 

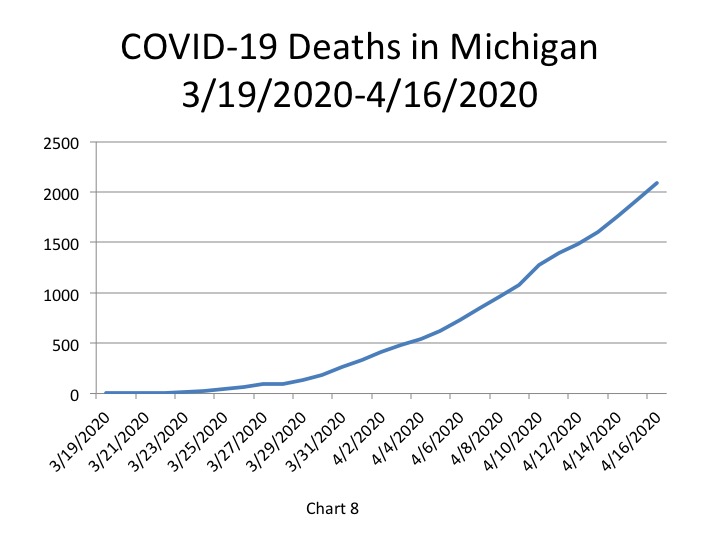
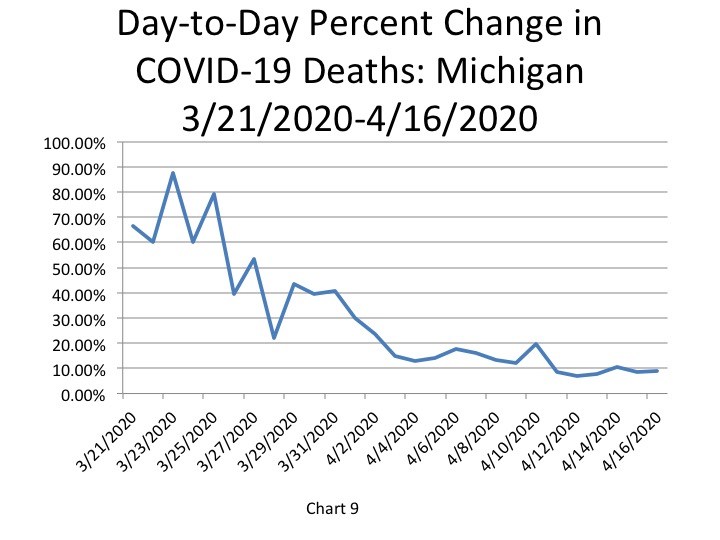
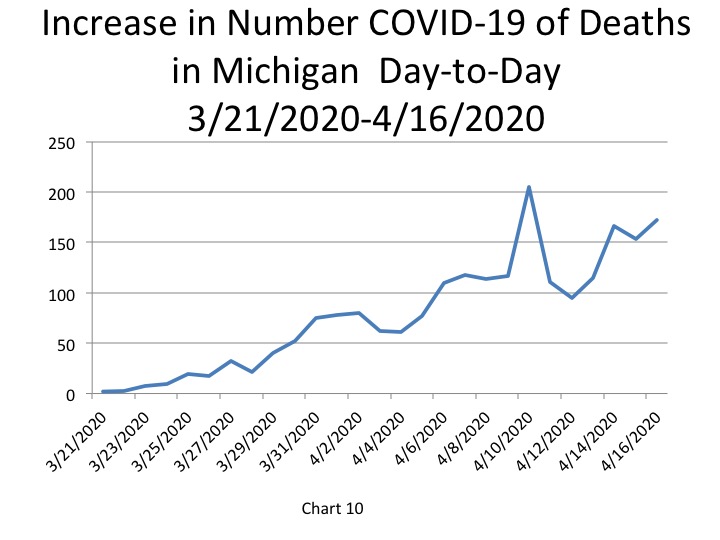
It was reported by the State of Michigan that on April 16 the total of COVID-19 deaths reached 2,093. This was a 9 percent increase from April 15, which had a slightly smaller increase of 8.7 percent of the day prior (Chart 9). The 2,093 total deaths reported for April 16 was 172 deaths higher than what was reported on April 15 (Chart 10). According to the State of Michigan, the reported increase in deaths on April 16 is related to a new weekly death certificate review the Michigan Department of Health and Human Services has put in place. As a part of this process, records that identify COVID-19 infection as a contributing factor to death are compared against all laboratory confirmed cases of COVID-19 in the Michigan Disease Surveillance System (MDSS). If a death certificate is matched to a confirmed COVID-19 case and that record in the MDSS does not indicate a death, the MDSS record is updated to indicate the death and the appropriate local health department is notified. These matched deaths are then included with mortality information posted to the State’s Michigan Coronavirus website. As a result of this week’s assessment, the data from April 16 includes 65 additional deaths that have been identified through this methodology.

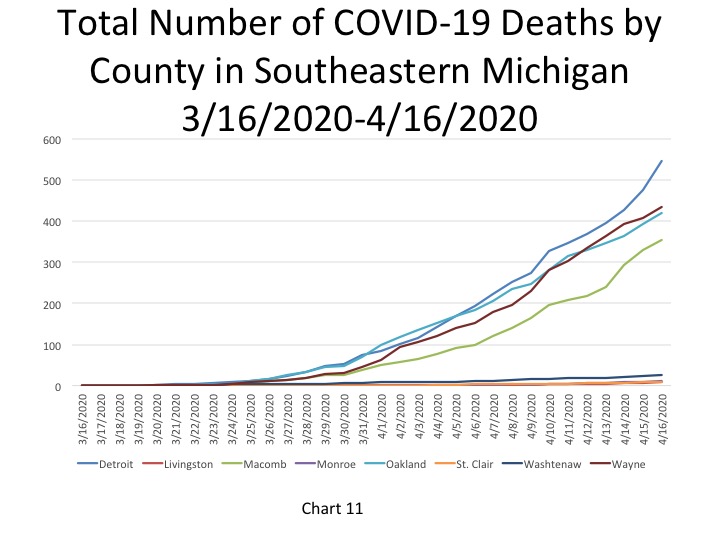
Of the total deaths reported, the number of COVID deaths in Detroit on April 16 toped over 500 at 546. On April 16, the Michigan Department of Health and Human Services also reported 435 total deaths in Wayne County (excluding Detroit), 420 in Oakland County and 354 in Macomb County. Washtenaw County had 25 deaths and Livingston, Monroe and St. Clair counties all had 10 deaths or less (Chart 11).

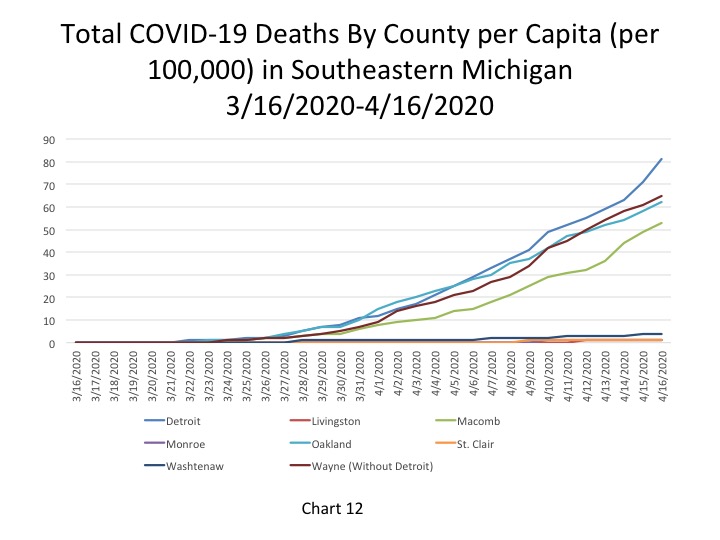
On a per capita basis, per 100,000 people, Detroit also continues to have the highest number of deaths per 100,000 people at 81; there were 71 deaths per 100,000 people in Detroit on April 15 (Chart 12). On April 16 Wayne County had 65 COVID deaths per 100,000 people, Oakland County had 62, and Macomb County had 53.

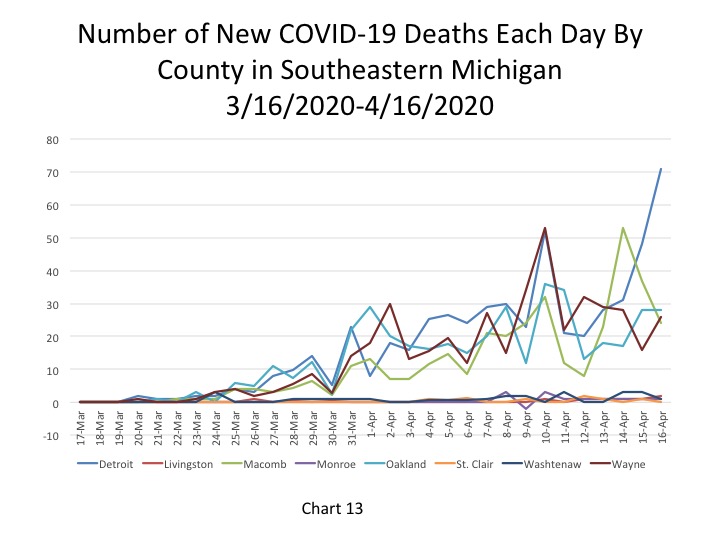
The number of new COVID deaths reported in Detroit on April 16 was nearly three times higher than those reported in Wayne, Oakland or Macomb counties. On April 16 there were 71 new COVID deaths in Detroit, 26 in Wayne County (excluding Detroit), 28 in Oakland County and 24 in Macomb County. Monroe County reported 0 new deaths.

Detroit and Wayne County continue to remain the epicenter of the virus. When looking at the entire state, only one county in the Lower Peninsula has not reported any coronavirus cases and that is Benzie County (near Traverse City). The spread has not stopped, and in areas such as Detroit and Wayne and Macomb counties it doesn’t appear to have slowed much. Oakland County though has reported a decrease in the number of new daily cases for the last few days, and the number of new daily deaths has remained stagnant for the same time period. In Macomb County, the number of new daily deaths has decreased but the number of new daily cases has continued to increase.

Census 2020: Hard to Count Areas in Southeastern Michigan

The goal of the 2020 Census is to count each person in the U.S., based on their primary residence, by April 1, 2020. However, the fear is that several communities in Michigan will be undercounted in the 2020 Census, meaning a lack of federal funding in the future. And a major portion of 7-county Southeastern Michigan area is in the so-called “hard to count” category.

The majority of the Census is completed by households self-responding via mail or online, starting this year. Throughout the country there are areas where self-response rates are very high, and in other areas they are just the opposite. The areas with previously low self-response rates have been deemed as “hard to count” areas; these areas often include minority and immigrant populations, along with renters and children under the age of 5.

Data for this post was provided by City University of New York, and they deemed an area hard to count if its self-response rate was 73 percent or less for the 2010 Census. This percentage is based on the mail return rate from occupied housing units for the 2010 Census.

As the map shows below, at the county level, self-response mail in rates are high throughout Southeastern Michigan, ranging from 78.5 percent to 86.6 percent. Livingston County had the highest self-response rate at 86.6 percent while Wayne County had the lowest at 78.5 percent. Breaking this data down to the census tract level helped determined what areas would be hard to count for the 2020 Census.

Overall, at the county level, five of the seven counties have hard to count populations. Wayne County has the highest hard to count population at 30 percent and Macomb County has the lowest hard to count population (of those with such a population) at 2 percent. Livingston and St. Clair counties did not have any hard to count data available. Wayne and Washtenaw counties are the only two in the region with hard to count populations in the double digits (30 and 10 percent, respectively).

When looking at the counties on a deeper level, by census tract, we see that Highland Park, Inkster and Detroit (all in Wayne County) have the largest hard to count populations in the region. In Highland Park 100 percent of the population is considered hard to count for the 2020 Census; in Inkster that percentage is 91 percent and in Detroit 86 percent of the population is considered hard to count. The top reason for all three of these cities having such a percentage of hard to count populations is due to the high poverty levels. Other reasons, according to AP News, include a high African American population, low response rates to the American Community Survey and a high percentage of children living below the poverty level. Of the hard to count communities in Southeastern Michigan (27), nine have hard to count populations above 50 percent.

Washtenaw County has the second overall highest percentage of hard to count populations. This is because Ypsilanti has 52 percent of the population considered hard to count. Ann Arbor is estimated to have 29 percent of its population designated as hard to count. The main reason for Ann Arbor’s hard to count status is because of the high percentage of residents between the ages of 18-24 years of age (the University of Michigan is located in Ann Arbor); there is also a high proportion of renters there and a high proportion of individuals who move residences from one year to the next. In Ypsilanti there is a high hard to count population due to high poverty levels and the high number of renters.

To ensure overall high self-response rates the Census Bureau has now made it possible for individuals to complete the Census online, by mail and over the phone. If residents do not respond by one of those methods census takers will knock on the doors of homes that have not responded. Additionally, communities throughout the stateare also putting together large outreach campaigns to ensure members of their communities complete the Census. For example, the City of Detroit has a website that lists Census resources, ways to volunteer for outreach events and how to apply for a job with the Census. For more information on the Census visit 2020census.gov.

Alcohol Causes Most Traffic Deaths in Southeastern Michigan, Distracted Driving Causes Most Injuries

Traffic fatalities in Michigan totaled just under 1,000 in 2018, a number that officials from the Michigan State Police said is too high. However, that number was below the 2016 and 2017 traffic fatality numbers which rose above 1,000. Below we examine the number of traffic fatalities and injuries in Southeastern Michigan, along with the number of fatalities and injuries related to alcohol, distracted driving and drugs. As the charts show, of the factors examined, alcohol is the largest contributor to traffic fatalities in the region.  

Wayne County, which is also the largest county in the state, had the highest number of traffic fatalities at 164, 63 of which were alcohol related. Distracted driving contributed to 6 of the164 deaths and drugs contributed to 38. Oakland and Macomb counties had the second and third highest number of traffic fatalities in the region at 54 and 53. In Oakland County, of the 54 traffic fatalities, 13 were alcohol related, 3 were related to distracted driving and 8 were related to drugs. For Macomb County, alcohol contributed to 18 of the 53 traffic deaths and distracted driving contributed to 3 of the deaths; there were not any drug related traffic deaths.

When looking at the percentage of alcohol related traffic deaths compared to the total number of traffic deaths, Monroe County had the highest rate. Of the 29 traffic deaths in Monroe County in 2018, 48 percent of them (14) were alcohol related. St. Clair County had the lowest percentage at 6 percent. In 2018 there were 16 traffic deaths in St. Clair County and 1 was alcohol related. With those two exceptions, the percentage of alcohol related traffic deaths ranges between 24 and 38 percent.

Of the other two factors, drugs contributed more to traffic fatalities than distracted driving.

Injuries related to vehicle accidents are higher than fatalities and while Wayne, Oakland and Macomb still had the highest numbers in the region, the data shows that distracted driving was reported to be the largest contributor of the factors examined. Overall, data indicated that distracted driving contributed to an average of 10 percent of the traffic related injuries in Southeastern Michigan in 2018. In Macomb C, Monroe and Washtenaw counties distracted driving contributed to 11 percent of the traffic related injuries and in Wayne County distracted driving contributed to 7 percent.

 Although Wayne County had the lowest percentage of distracted driving related traffic injuries in the region, it had the highest number at 1,082 (there were 16,578 total injuries). Alcohol was related to 897 traffic injuries in Wayne County and drugs were related to 281 injuries. In Oakland County there were 10,105 total traffic related injuries, 572 of which were alcohol related, 1,013 of which were related to distracted driving and 199 of which were related to drugs. In Macomb County there were 7,360 traffic related injuries, 391 of which were related to alcohol, 813 of which were related to distracted driving, and none of which were related to drugs. And, while Macomb County did not report any drug related traffic injuries in 2018, St. Clair County was the only county in the region where there were more drug related traffic injuries than alcohol or distracted driving injuries. In 2018 there were 931 traffic injuries in St. Clair County, 122 of which were related to drugs. 

While the full 2019 Michigan State Police Report on traffic fatalities and injuries has not been released, officials maintain that they continue to strive for fewer than 1,000 fatalities each year. Additionally, officials have said they believe the lower 2018 number is related to additional efforts made to educate drivers and stricter enforcement. The 2019 numbers will be released in March, and at that time we will examine the new data and compare it to historical data.

DIA Seeks Millage Renewal

Throughout the Metro-Detroit region there are multiple millages being levied to support regional entities, most of which were born out of Detroit’s bankruptcy and the economic downturn. When some of these millages were originally levied, the initial intentions expressed to the public were that they were for only a specific amount of time, such as with the Detroit Institute of Authority (DIA). However, the Detroit Zoo for example passed a 0.1 millage in 2008, and then came back to voters in 2016, two years before the 10 year millage was set to expire, and asked for a renewal. The 0.1 millage renewal passed, and this public support for the Detroit Zoo continues to be levied; the cost of the Zoo millage for a home valued at $100,000 ($50,000 taxable value), is $5. We have also seen the Suburban Mobility Authority for Regional Transportation (SMART) continuously seek millage renewals and increases, the most recent being a 1 mill renewal for four years that was approved by voters in 2018.

Now, as the end of 2019 nears, the Detroit Institute of Arts (DIA) recently announced it is up against the clock to put millage renewal language on the March 2020 ballot. The 10-year millage was originally approved by voters in Macomb, Oakland and Wayne counties in 2012, and it was stated at that time that it was a one time request, allowing the museum time to build up its endowment for long-term financial support of operations, according to news articles of 2012 and present. Now seven years into the one-time millage, DIA officials have announced a 10-year renewal is necessary to continue offering the services the public has come to expect. In order to do this the three Art Authorities in Macomb, Oakland and Wayne counties (which were born out of articles of incorporation crafted and approved by the corresponding Board of Commissioners) must approve the ballot language. Just last week the Wayne County Art Authority approved putting the 0.2 mill renewal on the ballot, Oakland County is expected to debate the potential millage renewal later this month and the Macomb Art Authority will do so on Dec. 3.

As discussions again begin to ramp up over whether another regional millage renewal is necessary, it is important to consider what benefits the current tax dollars levied for the DIA may have created the region. In addition to free general admission for Macomb, Oakland and Wayne residents additional benefits can be covered under three main areas: investment in schools (free field trips with bussing, teacher professional development, and curriculum development), investment in the senior population (free group visits for older adults on Thursdays with free transportation and special programs), and investment in community partnerships (Inside/Out program, partnerships with area non-profits).

The first chart below shows the amount of money invested into the schools in the region by county and by year. In total, between 2013 and 2018 392,231 students in the tri-county region have had access to the school programs now offered by the DIA, with that investment totaling about $4.3 million. Of the three counties the most amount of money has been invested into the Wayne County schools, with that total being about $2.2 million. Wayne County has the highest population of the three counties.  It should also be noted though that investment into these various programs in the counties requires participation from the residents.

When looking at the amount invested in the senior programs since 2013 that total is about $1.7 million with the total number of seniors being reached by these special programs being 32,422. The largest investment with the senior programs since the millage has been in Oakland County with a total of  $725,362 being invested into the senior population.

Finally, the area where the most investment has been made is in the community partnerships area. Between 2013 and 2018 about $5.3 million was invested. The largest investment was in Oakland County at about $2 million. In Wayne County $1.9 million was invested, and in Macomb County about $1.3 million was invested.

It appears a new trend is emerging where millages will be needed to support regional entities and interests (the Zoo, the DIA, transit) along with day-to-day services in some cities and counties. For example, in Detroit there are currently discussions about a March ballot proposal to levy additional funds to move blight removal in the city along at a much faster pace. In Macomb County residents will asked to decide if they want to pay additional taxes in order to build a new jail. So it may be even more important for taxpayers to understand what additional taxes are appearing on their tax bill and what their priorities are. In the coming weeks we will look at the additional taxes residents pay in certain communities throughout the region to shed further light on what tax bills are now looking like.

Prison Most Common Sentence for Felony Assaults

As part of the annual Michigan Department of Corrections report assaultive felony offensives are also examined to better understand what percentage of the  offenders are sentenced to either prison, jail, probation, community service or another combination. According to the data, prison sentences tended to be the most common. Monroe County had the highest percentage of felony assault offenders sentenced to prion at 39.6 percent. Wayne County had the second highest sentencing rate at 36.6 percent and Macomb County had the lowest rate at 27.5 percent.

For the jail category, St. Clair County had the highest sentencing rate for felony assault offenders at 38.8 percent; this was 10 percent higher than those in St. Clair County who were sentenced to prison for felony assault charges. Oakland County had the second highest at 23.3 percent. Wayne County had the lowest percentage of felony assault offenders sentenced to jail at 6 percent; the county with the second lowest sentencing rate was Monroe County at 11.7 percent.  

For a sentencing combination of jail and probation, Monroe County had the highest sentencing rate for felony assault offenders at 48.1 percent; Livingston County had the second highest rate at 44 percent. Wayne County was the only county in the region to have a jail and probation combination sentencing rate below 20 percent. According to the data, 15.1 percent of felony assault offenders in Wayne County were sentenced to a jail/probation combination.

Livingston, Monroe, Oakland and St. Clair counties all sentenced less than 5 percent of felony assault offenders to probation, with Monroe County having the lowest sentencing rate at 0.6 percent. Conversely, Wayne County had the highest probation sentencing rate at 42.3 percent, a trend we’ve seen throughout this series. Wayne County’s probation sentencing rate was nearly 20 percentage points higher than the county with the second highest rate (Washtenaw County had a rate at 24 percent).

No county in the region sentenced more than 2 percent of the felony assault offender population to community service, restitution, fines and/or costs.

Prison appears to be the most common sentencing type for felony assault offenders, except for Wayne County where nearly half the felony assault offender population was sentenced to probation.  

Southeastern Michigan Communities Working to Fund Pension Systems

In 2017 the Protecting Local Government Retirement and Benefits Act was passed, with the goal of identifying the systems that are underfunded. According to the State of Michigan, a retirement fund is underfunded if less than 60 percent of the fund is funded, and there is an annual required contribution that is over 10 percent of governmental fund revenues. While 60 percent is the current threshold, there are discussions that eventually that number will continue to increase to 100 percent to more accurately reflect the funded status of a retirement plan. There are also thresholds that determine if a local government entity has an underfunded retiree health care system, an issue we will explore next week.

Currently, in the State of Michigan local government entities are facing, in total, over $18 billion in unfunded liabilities for retirement and retiree healthcare funds, according to the Reason Foundation. This foundation worked with the State of Michigan to develop the Protecting Local Government Retirement and Benefits Act and the reporting system that goes along with it.

The maps below provide details on what local government retirement plans are preliminary funded or underfunded in Southeastern Michigan, as determined by the Michigan Department of Treasury through implementation of the Protecting Local Government Retirement and Benefits Act. These are deemed preliminary due to the fact the new oversight body for determining funded, unfunded and waiver status must still review information submitted. Note, information is not displayed for all local government units in the region because not all units had provided their funding as of June 9, 2018. Additionally, some local government units beyond cities and townships are included in the data provided by the State, such as public safety retirement funds.

Of the 183 local government entities (this includes multiple funds for one municipality) that submitted their retirement funding information to the State for the Southeastern Michigan region, 37 of them were reported as having an underfunded status, or less than 60 percent of the retirement fund being funded. Of those that were reported as being underfunded, the majority of them had 45 percent or more the entity’s retirement system funded. However, there were five entities with 25 percent or less of the retirement system funded. These entities were:

  • Capac (St. Clair County): 24.2%
  • Highland Park General Employee fund: 2%
  • Highland Park Public Safety Fund: 3.7%
  • Highland Park Police and Fire Fund: 6.8%
  • Taylor City Housing Commission Authority: 0%

It should be noted that while the City of Taylor’s Housing Commission Authority retirement fund is underfunded, the City of Taylor’s general employee and police and fire retirement funds met State guidelines to be determined funded.

As part of the newly adopted State legislation related to retirement and retiree health care plans a Municipal Stability Board was created to review the corrective plans that underfunded entities must create and submit to the State. This board is housed under the Michigan Department of Treasury is made up of three individuals appointed by the governor. Corrective plans must be developed and submitted within 180 days of the State determining an entity’s retirement system is underfunded.


On the opposite side of the spectrum, while there were far more local government entities that were determined have funded retirement systems, than not, there were several that were more than 100 percent funded. The entities with the highest percentage of funding for their retirement funds were:

  • City of Ferndale (General Employees): 253%
  • City of Dearborn (Chapter 24): 239%
  • City of Pontiac (General Employees); 176%
  • City of Ypsilanti (General Employees) 126%
  • City of Grosse Pointe: 119%
  • City of Troy: 117%
  • Lima Township: 112%
  • City of Grosse Pointe Farms: 111%
  • City of Gibraltar (General Employees): 106%
  • City of Dearborn (General Employees): 104.3%
  • City of Mt. Clemens: 103%
  • Oakland County: 103%
  • City of Gibraltar (Public Safety): 102%
  • Groveland Township: 101%

Funding of retirement plans is vital for all local government entities as underfunded plans can lead to long-term financial troubles for a government entity, not excluding bankruptcy. Additionally, underfunded plans can also affect recruitment and retention of employees.

Pedestrian Deaths Out Number Cyclist Deaths in Southeastern Michigan

In 2017 there were more vehicle related crashes and fatalities involving pedestrians than there were ones involving bicycles in Southeastern Michigan. According to the data from the Michigan Department of Transportation, there were 1,226 crashes involving pedestrians in Southeastern Michigan in 2017 and 84 pedestrian fatalities. Regionally, Wayne County had the highest total number of pedestrian related crashes at 688. Oakland County had the second highest total number of pedestrian crashes at 213. Of the seven counties in the region, Wayne, Oakland, Washtenaw and Macomb counties all had more than 100 involved pedestrian related crashes. Livingston County had the lowest number of pedestrian crashes at 17.

Just as Wayne County had the highest number of pedestrian crashes, it also had the highest number of pedestrian fatalities. In total, there were 38 pedestrian fatalities in Wayne County in 2017. Regionally, there were 84 pedestrian fatalities in 2017 and St. Clair County had the lowest at two. The map below shows the range of pedestrian accidents by color and presents the number of fatalities next to the county label.

The Detroit map below shows the total number of pedestrian crashes by city block in 2016. This data was provided by the Detroit Open Data portal. The block with the highest number of pedestrian crashes is on the Eight Mile border on the more eastern side of the City. However, you will see the highest concentration of pedestrian crashes was located in the downtown up through Midtown area.

Just as Wayne County had the highest number of pedestrian crashes, it also had the highest number of pedestrian fatalities. In total, there were 38 pedestrian fatalities in Wayne County in 2017. Regionally, there were 84 pedestrian fatalities in 2017 and St. Clair County had the lowest at two.

In 2017 there were 914 bicycle related crashes, with Wayne County having the highest total at 428. Wayne, Oakland and Macomb counties were the only three counties in the region with more than 100 bicycle related crashes. Livingston County had the lowest total at 19. When examining the total number of bicycle related fatalities there were five in the region, with Macomb County having the highest total at two.

While fatalities for cyclists were lower than pedestrian fatalities, in recent years there has been an increase, according to an MLive analysis of fatality numbers. While no specific reason for the increase has been identified, cyclists are encouraged to yield at appropriate intersections, wear bright clothing and utilize bike lanes when possible. Additionally, motorists are also expected to pay attention and provide appropriate distance between their vehicle and a cyclist.

Southeastern Michigan Poverty Levels Drop Slightly

Throughout Southeastern Michigan, majority of the communities in the region experienced a decrease in the percentage of residents living below the poverty level between 2015 to 2016, according to data from the U.S. Census Bureau. In 2016, a family of four was considered to be living at the poverty level with an annual income of $24,250, according to the U.S. Department of Health and Human Services; this was the same for 2015.

Southeastern Michigan was -0.2 percent. However, Summerfield Township in Monroe County experienced a 7 percent increase in the percentage of residents living below the poverty level between 2015 and 2016. In 2015, 9 percent of residents in Summerfield Township lived below the poverty level and in 2016, 16 percent of residents lived below the poverty level. Of the 28 municipalities (out of 213 in Southeastern Michigan) where there was a 1 percent or higher increase in the poverty level between 2015 and 2016, the majority were located in the rural suburbs of the region.


The municipality with the largest percentage decrease in residents living in poverty was Port Huron Township in St. Clair County at -5 percent. In 2015, 23 percent of the residents in Port Huron Township lived below the poverty level and by 2016 that decreased to 18 percent.

While there was an overall average decrease in the percentage of residents living in poverty between 2015 to 2016, the two cities with the highest overall percentage of residents living below the poverty level experienced an increase. In 2016, about 50 percent of the residents in Hamtramck lived below the poverty level; this was a 2.4 percent increase from 2015. In 2016, Highland Park had about 47 percent of its residents living below the poverty level, which was an increase of 2.5 percent.


Detroit

In 2016, about 39 percent of residents in Detroit lived below the poverty level, which was a decrease of 1 percent from 2015. A closer look at the Census tracts in Detroit though show that poverty levels did not decrease across the board. One Census tract specifically, which is located along the Detroit River in Southwest Detroit, experienced a 49 percent increase in the percentage of residents living below the poverty level. In addition to that Census tract, several others surrounding it also experienced poverty level increases up to 19 percent.

When looking at the Census tracts east of Hamtramck, with the exception of seven, all experienced a decrease in the percentage of residents living below the poverty level. It was this area of the City of Detroit that had the fewest number of Census tracts with percentage increases in the poverty level but also had among the highest poverty levels in 2016. It was just west of Highland Park though that had the most number of Census tracts with poverty levels below 35 percent in 2016.

Overall, the most recent poverty data released by the U.S. Census Bureau does show that poverty levels are decreasing, but not a rapid rate. The data also shows that there were 19 municipalities in the region with 20 percent or more of residents living below the poverty level. While this was a decrease from the 23 municipalities with the same statistic in 2015, the numbers still tell a story that Southeastern Michigan isn’t climbing out of poverty rapidly. We will need many years of broad based economic growth to reduce poverty levels substantially.

Four Southeastern Michigan School Districts Eliminate Budget Deficits

By the end of Fiscal Year 2016 there were four public school districts in Southeastern Michigan that eliminated their deficits while one new district was added to the list of having a deficit, according to the Michigan Department of Education. The four public school districts that eliminated their deficit by June 30, 2016 were Clintondale Community School (ended with a fund balance of about $1.4 million) and Warren Consolidated Schools (ended with a fund balance of about $5.7 million), both in Macomb County, Southgate Community Schools (ended with a fund balance of about $375,000) in Wayne County and Lincoln Consolidated Schools (ended with a fund balance of about $3.6 million) in Washtenaw County. Grosse Ile Township Schools in Wayne County began FY 2016 with a fund balance of $189,441, but ended the fiscal year with a deficit of $152,299. This was the only public district in the region and state to be added to this list. However, there were four charter schools in the region (Blanche Kelso Bruce Academy, Experienca Prepatory Academy, Frederick Douglas International Academy, Taylor International Academy) that began FY 2016 with a fund balance and ended with a deficit.

While there were districts that eliminated their deficit by the end of FY 2016, there were five public school districts in the region that ended the fiscal year under the oversight of the Michigan Department of Treasury (these districts are distinguished in red in the map, however if a district also increased or decreased its deficit they are highlighted in a different color in the map). A district is put under the oversight of the Department of Treasury if it maintains a deficit for five years. The public districts in the region under such oversight are: Detroit City School District, Hazel Park City School District, Mt. Clemens Community School District, New Haven Community Schools and the Pontiac City School District. Additionally, while the New Haven Community Schools and Hazel Park City School District began and ended FY 2016 with deficits, and under the supervision of the Department of Treasury, by the end of FY 2016 both districts had reduced deficits. At the beginning of the fiscal year New Haven Community Schools had a deficit of about $296,000 and by the end it had a deficit of about $65,000. The Hazel Park City School District had a deficit of about $8 million at the beginning of FY 2016 and by the end the fiscal year the deficit was reduced to about $6 million. There were also three other public school districts in the region that began FY 2016 with a deficit but reduced it by the end of the year; these districts were Dearborn Heights, Garden City and Pinkney.

The Detroit school district and Mt. Clemens Community Schools were the only two public districts in the region that began FY 2016 with a deficit and ended the fiscal year with an increased deficit; these distinctions are shown in the map although they too ended the year under the oversight of the Michigan Department of Treasury. Detroit Public Schools began FY 2016 with a deficit of about $1.8 million and ended the fiscal year with a deficit about $1.9 million. The Mt. Clemens Community Schools district began FY 2016 with a deficit of about $1.3 million and ended the fiscal year with a deficit of about $2.2 million.

slide3

Southeastern Michigan Economy Gaining Strength

  • The unemployment rate across the state remained stagnant while the rate in the city of Detroit decreased (monthly);
  • The number of employed Detroit residents increased, (monthly);
  • The Purchasing Manager’s Index for Southeastern Michigan remains strong, especially after increasing 7 points (monthly);
  • The Commodity Price Index remained the same (monthly);
  • The Standard and Poor’s Case-Shiller Home Price Index for the Detroit Metropolitan Statistical Area shows home prices continue to increase monthly and annually.

slide03

According to the most recent data provided by the Michigan Department of Technology, Management and Budget, the unemployment rate for the State of Michigan slightly increased to 4.7 in October of 2016 from 4.6 the previous month. However, unemployment in the City of Detroit decreased to 11.1 in September, from 12.4 the previous month. The September unemployment rate in 2016 was 0.4 points lower than it was in September of 2015.

slide05

In September of 2016 the number of employed Detroit residents rose to 221,238, an increase of 2,314 from August. Between September of 2016 and September of 2015 there was a total increase of 10,012 employed Detroit residents, according to the Michigan Department of Technology, Management and Budget.

While the number of employed Detroit residents increased between August and September the labor force decreased by 1,067. In August the labor force was reported to be 250,047 and in September it was reported to be 248,971.

slide07

The Purchasing Manger’s Index (PMI) is a composite index derived from five indicators of economic activity: new orders, production, employment, supplier deliveries, and inventories. A PMI above 50 indicates the economy is expanding.

According to the most recent data released on Southeast Michigan’s Manager’s Index, the PMI for October 2016 was 67.2, an increase of 7 points from the prior month. The October 2016 PMI was an increase of 8.4 from the previous year.  With this increase, the PMI is considered to be strong, particularly because it has remained above 50 since June of 2014. Much of this growth, according to the Institute of Supply Management of Southeastern Michigan, is due to the resurgence of the auto sector in the region.

slide09

The October 2016 Commodity Price Index decreased 0.2 points from September but increased 3.2 points from the prior year. The three month average for the Commodity Price Index was 48, which the Institute of Supply Management of Southeastern Michigan states is good for short-term profits.

slide11

The above charts show the Standard and Poor’s Case-Shiller Home Price Index for the Detroit Metropolitan Statistical Area. The index includes the price for homes that have sold but does not include the price of new home construction, condos, or homes that have been remodeled.

According to the index, the average price of single-family dwellings sold in Metro Detroit was $109,660 in August 2016. This was an increase from $103,750 from August of 2015 and an increase from $98,720 from August of 2014.