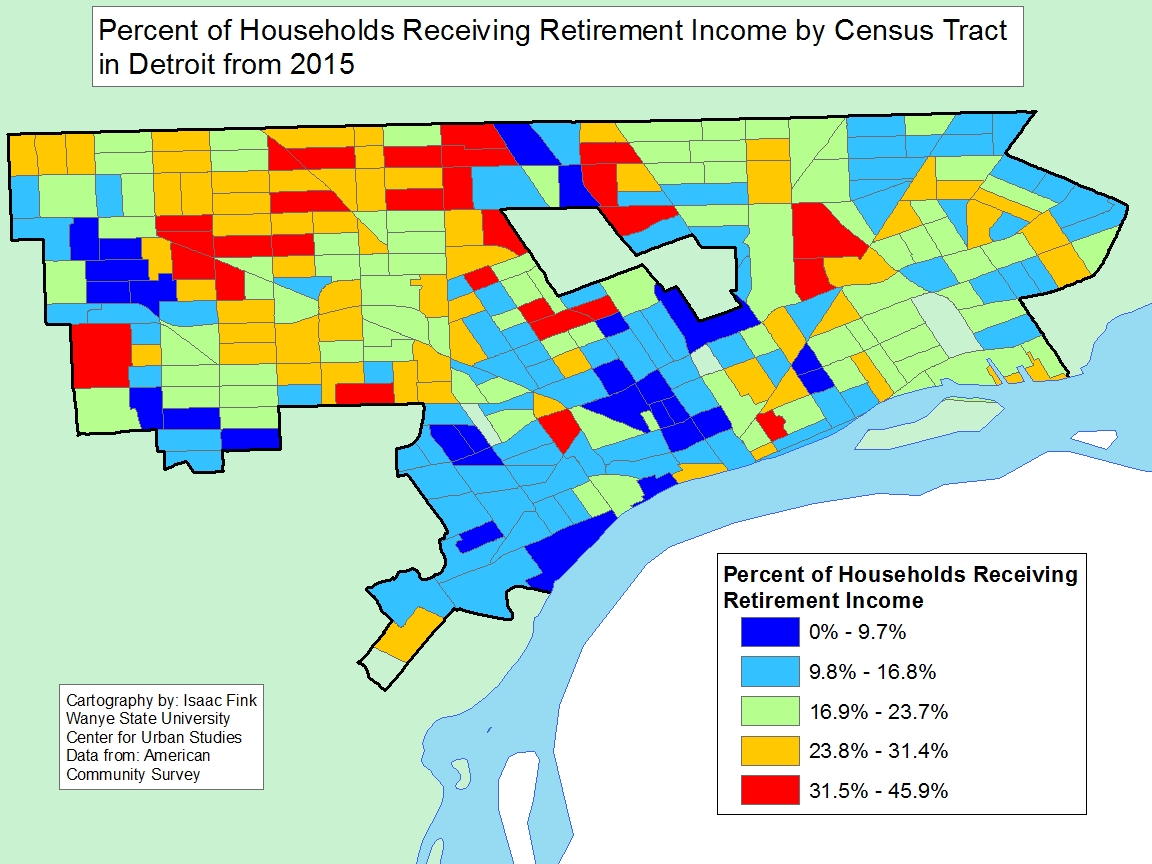
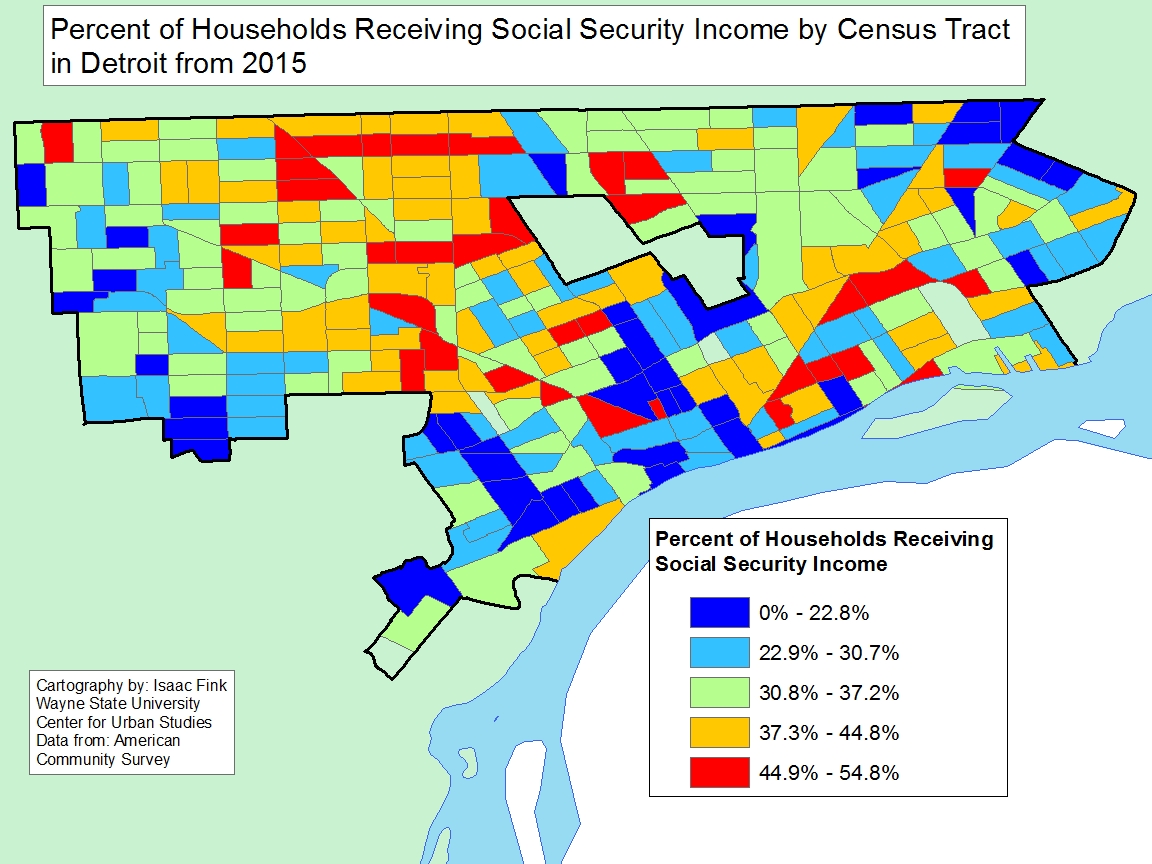
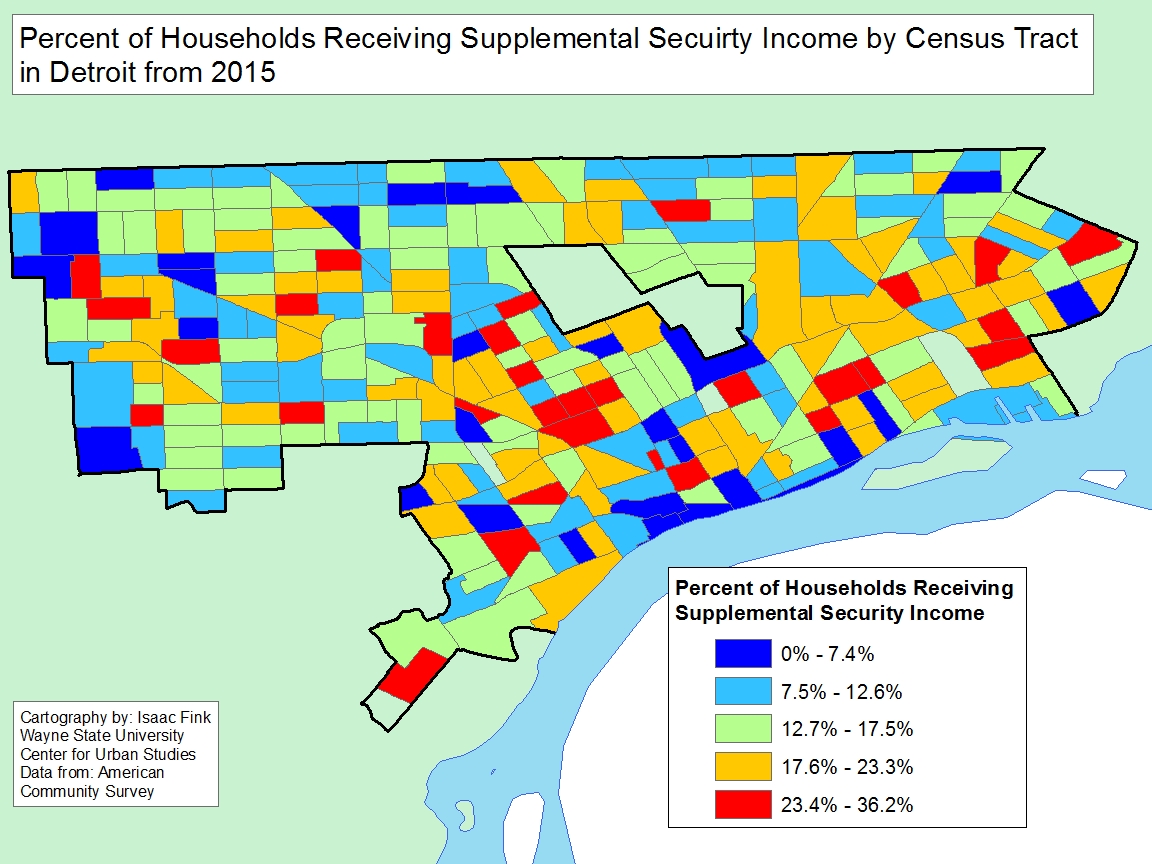
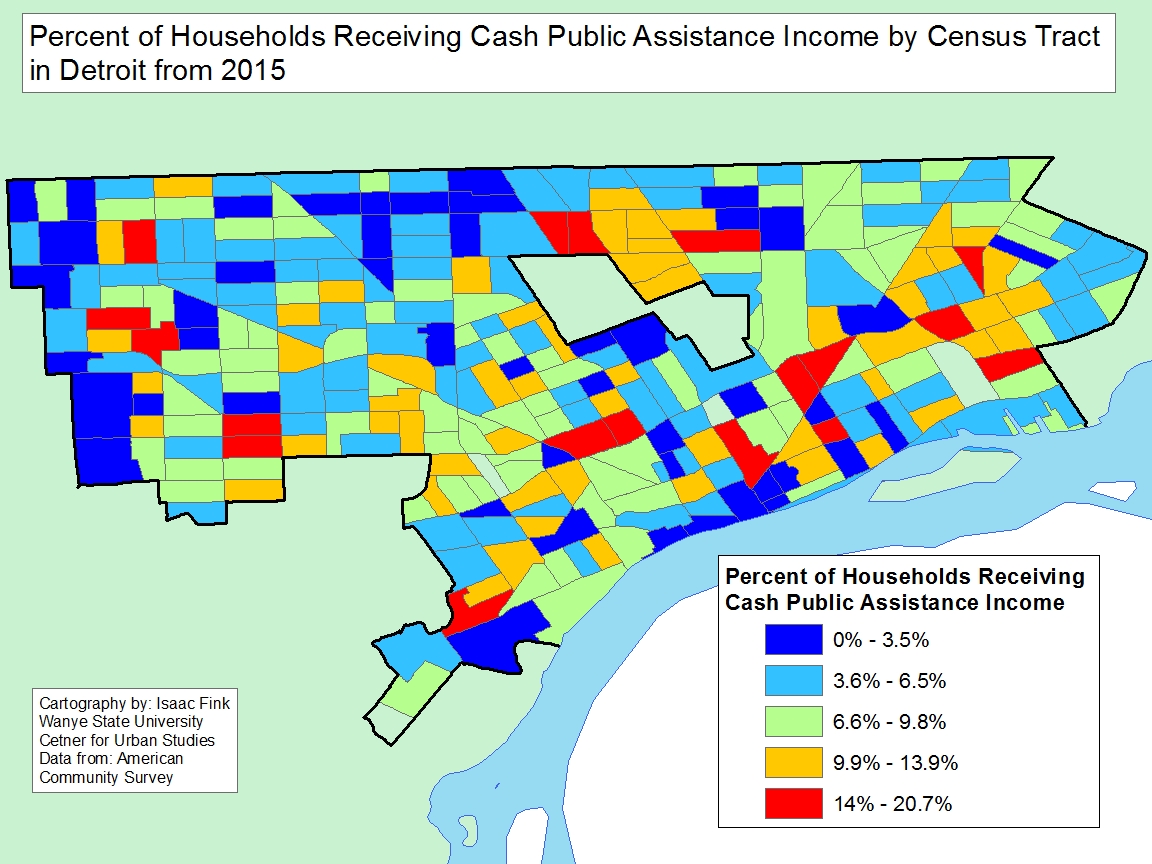
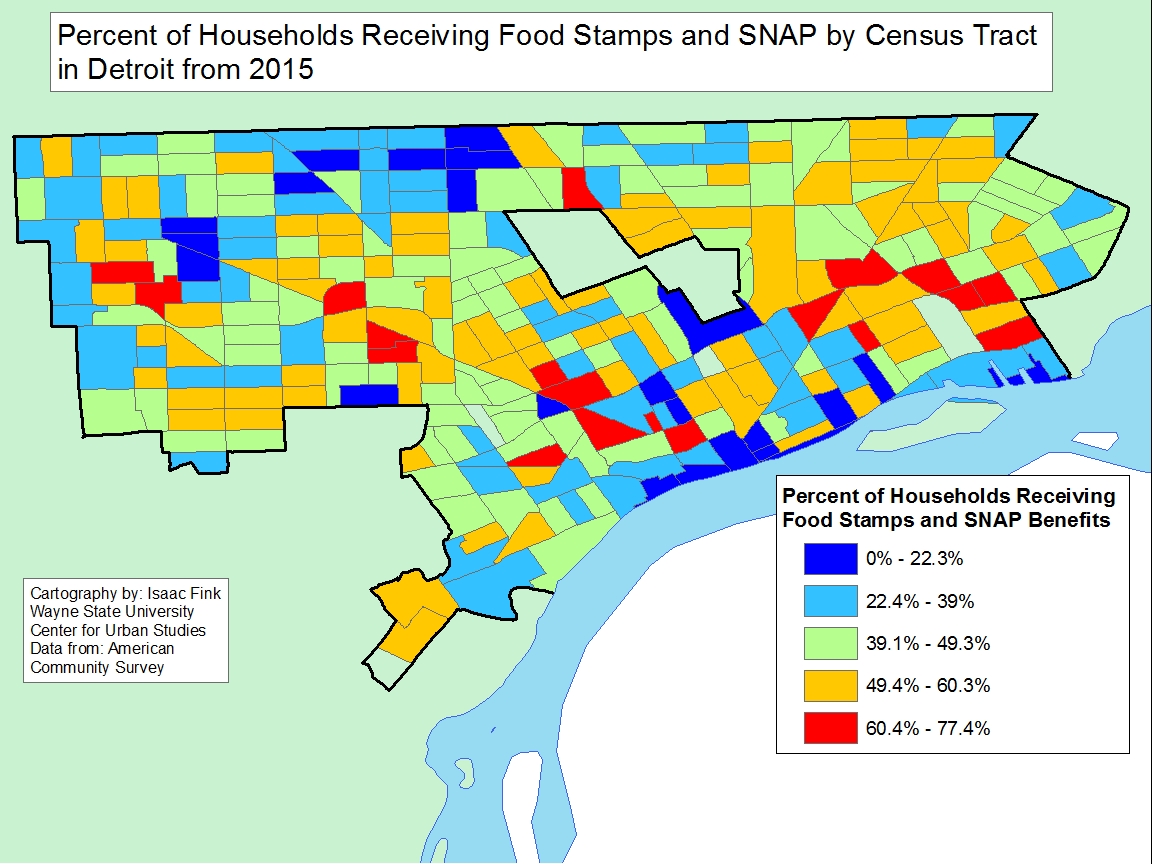
In examining Census data from 2015 we see that households throughout Detroit receive various forms of public assistance, in addition to incomes such as retirement, social security, and/or supplemental social security. The data presented in this post shows that, often, Census tracts with a higher percentage of households that received a retirement income had lower percentages of households that received public cash assistance and/or food stamps.
When examining the retirement income map the data shows that the Census tracts with the highest percentage of households that received retirement income were in the northern and western portions of the City. In addition, there was a handful of Census tracts east of Woodward Avenue with upwards of 34 percent of households earning a retirement income. Conversely, there were more than 80 Census tracts, primarily located southwest of Highland Park and Hamtramck, where less than 17 percent of the households receive a retirement income.
There were 29 Census tracts in Detroit where 44.9 percent or more of households relied on Social Security as part of their income and, on the opposite side of the spectrum there were about 40 Census tracts where 22.9 percent of those households, or less, relied on Social Security as part of their income. There was often an overlap in Census tracts with the highest percentages of households receiving retirement income and the highest share of households on on Social Security. But, there were differences across these maps as well. For example, many parts of Southwest and Midtown had both large percentages of residents receiving both retirement income and Social Security.
There was less of an overlap on Census tracts with the highest percentage of households receiving Social Security and tracts where many residents received Supplement Social Security benefits. In order to be eligible for Supplemental Social Security an individual must be: age 65 or older, blind or disabled and have a limited income and resources. Additionally, there was an overall higher percentage of households receiving Social Security benefits than Supplemental Social Security benefits. The Census tract with the highest percentage of households receiving Supplemental Social Security had 36.2 percent of households receiving Supplemental Social Security, while the highest tract for Social Security was 54.8.
The areas in which there was the overlap for the highest percentages of households receiving a certain income or benefit was in the Census tracts where for households receiving public cash assistance and food stamps. For example, there was a cluster of Census tracts along and to the east of Gratiot where up to 20.7 percent of households received cash assistance and up to 77.4 percent of households received food stamps. The data indicate that in 19 tracts between 60.4 and 77.4 percent of the households receive food stamps, and in over 80 tracts between 49.4 and 60.3 percent of residents receive food stamps. To be eligible for food stamps a family of four cannot earn more than $31,240 a year. In order to be eligible for public cash assistance an individual must have a child, have under $3,000 in cash assets and under $25,000 in property assets. The thresholds that households must meet to receive both types of these forms of government assistance, showcases how, particularly in the red colored Census tracts, incomes are among the lowest.
Overall, this post highlights how households in the City of Detroit rely on various forms of benefits and incomes. Clearly there are many retired households living on either retirement income or social security. These households are often, though not always in the same general neighborhoods. People that rely on food stamps and public assistance sometimes overlap with these neighborhoods, but they often concentrate in other areas. There are also areas—often including Downtown, Midtown, East Jefferson and the far west neighborhoods–where far fewer households rely on any form of retirement income or public benefits.
