Economic Indicators: Industrial Areas Seeing Increase in Leasing

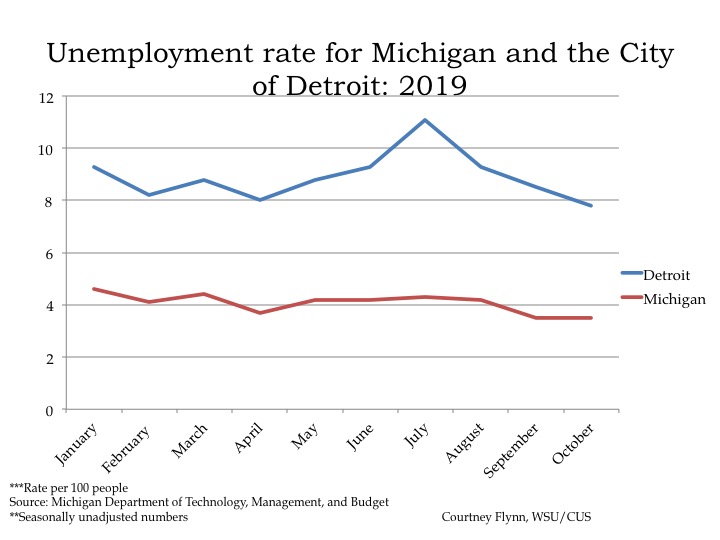
In October of 2019 the unemployment rate for the State of Michigan was 3.5, the same as it was for the month of September, according to the most recent data provided by the Michigan Department of  Technology, Management and Budget. The State unemployment rate for October of 2018 was only slightly higher than it was this year in October, 3.7.

In October of 2019 Detroit’s unemployment rate was 7.8 percent.  That Detroit unemployment rate was 0.7 points lower in October of 2019 from the previous month. Also, the October 2019 unemployment rate for Detroit was 1.5 points lower from the previous year. In October of 2018 it was 9.3 percent.

The chart above displays the unemployment rates for each of the seven counties in Southeastern Michigan for October of 2018 and 2019. In October of 2019 Wayne County had the highest unemployment rate at 4.5. Washtenaw County had the lowest unemployment rate at 2.5.

Between October of 2018 and 2019 each county in the region had a lower unemployment rate in 2019 than the previous year; the county with the largest decrease was Macomb County. In October of 2018 the unemployment rate in Macomb County was 4.1 and in October of 2019 it decreased to 3. Also, Macomb, Livingston, Monroe and Washtenaw counties all had unemployment rates at 3 percent or lower while St. Clair and Wayne counties had unemployment rates at 4.1 and 4.5, respectively.

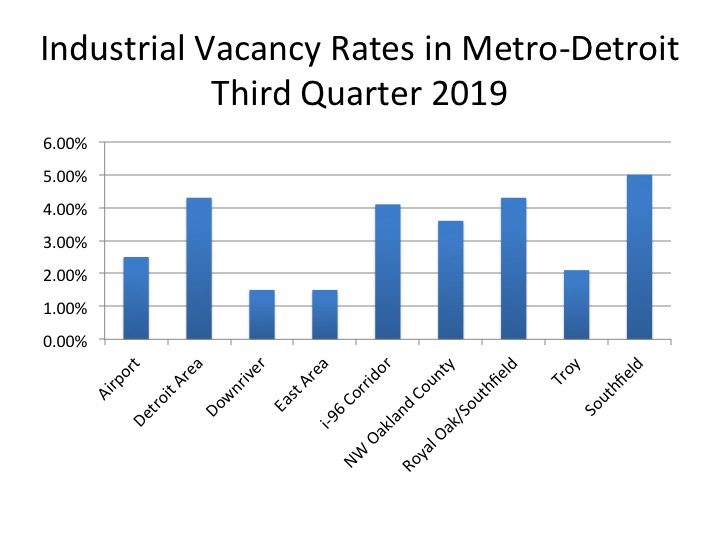
The availability of industrial spaces is another aspect of an area’s financial health and below is information from the quarterly reports of Cushman and Wakefield, a global real estate firm, which produces information related to Metro-Detroit. According to the company, leasing of industrial spaces in the third quarter of 2019 is up from the second quarter, with the Airport area having the strongest increase by landing companies such as DSV and Crane World Wide Logistics with their lease renewals. Additionally, the overall vacancy rate in the Metro-Detroit area is at 2.9 percent, and as shown in the first chart below the Downriver and East side areas have the lowest vacancy rates at 1.5 percent. The Southfield area has the highest vacancy rate at 5 percent.

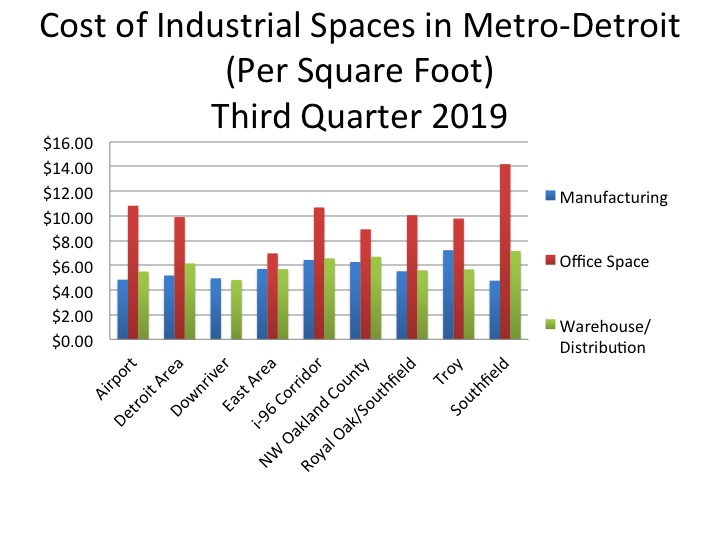
The second chart below shows the average cost of industrial spaces in the region per square foot. There are three different types of industrial space as defined by Cushman and Wakefield and those are: manufacturing, office space and warehouse/distribution spaces. As the chart shows, office space has the highest market value, with the Southfield area having the highest cost at $14.19 per square feet. In nearly all the areas warehouse/distribution spaces has the second highest cost with Southfield again having the highest market rate at $7.15 per square foot. In the Downriver and Troy areas though manufacturing spaces have a higher market rate than the warehouse space. In Downriver, manufacturing spaces average $4.94 per square foot and warehouse spaces average $4.80 per square foot; in Troy manufacturing spaces average $7.22 per square foot and $5.60 per square foot for warehouse spaces. Troy also has the highest market value for manufacturing spaces in the region.

According to Cushman and Wakefield, there is an expectation that utilization of industrial spaces will continue to increase in 2020 meaning a continuation of low vacancy rates.
The above chart shows the Standard and Poor’s Case-Shiller Home Price Index for the Detroit Metropolitan Statistical Area. The index includes the price for homes that have sold but does not include the price of new home construction, condos, or homes that have been remodeled.
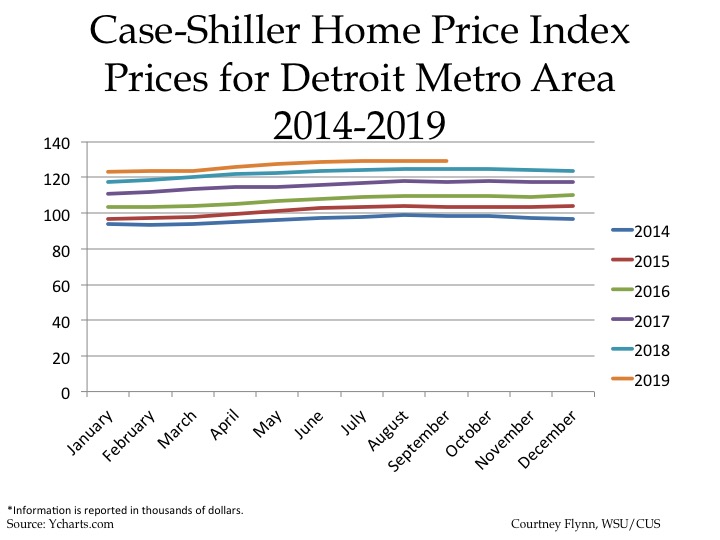
According to the index, the average price of single-family dwellings sold in Metro Detroit was $129,250 in September 2019; this was $800 lower than the average family dwelling price in August. The September 2019 price was an increase of $4,460 from September of 2018 and an increase of $11,650 from September of 2017, an increase of $19,470 from September of 2016 and increase of  $25,670 from September of 2015 and, finally, an increase of 
$30,910 from September of 2014.

Fertility Rates in Michigan Continue to Decline

Fertility rates in the United States and in Michigan have been steadily declining. According to the Michigan Department of Health and Human Services, since the year 2000 fertility rates in the U.S. peaked at 69.5 births per 1,000 women of child bearing age in 2007. Since then the rates have continued to fall. Between 2011 and 2016 the fertility rate hovered between 63.2 and 62 before dropping to 60.3 in 2017 and 59.5 births per 1,000 women of child bearing age in 2018. In Michigan, the fertility rate has consistently been lower than that of the U.S., but it too has been on the decline. Since the year 2000 the fertility rate peaked in 2000 at 63 births per 1,000 women of child bearing age. Up until 2009 the fertility rate fluctuated between about 62 and 60.5, then in 2009 the rate dropped to 58.8 births per 1,000 women of child bearing age. Between 2013 and 2016 the fertility rate again increased to about 60 births per 1,000 women of child bearing age  before again dropping to 59.5 in 2017 and 58.5 in 2018. In raw numbers, in 2018 there were 110,293 births in Michigan, the lowest number since 1941.

According to a recent New York Times article, fertility rates tend to decrease with economic downturns. This happened with the Great Depression and then again with the Great Recession in 2008. However, while fertility rates rebounded following the Great Depression this has yet to happen following the recent recession. Stable fertility rates are important as they help ensure there will be a healthy workforce to keep the economy moving and to care for the elderly populations.

Below is a chart detailing the fertility rates for all of the seven counties in Southeastern Michigan in 2018, along with the rate for the State of Michigan and the City of Detroit. The only county to have a higher fertility rate than the State was Wayne County. In 2018 the fertility rate for Michigan was 58.5 births per 1,000 women between the ages of 15 and 44 and for Wayne County the fertility rate was 66.2; the City of Detroit had a fertility rate of 70.2. Washtenaw County had the lowest fertility rate at 40.5 births per 1,000 women between the ages of 15 and 44. One possibility for the low fertility rate in Washtenaw County is the fact that the county is home to the University of Michigan. With such a high college population, where the typical age is concentrated in the lower 20s, it is quite possible that the fact that fewer women in their 20s are having children contributed to the county’s low fertility rate.

In addition to publishing fertility rate data by county, the Michigan Department of Health and Human Services also publishes it by race. Below is the data for the year 2018 by county for white women. The fertility rate for white women in Michigan in 2018 was 55.2 births per 1,000 women between the ages of 15 and 44, and Wayne and St. Clair counties were the only two in the region with higher fertility rates. Wayne County had a fertility rate of 58.7 in 2018 and in St. Clair County the fertility rate for white women between the ages of 15 and 44 was 57.8. White women in the City of Detroit also had a fertility rate higher than the state; Detroit’s fertility rate per 1,000 white women between the ages of 15 and 44 was 57.9.

The fertility rate for black women in 2018 in Michigan was 67.6 births per 1,000 women between the ages of 15 and 44. Again, there was a higher fertility rate for black women in Wayne and St. Clair counties than at the state level; those rates were 71 and 70.7, respectively. The City of Detroit also had a higher fertility rate than the state at 69.2. A fertility rate was not available for Livingston County.

It should also be noted that the fertility rate for black women in the State of Michigan and across the counties in Southeastern Michigan was higher than the fertility rates for white women in the region and at the state level.

As fertility rates decline it is also important to understand that there seems to be a shift in the age women are choosing to have children. According to the same New York Times article, at the national level, fertility rates have declined the most among teenage women; the fertility rate for teenagers has declined 70 percent since 2001. Women in their 20s are also having fewer children, despite this age group traditionally having the highest fertility rate. In 2016 it was women in their early 30s who had the highest fertility rate. By 2018, the only age group that experienced an increase in fertility rates was women in their late 30s and early 40s.  Also, according to the article, more than half the women in the U.S. who had children in their 30s had a college degree; this was more than the amount of women in their 20s with children and college degrees. There is a belief that women are waiting longer to have children to ensure their financial stability, career trajectory and that they have enough resources to provide for their children.

DIA Seeks Millage Renewal

Throughout the Metro-Detroit region there are multiple millages being levied to support regional entities, most of which were born out of Detroit’s bankruptcy and the economic downturn. When some of these millages were originally levied, the initial intentions expressed to the public were that they were for only a specific amount of time, such as with the Detroit Institute of Authority (DIA). However, the Detroit Zoo for example passed a 0.1 millage in 2008, and then came back to voters in 2016, two years before the 10 year millage was set to expire, and asked for a renewal. The 0.1 millage renewal passed, and this public support for the Detroit Zoo continues to be levied; the cost of the Zoo millage for a home valued at $100,000 ($50,000 taxable value), is $5. We have also seen the Suburban Mobility Authority for Regional Transportation (SMART) continuously seek millage renewals and increases, the most recent being a 1 mill renewal for four years that was approved by voters in 2018.

Now, as the end of 2019 nears, the Detroit Institute of Arts (DIA) recently announced it is up against the clock to put millage renewal language on the March 2020 ballot. The 10-year millage was originally approved by voters in Macomb, Oakland and Wayne counties in 2012, and it was stated at that time that it was a one time request, allowing the museum time to build up its endowment for long-term financial support of operations, according to news articles of 2012 and present. Now seven years into the one-time millage, DIA officials have announced a 10-year renewal is necessary to continue offering the services the public has come to expect. In order to do this the three Art Authorities in Macomb, Oakland and Wayne counties (which were born out of articles of incorporation crafted and approved by the corresponding Board of Commissioners) must approve the ballot language. Just last week the Wayne County Art Authority approved putting the 0.2 mill renewal on the ballot, Oakland County is expected to debate the potential millage renewal later this month and the Macomb Art Authority will do so on Dec. 3.

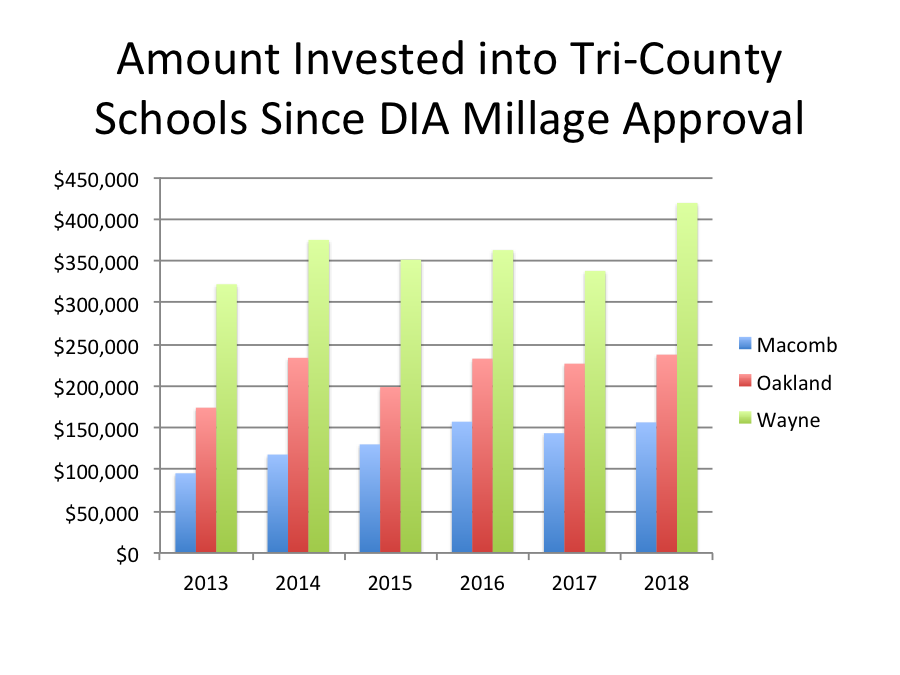
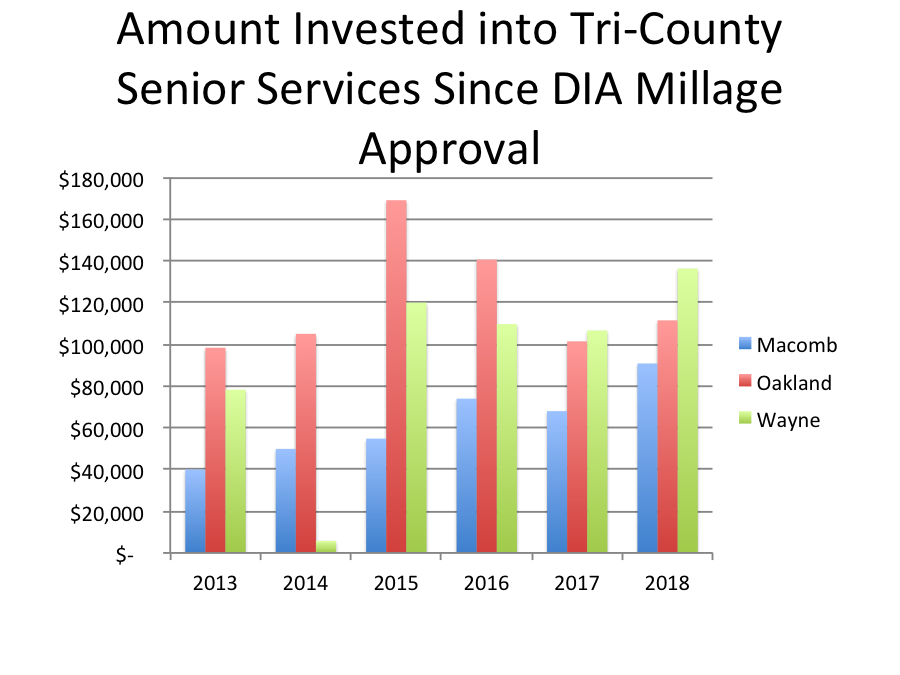
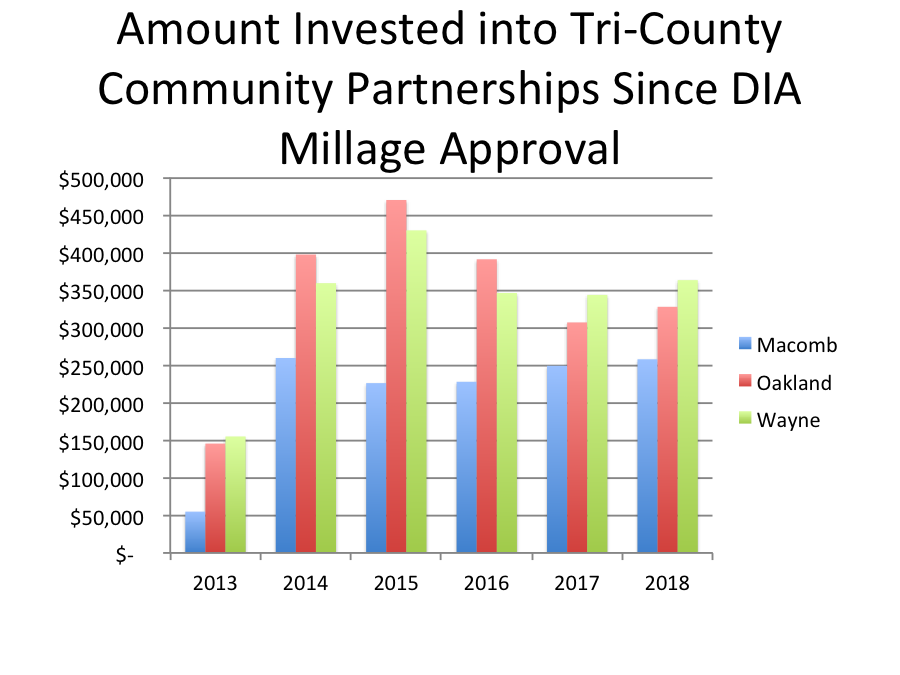
As discussions again begin to ramp up over whether another regional millage renewal is necessary, it is important to consider what benefits the current tax dollars levied for the DIA may have created the region. In addition to free general admission for Macomb, Oakland and Wayne residents additional benefits can be covered under three main areas: investment in schools (free field trips with bussing, teacher professional development, and curriculum development), investment in the senior population (free group visits for older adults on Thursdays with free transportation and special programs), and investment in community partnerships (Inside/Out program, partnerships with area non-profits).

The first chart below shows the amount of money invested into the schools in the region by county and by year. In total, between 2013 and 2018 392,231 students in the tri-county region have had access to the school programs now offered by the DIA, with that investment totaling about $4.3 million. Of the three counties the most amount of money has been invested into the Wayne County schools, with that total being about $2.2 million. Wayne County has the highest population of the three counties.  It should also be noted though that investment into these various programs in the counties requires participation from the residents.

When looking at the amount invested in the senior programs since 2013 that total is about $1.7 million with the total number of seniors being reached by these special programs being 32,422. The largest investment with the senior programs since the millage has been in Oakland County with a total of  $725,362 being invested into the senior population.

Finally, the area where the most investment has been made is in the community partnerships area. Between 2013 and 2018 about $5.3 million was invested. The largest investment was in Oakland County at about $2 million. In Wayne County $1.9 million was invested, and in Macomb County about $1.3 million was invested.

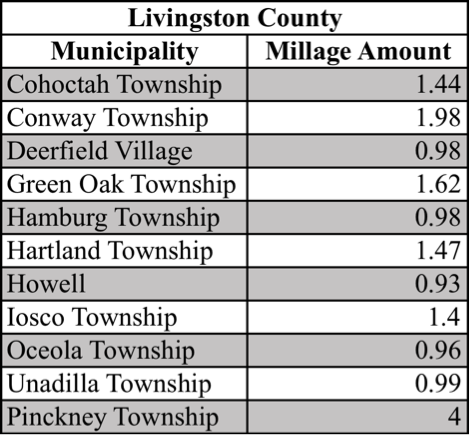
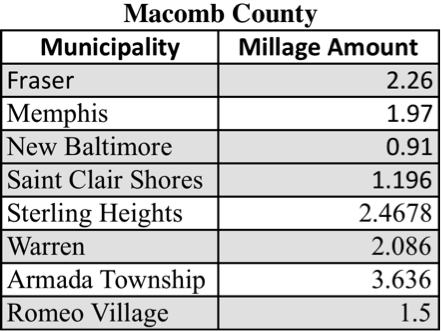
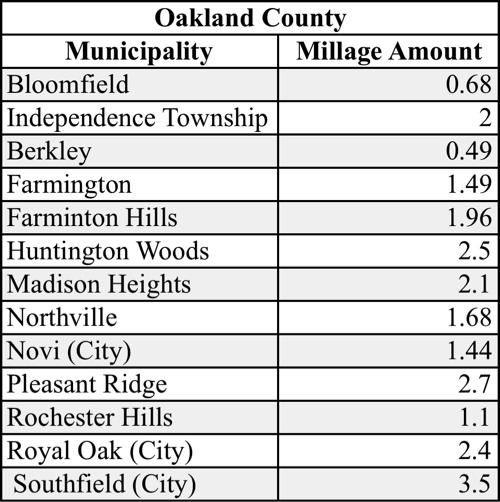
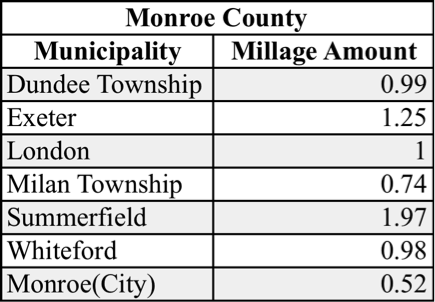
It appears a new trend is emerging where millages will be needed to support regional entities and interests (the Zoo, the DIA, transit) along with day-to-day services in some cities and counties. For example, in Detroit there are currently discussions about a March ballot proposal to levy additional funds to move blight removal in the city along at a much faster pace. In Macomb County residents will asked to decide if they want to pay additional taxes in order to build a new jail. So it may be even more important for taxpayers to understand what additional taxes are appearing on their tax bill and what their priorities are. In the coming weeks we will look at the additional taxes residents pay in certain communities throughout the region to shed further light on what tax bills are now looking like.

Production of Solid Waste Rises in Michigan

The landfills in Michigan not only hold solid waste produced from Michigan residents, but also from other states and Canada. The first chart below shows how much solid waste has been disposed of in Michigan landfills between 2008 and 2019, total. Between 2009 and 2012 the amount of waste being disposed decreased from about 49 million cubic yards in 2009 to about 44 million cubic yards in 2012. From 2013 to 2018 though the amount of waste being disposed continuously increased. In 2013 there was about 44.5 million yards of cubic waste disposed of into Michigan landfills and by 2018 that number was about 52.5 million cubic yards.

When examining the three different sources that dispose of solid waste into Michigan landfills the data shows that waste from Canada had the largest decrease between 2009 and 2012, according to the Michigan Department of Environmental Quality. In 2009 9 million cubic yards were disposed of into Michigan landfills and 2012 that number was 6.5 cubic yards.  Between 2013 and 2018 though those numbers increased from about 7.5 million cubic yards to 9.5 cubic yards. For the amount of solid waste disposed of in Michigan from instate sources that number rose from about 35 million cubic yards in 2009 to about 40 million cubic yards. For solid waste disposal from other states that amount disposed of never increased above 2.9 million cubic yards between 2009 and 2018.

Overall, the amount of waste generated in Michigan continues to increase while import rates are decreasing, according to the Michigan Department of Environmental Quality.

The chart below shows the total waste disposed in Michigan landfills from each county in Southeastern Michigan. This chart does not necessarily reflect how much waste is disposed in each county, but rather how much waste comes from each county. Wayne County had the highest amount of waste disposal at more than 11 million cubic yards in 2018; this amount was more than twice the amount of any other county in the region. Oakland County had the second highest amount of waste disposed in 2018 at about 4.3 million cubic yards. Livingston County had the lowest amount of waste disposed at about 380,000 cubic yards.

Below is a list of the landfills in Southeastern Michigan and the amount and type of waste disposed in them in 2018. Municipal and Commercial Waste (MCW) was the most common type of waste disposed of in Southeastern Michigan landfills, followed by Industrial Waste (IW).

In Southeastern Michigan there are 13 different landfills, two of which only accept Industrial Waste. The two landfills that only accept Industrial Waste are Detroit Edison Ash Disposal in St. Clair County and the DTE Monroe Power Plant in Monroe County.

Pine Tree Acres, which is a landfill operated by Waste Management in Lenox Township (Macomb County) had the largest amount of waste disposed there in 2018 at nearly 5.1 million cubic yards. Carleton Farms Landfill in Sumpter Township (Wayne County) had the second largest amount of waste disposed there at about 4 million cubic yards.

The City of Livonia accepted the least amount of waste in 2018. According to the Department of Environmental Quality the City of Livonia landfill received 2,700 cubic yards of Municipal and Commercial Waste and 1.8 yards of Industrial Waste.

Overall this post was intended to highlight where waste in Michigan, and the region comes from, what regional counties are producing the most amount of solid waste and how the production of waste in the state continues to rise. Not only does this post shed light on the production of solid waste but it should also be a conversation starter for the need of increased recycling rates. According to the Environmental Protection Agency the recycling rate in Michigan is 15 percent; the national average is 35 percent. While bottle returns in Michigan are at about a 90 percent redemption rate, according to a 2018 Bridge Magazine article, other recyclable items are not returned at nearly such a high rate. There needs to be a mindset change in the State of Michigan, and digging deeper into the data could help facilitate successful public information campaigns.

Unfortunately, data on recycling is not nearly as detailed as the information the state produces on solid waste. For example, information on what communities offer curbside recycling is not readily available, and the last measurement report on recycling in the state was published in 2016, with data from 2014.

There needs to be more information on recycling in Michigan, and the amount of solid waste disposed of in Michigan’s landfills needs to be reduced. Although waste from other states and countries is imported to Michigan landfills, an action that should also be halted, it is the rate at which solid waste in Michigan is being produced and disposed of that is increasing the greatest problem. We need to see a substantial reduction in solid waste disposal, and a parallel increase increase in recycling.  

Breast Cancer in Southeastern Michigan

The month of October is Breast Awareness Month and in 2019, according to the Susan G. Komen Foundation, it is estimated that there will be 268,600 new cases of invasive breast cancer, nationally. In addition, the foundation estimates that there will about 42,000 deaths from breast cancer in 2019. Breast cancer affects both men and women, but occurs at a much higher rate in women. According to the Susan G. Komen Foundation, there is an estimated 129.8 new cases of invasive breast per 100,000 women each year and in men that number is 1.2 cases per 100,000 men. Additionally, the American Cancer Society estimates there will be more diagnoses of breast cancer in 2019 (9,310) than lung, colon, prostate, melanoma or bladder cancer. However, the American Cancer Society also estimates that lung, colon and pancreatic cancer have a higher mortality rate than female breast cancer.

The data shown in the maps below has been provided by the Michigan Department of Community Health and Services and was last updated in 2017. Additionally, the data focuses on women.  According to the Michigan Department of Health and Human Services, breast cancer is the most common newly diagnosed cancer among women in Michigan. In 2017 there were about 8,160 new cases of invasive breast cancer in women in Michigan.

In 2017 St. Clair County had the highest rate of women with invasive breast cancer at 27.3 per 100,000 females, according to the Michigan Department of Community Health and Services. Wayne County had the second highest rate at 22 per 100,000 females and Oakland County had the lowest rate at 17.8 at 100,000 females. At the state level the rate for women with breast cancer was 19.2 in 2017. The only county below this rate in Southeastern Michigan was Oakland County.

Although not all women with breast cancer die from the disease, there are hundreds of deaths from the disease a year. In 2017 Wayne County had the highest number of deaths at 247 followed by Oakland County at 153 and Macomb County at 126. Regionally, Livingston County had the lowest number of deaths associated with invasive breast cancer at 18. These numbers are, generally, consistent with populations across these counties. In 2017 there was a total of 1,308 deaths associated with breast cancer across Michigan.

While breast cancer rates at the county level in Southeastern Michigan are are lower than those at the national level (129.8 cases per 100,000 women), it still causes significant number of deaths per year. Since the early 2000s the number of breast cancer deaths has declined, in large part due to increased mammogram screening. This month multiple health care organizations, such as Henry Ford, Beaumont and McLaren, are offering free mammograms to raise awareness and increase the chances of early detection. The risk of breast cancer increases with age, so as individuals grow older-particularly women- annual and regular testing becomes more and more important.

Prison Most Common Sentence for Felony Assaults

As part of the annual Michigan Department of Corrections report assaultive felony offensives are also examined to better understand what percentage of the  offenders are sentenced to either prison, jail, probation, community service or another combination. According to the data, prison sentences tended to be the most common. Monroe County had the highest percentage of felony assault offenders sentenced to prion at 39.6 percent. Wayne County had the second highest sentencing rate at 36.6 percent and Macomb County had the lowest rate at 27.5 percent.

For the jail category, St. Clair County had the highest sentencing rate for felony assault offenders at 38.8 percent; this was 10 percent higher than those in St. Clair County who were sentenced to prison for felony assault charges. Oakland County had the second highest at 23.3 percent. Wayne County had the lowest percentage of felony assault offenders sentenced to jail at 6 percent; the county with the second lowest sentencing rate was Monroe County at 11.7 percent.  

For a sentencing combination of jail and probation, Monroe County had the highest sentencing rate for felony assault offenders at 48.1 percent; Livingston County had the second highest rate at 44 percent. Wayne County was the only county in the region to have a jail and probation combination sentencing rate below 20 percent. According to the data, 15.1 percent of felony assault offenders in Wayne County were sentenced to a jail/probation combination.

Livingston, Monroe, Oakland and St. Clair counties all sentenced less than 5 percent of felony assault offenders to probation, with Monroe County having the lowest sentencing rate at 0.6 percent. Conversely, Wayne County had the highest probation sentencing rate at 42.3 percent, a trend we’ve seen throughout this series. Wayne County’s probation sentencing rate was nearly 20 percentage points higher than the county with the second highest rate (Washtenaw County had a rate at 24 percent).

No county in the region sentenced more than 2 percent of the felony assault offender population to community service, restitution, fines and/or costs.

Prison appears to be the most common sentencing type for felony assault offenders, except for Wayne County where nearly half the felony assault offender population was sentenced to probation.  

Jail, Probation Combination Most Common Sentence for Felony Drug Offenders

When examining only felony drug offenders as part of the 2017 Michigan Department of Corrections annual report, St. Clair County had highest percentage of individuals who were sentenced to prison at 19.5 percent. Monroe and Oakland counties were the only other two counties regionally to have more than 10 percent of felony drug offenders sentenced to prison in 2017. Monroe County had 13 percent of felony drug offenders sentenced to prison and Oakland County had 12 percent. Macomb County had the lowest percentage of felony drug offenders sentenced to prison at 3.6 percent. In Wayne County 5.7 percent of felony drug offenders were sentenced to prison.

For the jail category, St. Clair County again had the highest sentencing rate for felony drug offenders at 40.1 percent, with Washtenaw County having the second highest at 31.4 percent. Macomb and Oakland counties also had more than 20 percent of felony drug offenders sentenced to jail in 2017. Wayne County had the lowest percentage of offenders sentenced to jail at 14.6 percent. For the jail/probation category Wayne County also had the lowest percentage of felony drug offenders sentenced at 16 percent; Washtenaw County had the second lowest percentage of offenders sentenced at 31.4 percent. In contrast, Monroe County had the highest percentage of felony drug offenders sentenced to jail/probation at 71.9 percent.

Remaining in line with trends we’ve seen from Wayne County thus far in this series, of the felony drug offenders in Wayne County in 2017, 63.5 percent were sentenced to probation. Of all the sentencing options, this was clearly the most highly utilized for felony drug offenders in 2017. Macomb and Washtenaw counties both had 31 percent of its felony drug offenders sentenced to probation in 2017, nearly half of the percentage sentenced in Wayne County. Monroe County had the lowest percentage of felony drug offenders sentenced at 2 percent.

None of the counties in the region sentenced 1 percent or more of the felony drug offender population to community service, restitution, fines and costs.

As the data shows, jail/probation sentences tended to be the most common for felony drug offenders in Southeastern Michigan, with the exception of Wayne County, where just probation was the most common.

Local Road Taxes Help Support Southeastern Michigan Roads

The state of the roads in Michigan are well known to be largely in poor condition, and funding never seems to be at a point to allow for a total overhaul toward long-term improvement. Road funding in Michigan doesn’t come from one dedicated source. Rather, there is federal funding provided by the Federal Highway Administration Highway Trust Fund, state funding provided by state fuel taxes, vehicle registration fees, income taxes, additional appropriations decided on by the Legislature, and local funding provided by general tax revenue and additional road millages. This post shows the communities in Southeastern Michigan that have additional road millages to further improve the roads.

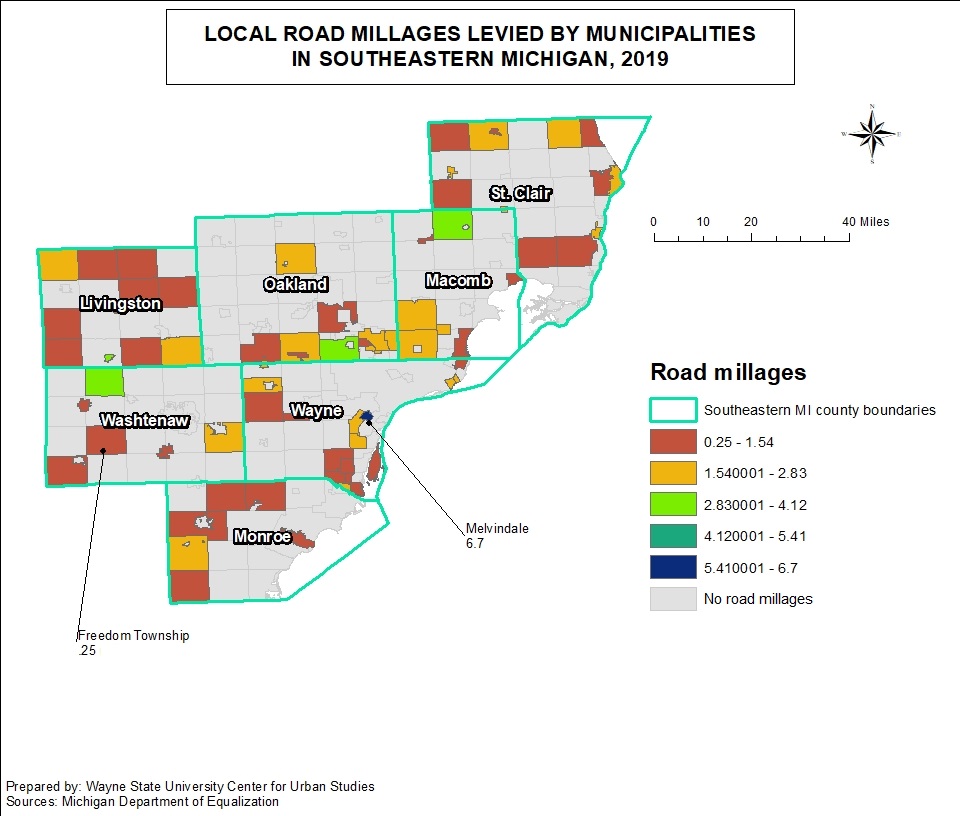
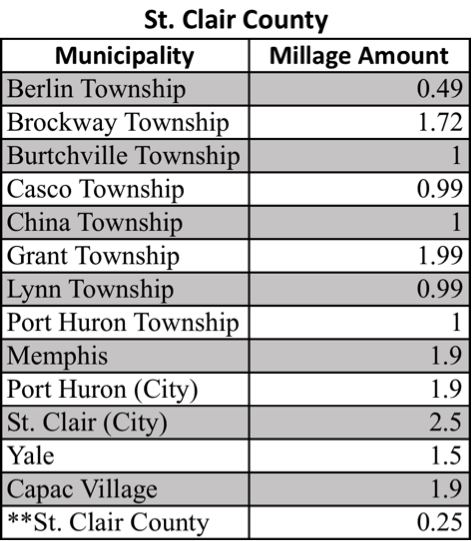
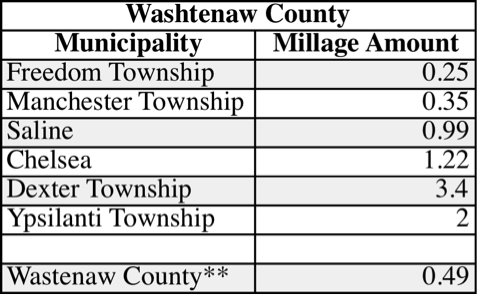
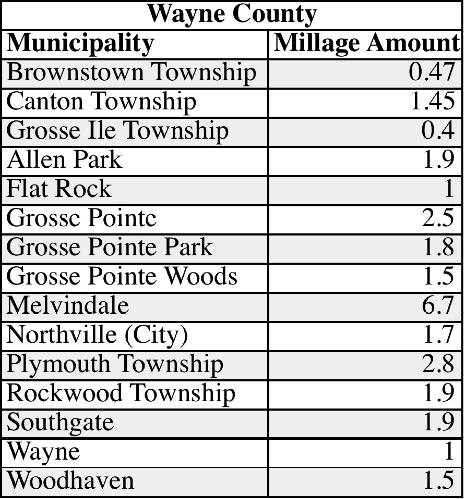
According to the data provided by the Michigan Department of Treasury, there are 73 communities in Southeastern Michigan that levy an additional tax to support road funding, along with two counties. These millages are intended to improve road funding. Of all the communities that levy a road millage, the City of Melvindale has the highest road levy at 6.7 mills, followed by the City of Grosse Pointe and the City of St. Clair which both levy 2.5 mills. The City of Sterling Heights levies the fourth highest amount in the region at 2.47.

Freedom Township and St. Clair County levy the lowest amounts at 0.25 mills each. The only other county in the region to levy a road tax is Washtenaw County which has a 0.49 millage.

Another item to note is that there are more townships levy road taxes than cities and villages. This is likely due to the fact that township roads are controlled by county road departments/commissions, meaning more competition for road dollars.

A mill is a $1 tax per $1,000 of assessed taxable value. For example, a homeowner with a house assessed at $200,000 (true value at $400,000) in a city that levies a 2.5 millage would pay an additional $250 in city taxes. Of course, how much money a community receives in total from a road millage will vary depending on the number of homes in a community along with the average home value of a community.

According to the Mackinac Center for Public Policy there is a strong correlation between improved road conditions and a road millage. According to the Center, 58 percent of roads in a city without a road millage are in poor condition. And, if a city has a road millage, each mill is correlated with a six-point reduction in the percentage of roads in poor condition. This is not necessarily true for villages, where 47 percent of roads in villages without a road millage are in poor condition. This differentiation could be due to the fact that villages typically have less taxable property value, meaning they would need a higher levy to get the dollars needed for more improvement.

Below is a map of communities in Southeastern Michigan that levy a road tax, along with lists to show what communities are making additional investments into their road infrastructure.

PFAS Regulations to Tighten in Michigan

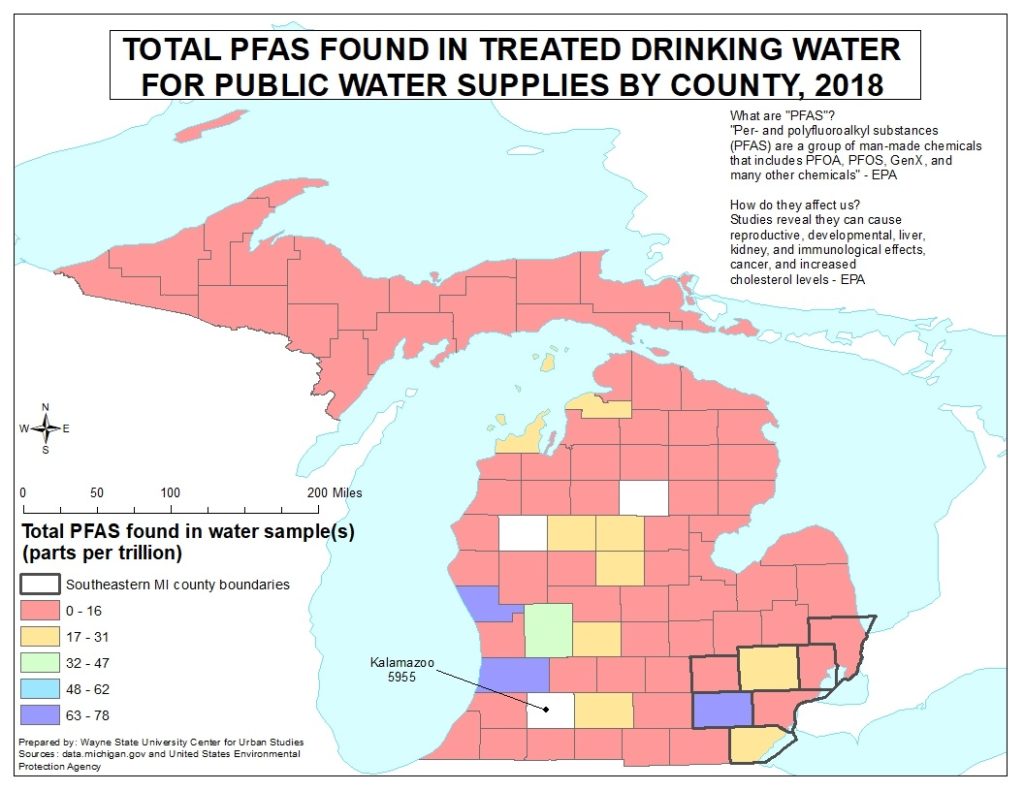
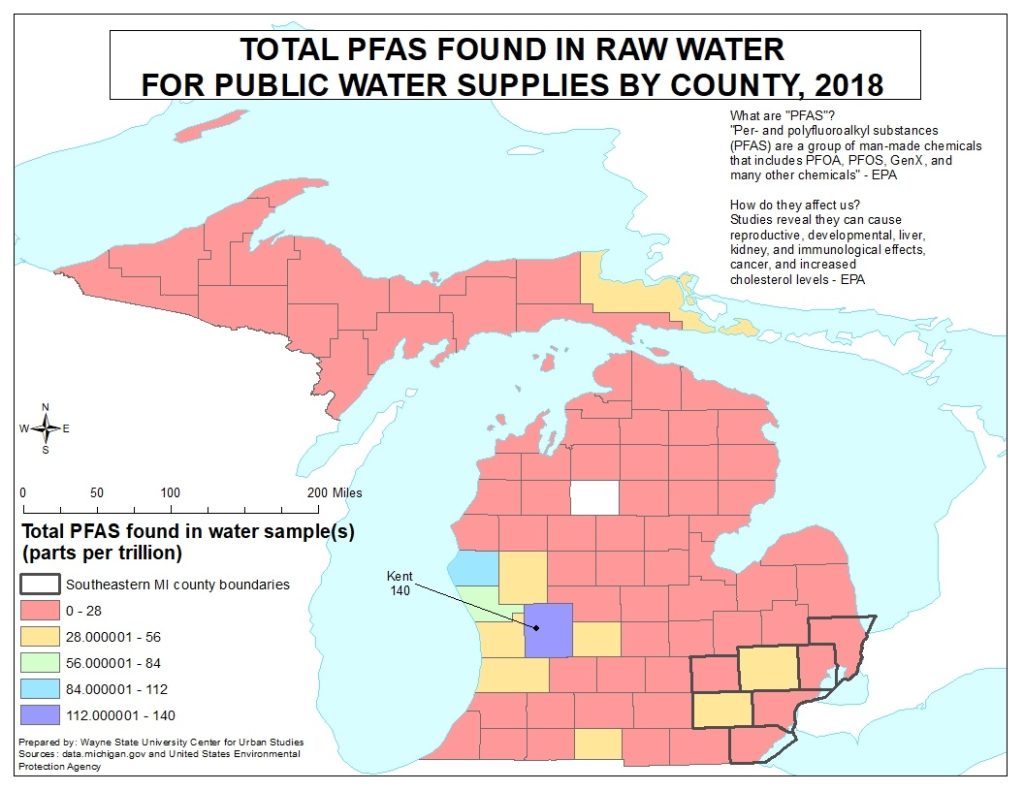
Per-and polyfluoroalkyl substances (PFAS) are synthetic chemicals (including PFOA and PFOS) found in everything from packaging to cookware. These chemicals are causing environmental and potential health problems, especially here in Michigan. To better track how these chemicals are affecting the environment and public health the Michigan PFAS Action Response Team was created to research, identify, recommend and implement actions to improve the PFAS situation in the State. Part of this research includes testing the waterways and the public water supply. The first map below shows the total PFAS found in treated public water samples throughout the State in 2018. Three counties in Michigan (Washtenaw, Muskegon and Allegan counties) had between 63-78 parts per trillion for PFAS tested in the public water supply. According to the Environmental Protection Agency the lifetime recommended advisory limit is 70 parts per trillion. In Kalamazoo County the amount of PFAS is far higher than the EPA’s recommended intake and any amount found in every other Michigan county. According to the State of Michigan, 5,955 parts per trillion of PFAS was found in Kalamazoo County. It is believed much of this contamination is from old paper mills in the area, a plastics company and a landfill; at least 115 wells and other sources for drinking water were tested.

The second map below shows the total PFAS found in raw water for public water supplies. For this measurement Kalamazoo County was in with the majority of Michigan’s 83 counties where 0-28 parts per trillion of PFAS was found. Of all the counties in the state, Kent County had the highest amount of PFAS found at 140 parts per trillion.  With the exception of the amount of PFAS found in Kalamazoo County’s treated drinking supply, in general, the amount of PFAS found in raw water testing samples was higher than those found in treated public water samples.


Overall, the maps above show that several counties in Michigan have high amounts of PFAS found in public drinking supplies, and in some cases above the EPA lifetime recommendation. As more information about PFAS is discovered that state needs to take actions to prevent further contamination of our water resources by implementing stricter standards. Just recently the Michigan PFAS Action Response Team proposed the lowest parts per trillion thresholds in water supplies in the county. These numbers, which vary depending on the specific PFAS, are still in draft form though and will likely not be formally recommended until October, with enforceable numbers being set by spring of 2020. Once formalized the contaminant levels would be enforceable under the Safe Drinking Water Act.

Great Lakes Continue to Rise

Water levels in the Great Lakes continue to rise as the rain continues to fall. According to U.S. Army Corps of Engineers, each of the Great Lakes had higher average water levels in the month of May in 2019 than the prior years. Each lake had water levels that were almost a foot higher than the previous year. Additionally, as of June 21, 2019 water levels throughout the Great Lakes continued to reach above average levels, increasing well beyond the May 2018 and May 2019 averages. Between May 2019 and June 21, 2019 water levels in Lake Superior have increased an additional 3 inches, which is the lowest increase of the five water basins the U.S. Army Corps of Engineers tracks as part of the Great Lakes. Lake Ontario experienced the highest increase between the May 2019 average and the recorded water levels on June 21, 2019; the increase in that time frame was 8 inches. Lake Michigan-Huron has had the second highest increase in the last few weeks at 7 inches.

The charts below further show that as of May, Lake Ontario experienced the highest average increase between May of 2018 and 2019 at about a foot and a half. Lake St. Clair’s average increased the least, but was still up 8.4 inches from the 2018 May average.

Such water levels are a result of above average rainfalls for 2019 and below average evaporation rates. For some perspective, as of June 1, 2019 there had been 1.57 inches of rain during the month, compared to 0.57 inches by the same time in 2018. Additionally, the average temperature for the month of June this year is about 68 degrees when last year the average temperature for June was about 72 degrees.

Weather models predict that cooler temperatures and increased amounts of precipitation will become more of the norm for Michigan, as a result of climate change. Such a long-term shift in the state’s climate not only affects water levels in the Great Lakes, but also farming throughout Michigan. This is a topic we will further explore in an upcoming post.