April 10 Has Highest Number of COVID-19 Deaths in Michigan

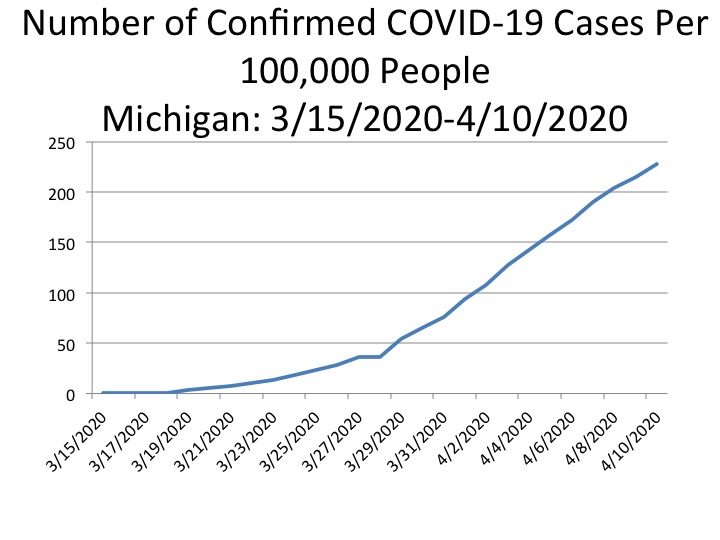
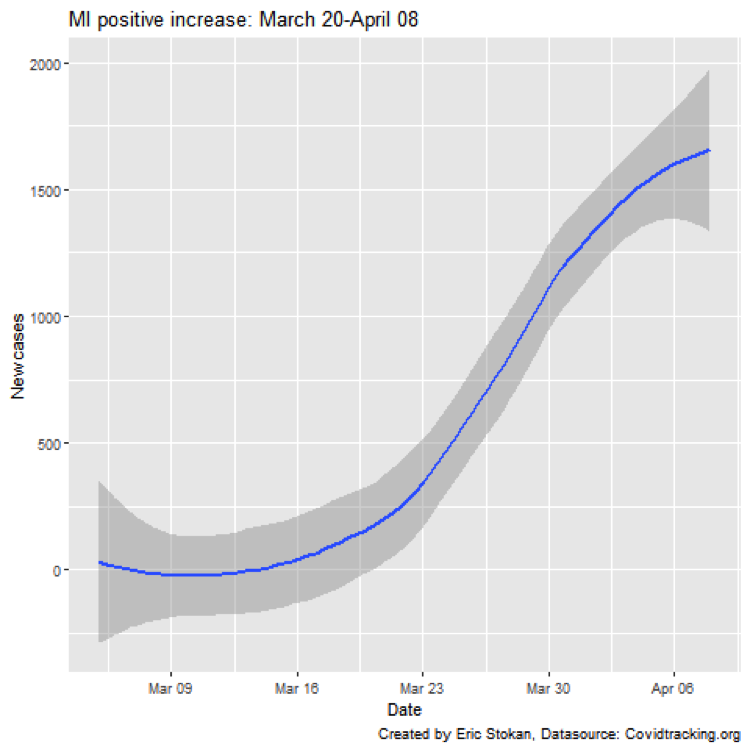
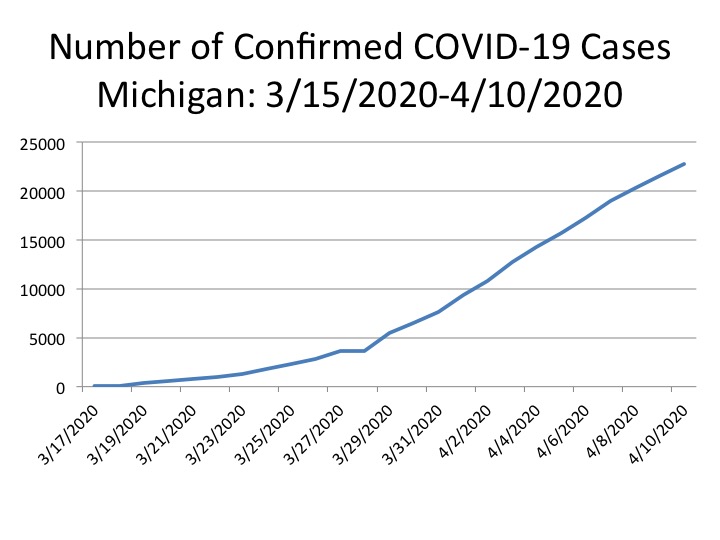
On April 10, 2020 the State of Michigan reported 22,783 COVID-19 confirmed cases, which equates to 228 cases per 100,000 in the State of Michigan. Cases continue to rise both in the State as a whole and throughout the counties. These overall data are reflected in the first two charts. It’s important to note, however, that these data are strongly affected by the lack of testing, which means rates could be much higher.

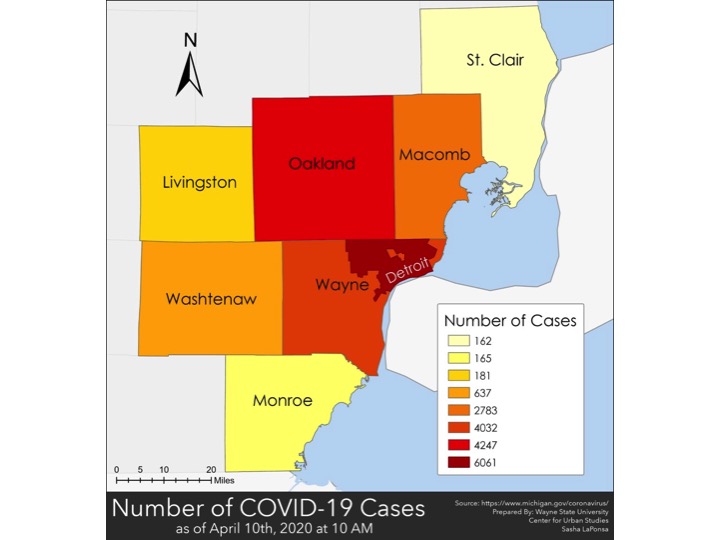
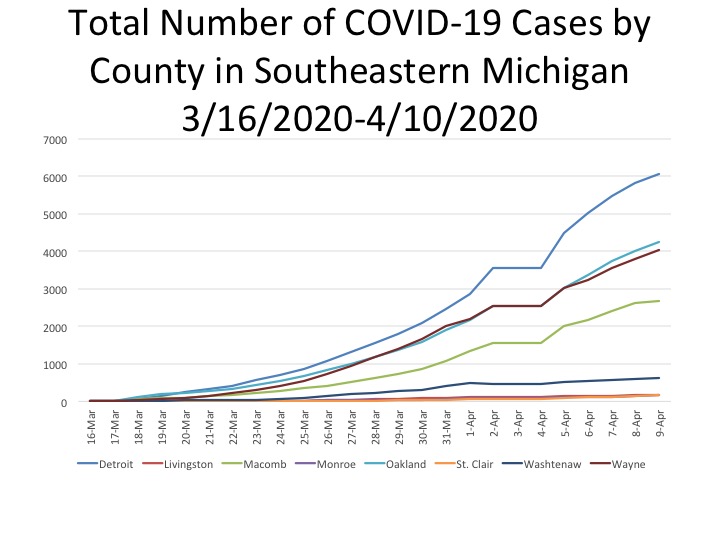
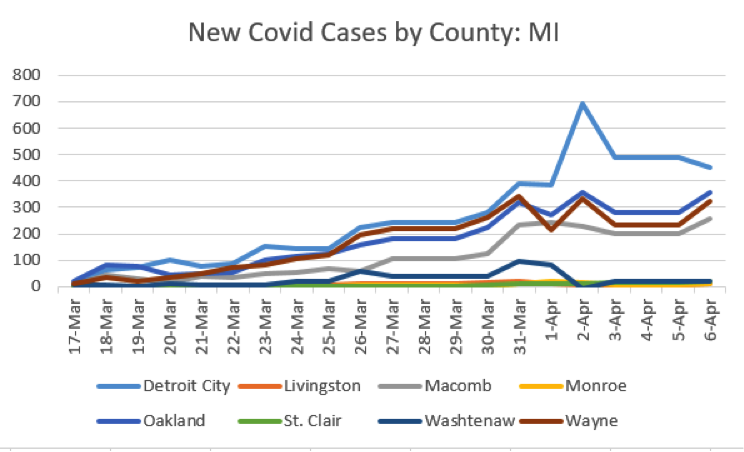
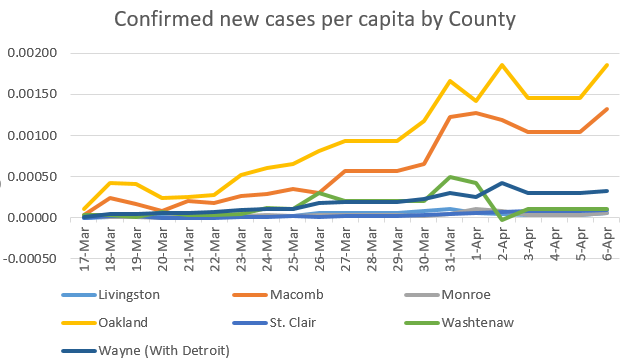
In Southeastern Michigan, and throughout the State, the City of Detroit continues to have the highest number of cases at 6,061 cases as of April 10, according to the Michigan Department of Health and Human Services, which was higher than any number of cases throughout the counties in Southeastern Michigan. Oakland County had the second highest number of total cases at 40,27; this is 1,814 fewer cases than the City of Detroit. Also according to the State, there were 4,032 cases in Wayne County (excluding Detroit numbers) and 2,683 in Macomb County. In total, the number of confirmed cases in Washtenaw, Livingston, Monroe and St. Clair counties combined totaled 1,223, with Washtenaw County accounting for 637 of those cases,  according to the most recent data from the State. These data are represented in the next three charts.

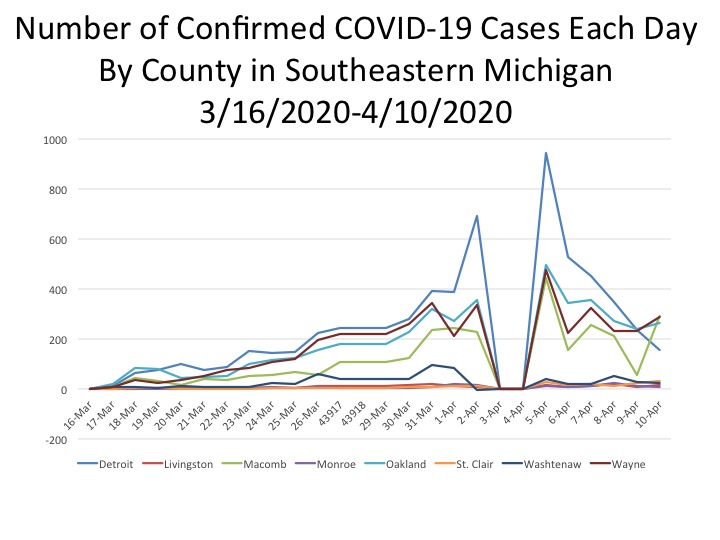
In fifth chart down we show the total number of new cases reported each day at the county level, and for the City of Detroit COVID cases. Please note that these data from the State were likely reported for April 3 was also likely reported on April 4, which is why no change is shown and a “0” for April 4 is shown on the chart. Despite this, April 5 had the highest number of cases reported for the City of Detroit, Wayne (excluding Detroit), Macomb and Oakland counties; 945 case were reported for the City of Detroit that day. Since then, the City of Detroit has experienced a consistent decline in the number of new cases reported each day, while the other Wayne (excluding Detroit) Oakland, Macomb and Washtenaw have experienced small upticks following declines. Again, part of this could be an artifact of the limited testing.

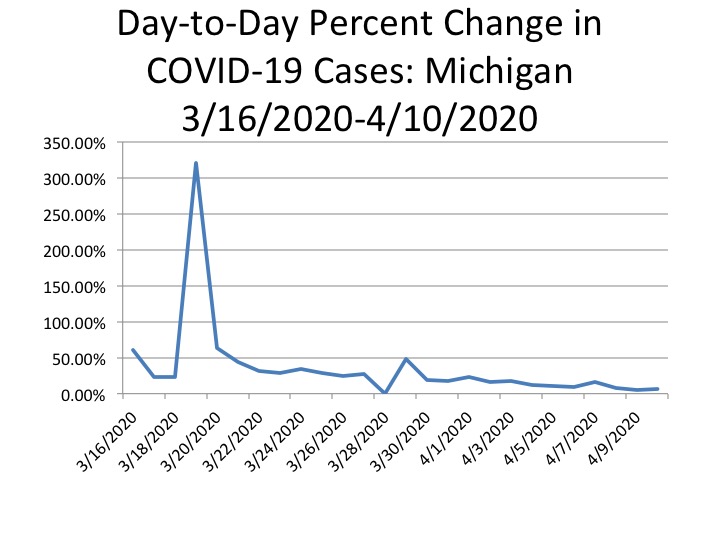
In addition to the raw data of confirmed cases, we also show in the sixth chart the percent change in the number of cases reported day-to-day. The largest percent change thus far reported was on March 19 at 320 percent-this increase was also likely related to an increase in  the number of available tests. Also the 0 percent change on March 28 reflects that the data reported from the day prior did not change; it is unlikely that no new cases were reported that day. On April 10 the percent change from April 9 was 6 percent, a small increase the day’s prior change of 5.23 percent. April 7 was the peak for the day-to-day percent change during this week and that was reported at 16.23 percent.  
The next 6 charts explain the data about deaths. We consider the data on deaths more reliable, given that they are not directly affected by the shortage of tests.

The first chart shows that on April 10 the total of COVID-19 deaths reached 1,281, the highest number of newly reported COVID-19 deaths in the State of Michigan. Percentage changes are reflected in the second chart. There was  a 19.5 percent change from April 9 to the 10th, while the change from April 8th to April 9th was 12.2 percent. The last time the percent change was at 19 percent or higher was on April 2 when it was reported there was a 23 percent change in the number of Covid-19 deaths from the day prior. The third chart below shows the increase in number of deaths by day. The 1,281 total deaths reported for April 10 was 205 deaths higher than what was reported on April 9. On April 9 there were 117 deaths reported by the State for that day, and this number showed a small hope that the deaths were beginning to flatten off. However, Friday’s numbers suggest otherwise.

As shown in the fifth chart below, Detroit reported the highest number of deaths on April 10 at 52, according to the data provided by the Michigan Department of Health and Human Services (the City of Detroit is reporting 54 new deaths for April 10). Wayne County (excluding the City of Detroit) had 53 new deaths on April 10. Oakland and Macomb counties also experienced spikes in new death numbers from the day prior. For Oakland County there were 12 reported deaths on April 9 and 36 on April 10; in Macomb County there were 24 reported deaths on April 9 and 32 on April 10. Also, please note the data from the State was likely not reported for April 3 and April 4, which is why the chart shows such a severe decline; we assume this was an error.

Detroit continues to have the total highest number of COVID-19 deaths in the region, and in the State, according to data from the Michigan Department of Health and Human Services. This is shown in the sixth chart below, which also shows that on April 10 both Oakland and Wayne County (excluding Detroit) had the same number of total deaths, 282.

**Note-the 0 percent change on March 28 reflects that the data reported from the day prior did not change; it is unlikely that no new cases were reported that day.**
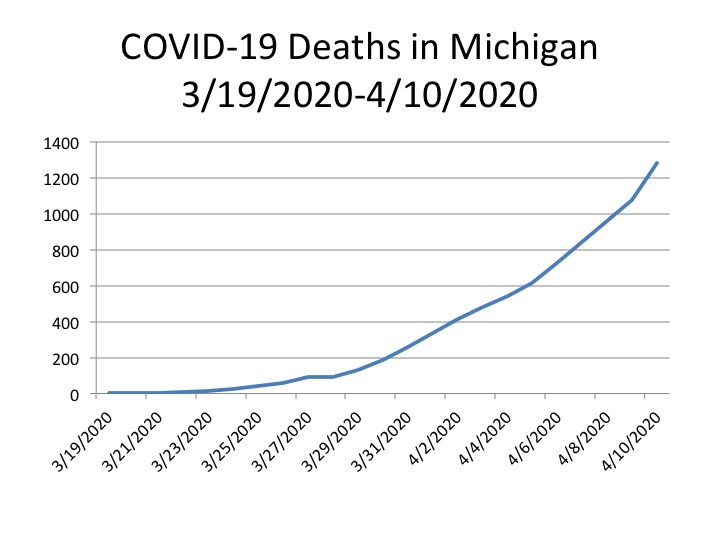
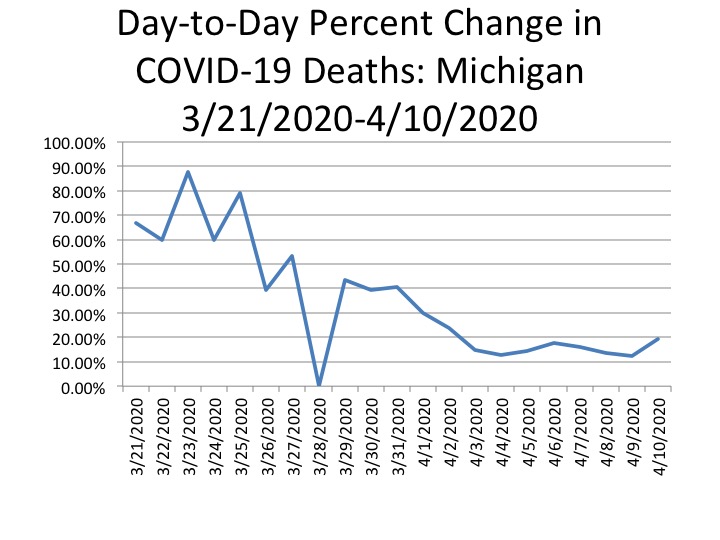
Yesterday we noted that with cautious optimism there was a glimmer of hope that COVID-19 cases may have been leveling off. The April 10 data showed that in some counties-Wayne, Oakland and Macomb-there was an uptick in the number of cases but in Detroit the total number of new cases per day has been on the decline. However, the total number of deaths reported on April 10 showed a different story. April 10 was the day in which the highest number of single day deaths were reported for the State, Detroit, Wayne, Oakland, Macomb an Monroe counties.

Use Cautious Optimism as New COVID Cases Level Off

As we continue to monitor the situation in the Metro-Detroit area we are cautiously optimistic that social distancing is helping reduce the number of new COVID-19 cases.  Like many other areas around the state, country, and world , Metro-Detroit experienced an exponential growth rate in new cases.  According to the New York Times, The Metro-Detroit area is second only to New York City in confirmed cases. Following Gov. Gretchen Whitmer’s Stay at Home Order being issued on March 23, we may be seeing a slowing trend in the number of new cases.  This is positive, but we should be cautious.  There are still many infected people who are unaware they are infected, and could easily spread the virus if the State and city lift restrictions too early or too aggressively.  On April 9 Whitmer extended the Stay at Home Order for the State with the intent to continue to try to flatten the curve. 

First, we see that the number of new cases across the State is beginning to level off.  We utilize Covidtracking.org as the source of collected data- which is reported by the Michigan Department of Health and Human Services (MDHHS) daily.  One note, because on the last two Fridays and Saturdays the numbers were simply repeated we used a linear interpolation (averaging growth between those two days) in the data series to get a clearer sense of what is happening in the state.  We care a lot about the policy responses at the Wayne State Center for Urban Studies and are in the process of analyzing government responses across the 50 states and Washington DC to see how we can help slow, and eventually stop, the spread of the coronavirus.

Despite this potential levelling of new cases in many areas, we need to continue forcefully exercising our social distance to the extent that we can.  This is vitally important, and our actions do not simply impact our probability of contracting the virus it can be the difference between life and death for many populations.  The Jacob France Institute at the University of Baltimore, through the National Neighborhood Indicator’s Partnership, recently estimated that for each additional week we stay home we save 378 lives and if we stayed home for 60 full days we would 2,713. 

We know that the disproportionate number of cases in the State are in the Metro-Detroit area.  It’s worth noting that this metropolitan area experienced many of the first cases and a very rapid rise, and while the region is slowing we are still seeing an uptick in cases in Wayne County (outside of Detroit), Macomb, and Oakland.  We use MDHHS for these data as well. 

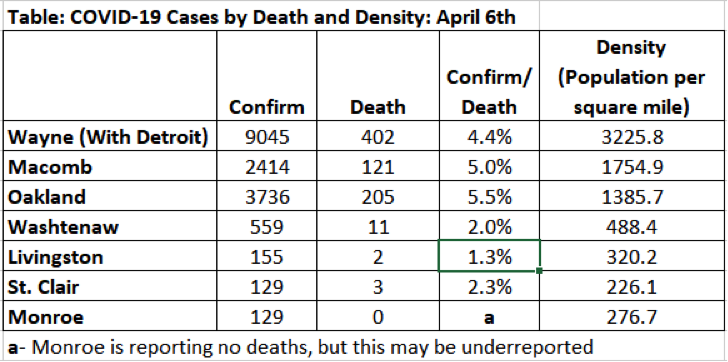
Finally, we know density matters regarding the spread.  In the following table we see that there is a tendency for the number of confirmed cases, death rates and deaths per confirmed case to rise with population density. This may be a function of the health care system becoming too overwhelmed as the total number of cases rises. 

COVID-19 Cases, Death Count Update for Southeastern Michigan, Entire State

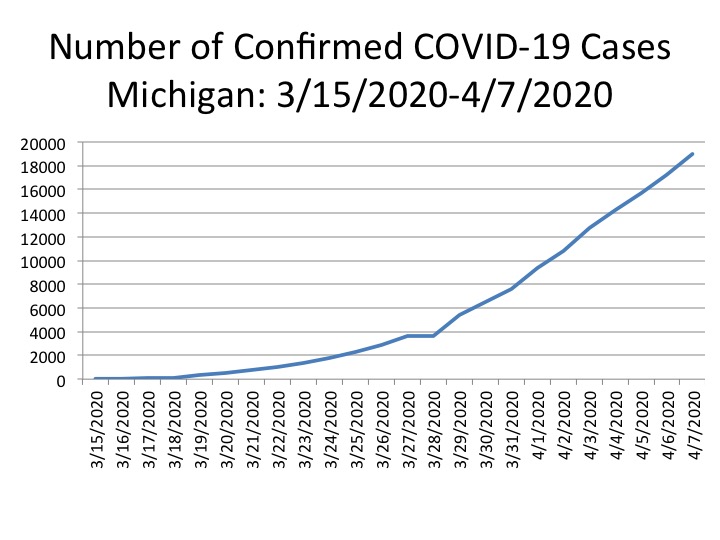
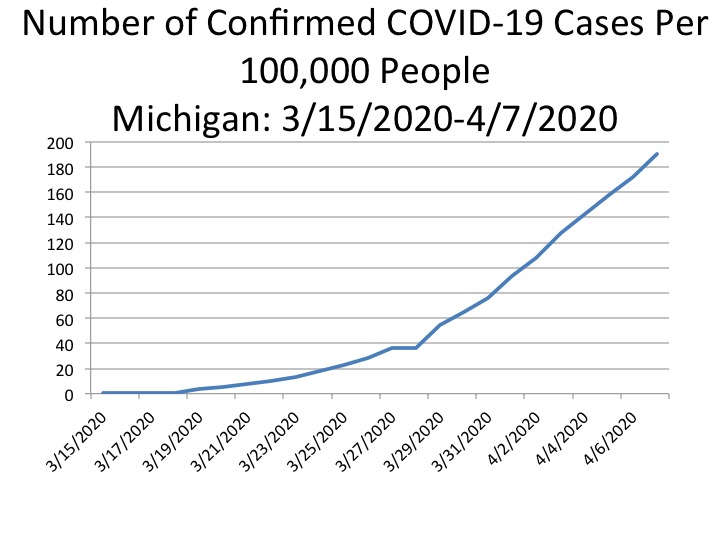
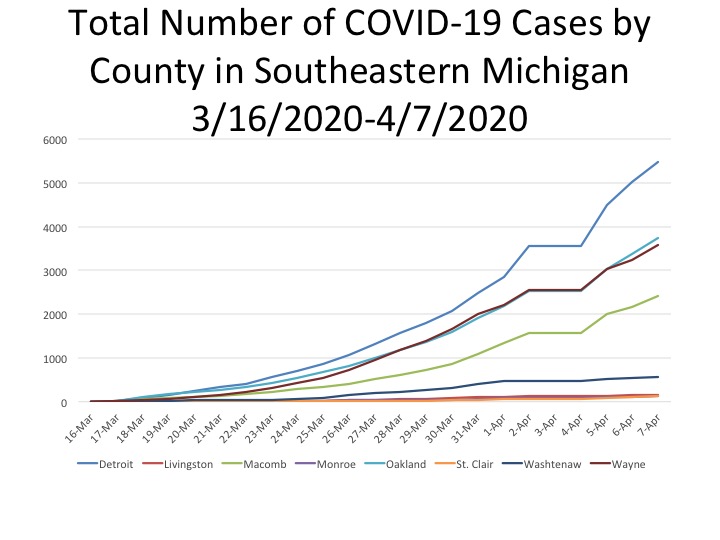
As of April 7, 2020 the State of Michigan reported that the State has identified 18,790 COVID-19 confirmed cases, which equates to 190 cases per 100,000 in the State of Michigan. Confirmed cases in the State and throughout the counties in Southeastern Michigan have continued to rise since mid-March. As the third chart below shows, the City of Detroit and Wayne, Oakland and Macomb counties have experienced the largest number of increases in case numbers in the region. The Wayne County numbers in the chart exclude the number of cases in Detroit. Since March 16 the City of Detroit has had the highest number of confirmed cases in the region. On April 7 the State of Michigan reported there were 5,476 confirmed cases in the City of Detroit. On April 7  Oakland County reported 3,736 confirmed COVID-19 cases, Wayne County reported 3,569 (excluding Detroit) and Macomb County reported 2,414. As these three counties and the City of Detroit continue to experience increases in case numbers, the less populated counties in the region-Monroe, Livingston, St. Clair-have had case numbers increasing at a much slower rate. On April 7 none of those counties had more than 155 confirmed cases. This data was provided from covidtracking.com, which links to the data published daily from the State of Michigan.

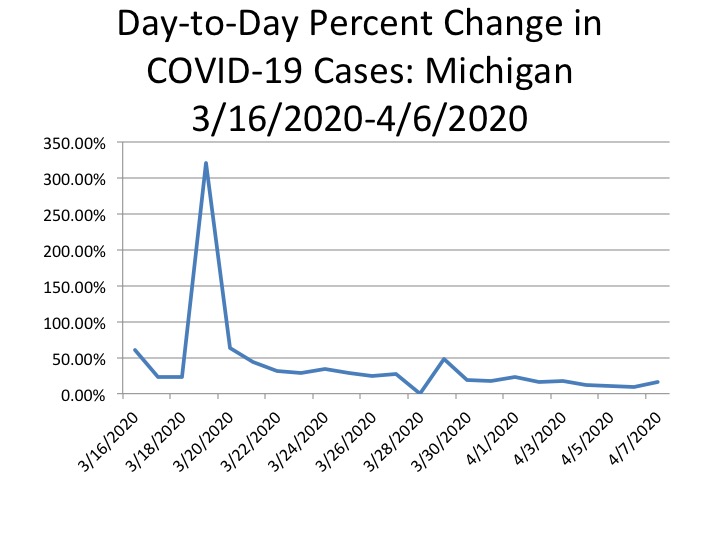
In addition to the raw data of confirmed cases, we also show in the fourth chart the percent change in the number of cases reported day-to-day. The largest percent change thus far reported was on March 19 at 320 percent-this increase was also likely related to an increase in  the number of available tests. Also the 0 percent change on March 28 reflects that the data reported from the day prior did not change; it is unlikely that no new cases were reported that day. On April 7 the percent change from April 6 was 16.3 percent, an increase from the day prior which had seen 9.6 percent increase.

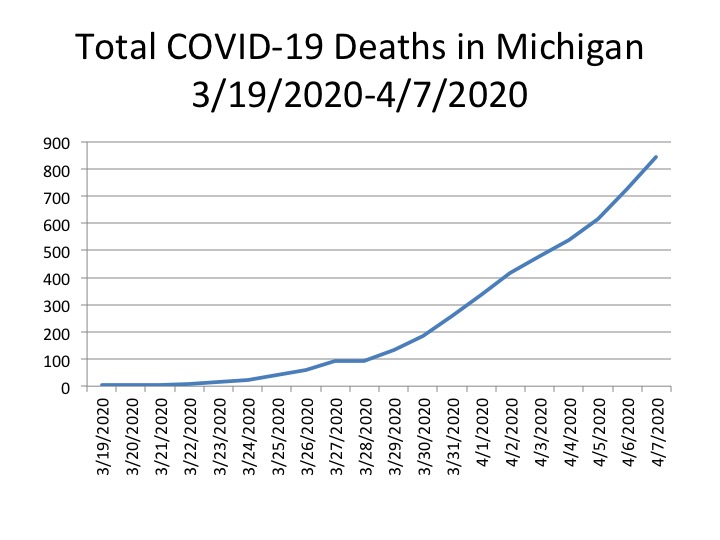
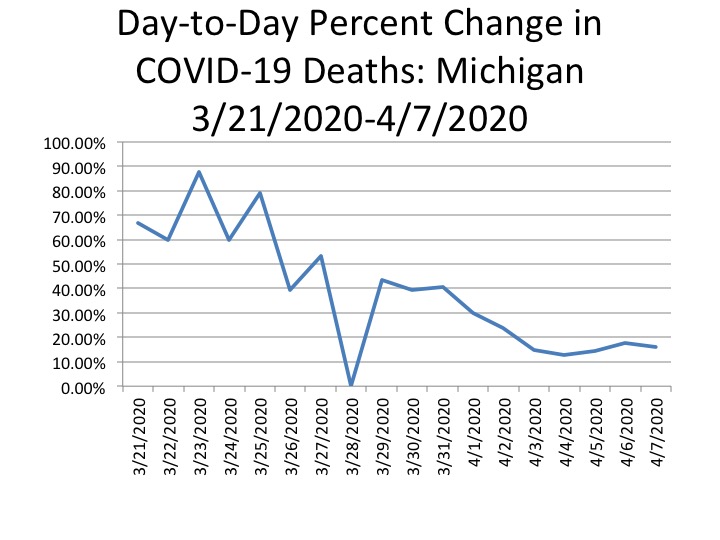
The total number of deaths in the State of Michigan also continues to rise. It was reported by the State of Michigan that on April 7 the total of COVID-19 deaths reached 845. This was a percent change of 16.2 percent from April 6, a slight decrease from the 17.8 percent change from April 5 to April 6.

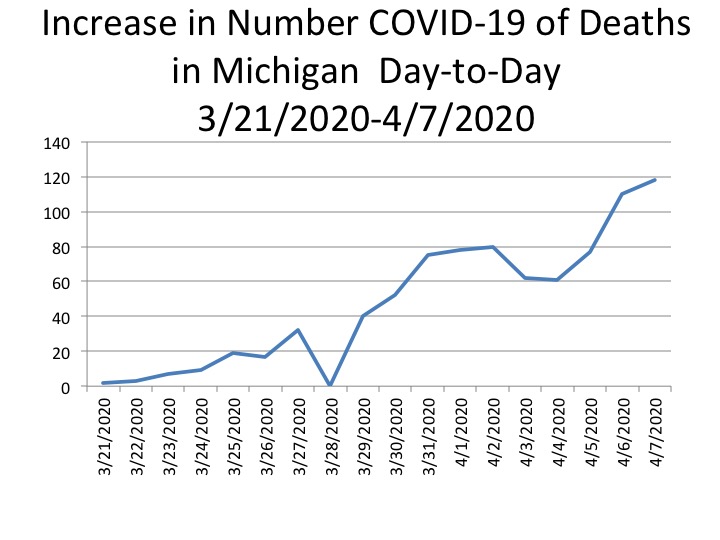
The 845 total deaths reported for April 7 was 118 deaths higher than what was reported on April 6. The second and third charts below tend to indicate some slowing in the increase of deaths.  The fourth chart below demonstrates that Oakland County and Detroit have been changing places as the locations with the highest number of deaths. As of April 7 Detroit had the highest number; on April 7 the State reported there were 222 total COVID-19 deaths in Detroit. Also on April 7 it was reported that were 205 reported COVID-19 deaths in Oakland County, 180 in Wayne County (excluding Detroit) and 121 in Macomb County. There have been zero reported deaths in Monroe County, 2 in Livingston County, 3 in St. Clair County and 11 in Washtenaw County.

**Note-the 0 percent change on March 28 reflects that the data reported from the day prior did not change; it is unlikely that no new cases were reported that day.**

This post highlights what has been expected, the number of cases and deaths continue to rise. As we have been noting though, availability of tests and resources does play a part in the numbers publicly reported for both confirmed cases and the number of deaths. As we continue to update numbers you will also see us dig further into the County data to better understand when and where the main increases in cases and deaths are occurring.

Michigan Employment Ramifications from COVID-19

Today, Gov. Gretchen Whitmer placed a three week stay-at-home order on the residents of Michigan to slow the spread of the coronavirus disease (COVID-19). This order, along with other executed orders issued in the last week means restaurants are limited to takeout, casinos are shuttered and the Big 3 (Ford, GM and Chrysler-Fiat) all temporarily closed their manufacturing plants, along with hundreds of other businesses deemed non-essential. As the number of confirmed cases in Michigan continue to rise so do the concerns about economic stability. Staying home and social distancing are necessities at a time like this but businesses, and their employees, are grappling with how to stay afloat. Some have the ability to have their employees work from home, others can pay their workers for some period of time despite being closed, and many employees are left without knowing where their next paycheck will come from.

According to Bridge Magazine, the Michigan Department of Labor and Economic Opportunity reported about 108,000 unemployment claims as between March 16-20, 2020. The same agency reported that the average weekly unemployment claims during the height of the Great Recession peaked at about 90,000.

To provide a better glimpse as to how many people in Michigan may be economically impacted due to this global pandemic we have provided the most recent annual employment numbers from the State for occupations and industries that have been or are most likely to be impacted.

All the employment data in this post is from the Michigan Department of Management, Technology and Budget and focuses on Metropolitan Statistical Areas (MSA) in Michigan, which are areas with a dense population at its core and close economic ties to the surrounding areas in the region. Not all MSAs in this post had data to reflect the industries or occupations examined in this post. Additionally, some State totals may vary from the totals in the pie charts due to the fact not all MSAs had data and some areas, such in the Upper Peninsula, do not have an MSA but do still have employees in the various industries and occupations examined.

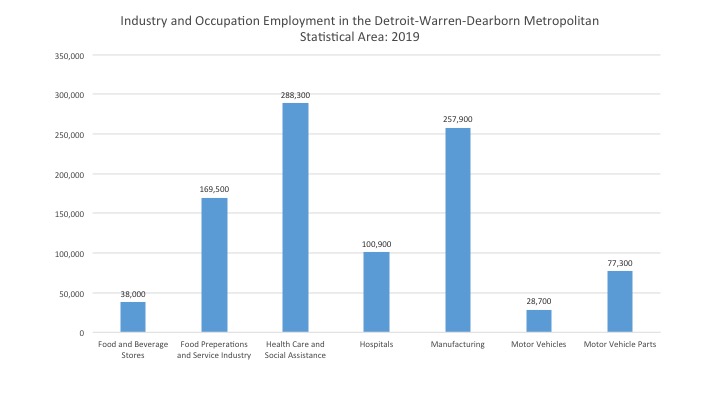
The chart below shows the number of employees in 2019 of the various industries and occupations that are arguably amongst the hardest hit due to COVID-19, whether it be from being forced to or from being overworked due to community needs (health care workers and grocery stores, who have been deemed essential employees by the governor).

In 2019, there were 672,000 people who declared manufacturing as their occupation; this was the highest number in the State of Michigan of those examined in this post; those declaring health care and social assistance as their occupation came in second at 606,900. The food preparations and serving industry came in third with 392,900 people employed in the State of Michigan.

In breaking the data down further, we look at the same industries and occupations (if data was available) for the Detroit-Warren-Dearborn MSA. For just this area, the health care and social assistance occupation had the most number of employees at 288,300 in 2019, followed by manufacturing at 257,900. In the Detroit-Warren-Dearborn MSA there were 169,500 people in the food preparation and serving industry.

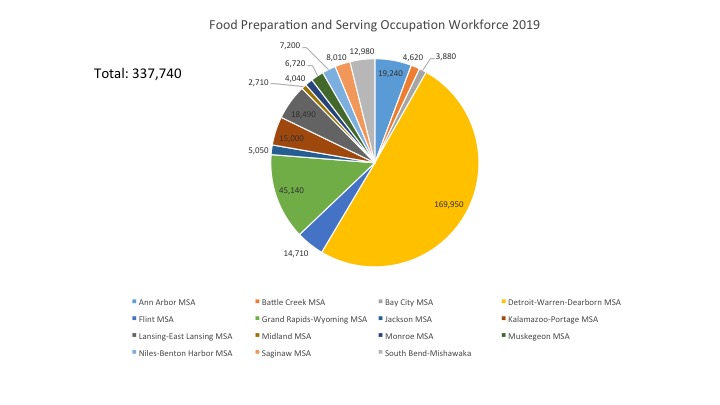
The two pie charts below highlight what areas (MSAs) are likely to be impacted the most in terms of unemployment as a result of COVID-19 related closures. Food preparation and serving and manufacturing were the only two occupations with comprehensive data sets for 2019, and as both charts show, the Detroit-Warren-Dearborn MSA had the highest number of employees (this is also the most densely populated area in the State). For food preparation and serving there were 169,950 employees in the Detroit-Warren-Dearborn MSA followed by the Grand Rapids-Wyoming MSA with 45,140 employees. For manufacturing there were 257,900 employees in the Detroit-Warren-Dearborn MSA in 2019 and 119,000 in the Grand Rapids-Wyoming MSA.

As the snapshots above show, thousands of people are at risk of being unemployed for an unknown amount of time. And, as noted earlier, the number of unemployment claims continue to rise as a result of COVID-19 and the precautions being taken to “flatten the curve.” In 2019 the unemployment rate for the State of Michigan was 4.1 percent, the lowest it has been since the start of the Great Recession in 2008. We certainly have a long way to go before unemployment rates reach what they were during the peak of the recession (14%) but with such a swift shift in employment for hundreds of thousands of people the possibility is certainly on the minds of many.

While the economic future of Michigan and the country is not exactly certain at this time, actions are being taken by federal and state officials to aid citizens. At the federal level officials are working to secure a coronavirus stimulus check for qualifying citizens and in Michigan Gov. Whitmer extended unemployment benefits, among other forms of support. For now, what we can do is adhere to the guidelines created by the Centers for Disease Control to “flatten the curve,” which include: remaining at home-especially when sick, keeping at least six feet away from others, washing your hands frequently for at least 20 seconds, covering coughs and sneezes and regularly cleaning frequently touched surfaces. Additionally, local businesses can be supported by: purchasing gift cards, donating to funds they may have created or are being supported through, ordering their products online or purchasing carry-out and writing your elected officials to find means to further support them through public policy decisions.

Southeast Michigan Children in Poverty

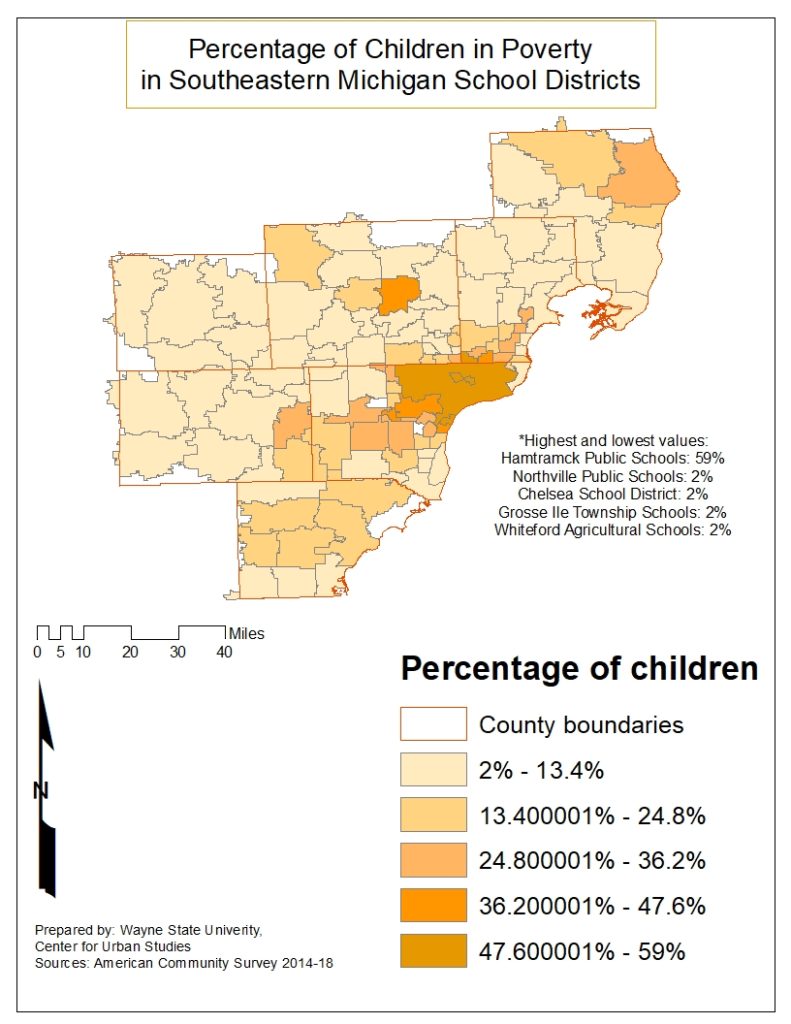
Those in poverty often experience food insecurity, including children. With schools across the State of Michigan closed for the next several weeks due to the threat of the coronavirus disease (COVID-19) it is important to understand which school districts have students at a higher risk of food insecurity while school is out.

Those in poverty often experience food insecurity, including children. With schools across the State of Michigan closed for the next several weeks due to the threat of the coronavirus disease (COVID-19) it is important to understand which school districts have students at a higher risk of food insecurity while school is out.

Highland Park School District Has Highest Percentage of Single Parents

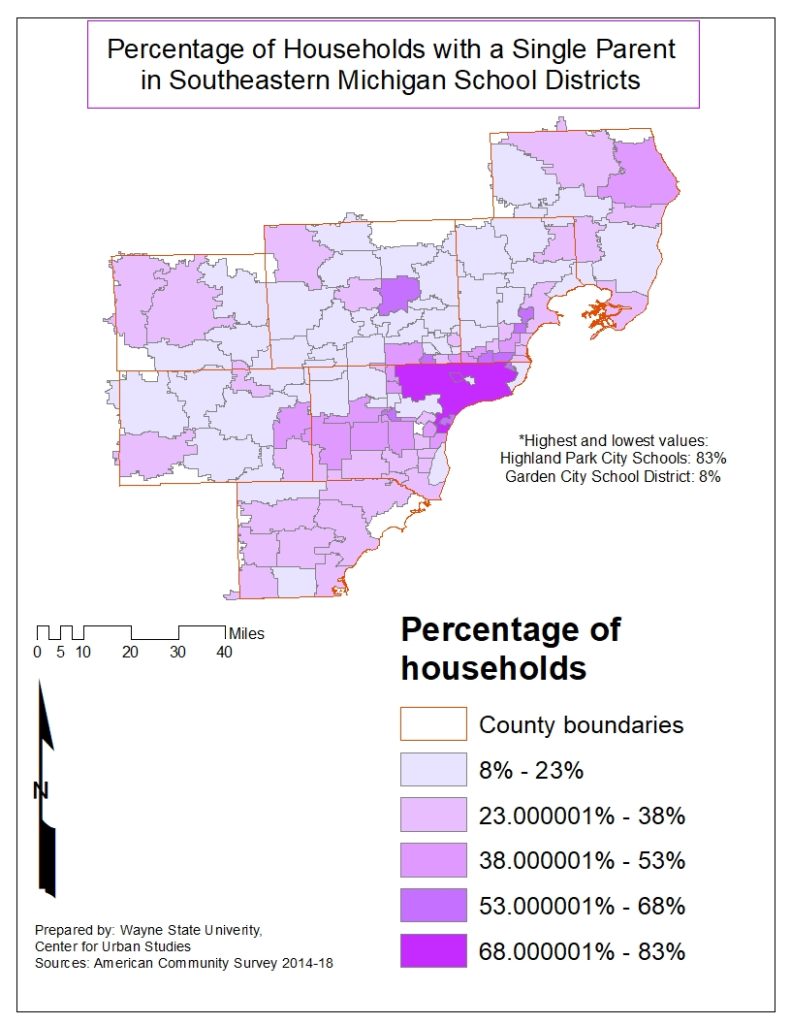
In Southeastern Michigan there are 17 school districts with 50 percent or more of the households being run by a single parent. This is an important statistic as it can relate to the financial well-being of a family, which often correlates with a child’s access to quality education and educational and extra curricular opportunities. According to the Pew Research Center, in 2017, 32 percent of parents were unmarried. Of the 110 public school districts in Southeastern Michigan 44 have 32 percent or more of households with a single parent.

The district with the highest percentage of single parents is the Highland Park School District where 83 percent of households with school-aged children have a single parent.  Highland Park School District also has the lowest median income for single mothers at $15,224, and, while the two are not mutually exclusive, it does provide insight into the economic and family backgrounds of many of the students in the district.  The district with the second highest percentage of single parents is the Ecorse Public School District at 74 percent; the median income for single mothers in that district is $16,108. Following the same pattern, Detroit Public Schools has the third highest percentage of single parents at 71 percent.

On the opposite end of the spectrum, Garden City School District in Wayne County has the lowest percentage of households with a single parent at 8 percent. The next two districts with the lowest percentage of single parents were Milan and Saline public schools, both in Washtenaw County, at 10 percent. In Oakland County, Bloomfield Hills and Birmingham school districts have the highest median income for single mothers at just under $83,000, and the percentage of single parents in these districts is 16 percent for both.

As we’ve noted throughout this series, family income does often have an affect on the type of education a child receives, and this post highlights that while tying in how family background may also have an affect.

Birmingham, Bloomfield Hills have Highest Percentage of Students in Private Schools

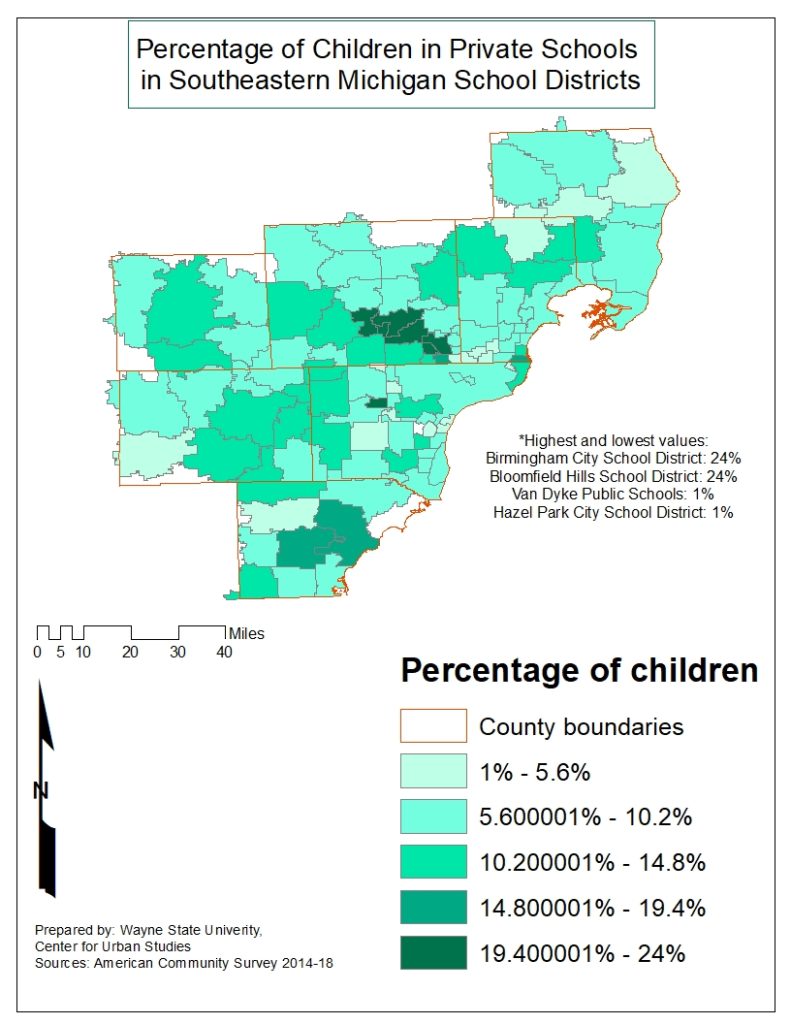
The U.S. education system allows students to attend either public or private schools, both for K-12 and post secondary education. While public education is the most common choice for parents and students, there are a large number of students who attend private schools. In Southeastern Michigan, the percentage of students within public school distract boundaries who attend private schools varies between 1 and 24 percent.

In the Southeastern Michigan region there are 110 public school districts, and within each of those districts some portion of students are sent to private schools. Of the 110 public school districts, 30 have more than 10 percent of students who attend a school operated by a private entity. Furthermore, there are five districts in the region where more than 20 percent of students in each district attend a private school. Of these five school districts, four are in Oakland County and one is in Wayne County. According to data from the American Community Survey, both Birmingham Public Schools and the Bloomfield Hills School District  (both in Oakland County) have the highest percentage of students who attend private schools at 24 percent.  The other two school districts in Oakland County where more than 20 percent of students are attending private schools are Berkley and Royal Oak public schools (21 and 23 percent, respectively). The Garden City public school district in Wayne County is the other district where more than 20 percent of students attend private schools (22 percent).

Conversely, Van Dyke Public Schools (Macomb County) and the Hazel Park Public School District (Oakland County) have the lowest percentage of students attending private schools in Southeastern Michigan at 1 percent. In Detroit, 6 percent of students in the Detroit Public Schools district attend private schools.

While there are various reasons for students to attend private schools, which include religious preferences, classroom sizes and access to specific resources, the districts with the two highest percentages of students attending private schools also are amongst those with the highest median incomes for parents in the region, according to the American Community Survey. In Birmingham Public Schools the median income of families with children is $175,132, and in the Bloomfield Hills public school district the median income for families with children is $159,441. Conversely, the median income for families with children in Van Dyke Public Schools district is $27,125, and in the Hazel Park Public School District the median income is $44,093.

Private school in Michigan, as it currently stands, do not receive any public funding. With tuition costs to fund the operation of these private schools, it is not surprising that the districts with higher median incomes have higher percentages of students attending private schools.

Census 2020: Hard to Count Areas in Southeastern Michigan

The goal of the 2020 Census is to count each person in the U.S., based on their primary residence, by April 1, 2020. However, the fear is that several communities in Michigan will be undercounted in the 2020 Census, meaning a lack of federal funding in the future. And a major portion of 7-county Southeastern Michigan area is in the so-called “hard to count” category.

The majority of the Census is completed by households self-responding via mail or online, starting this year. Throughout the country there are areas where self-response rates are very high, and in other areas they are just the opposite. The areas with previously low self-response rates have been deemed as “hard to count” areas; these areas often include minority and immigrant populations, along with renters and children under the age of 5.

Data for this post was provided by City University of New York, and they deemed an area hard to count if its self-response rate was 73 percent or less for the 2010 Census. This percentage is based on the mail return rate from occupied housing units for the 2010 Census.

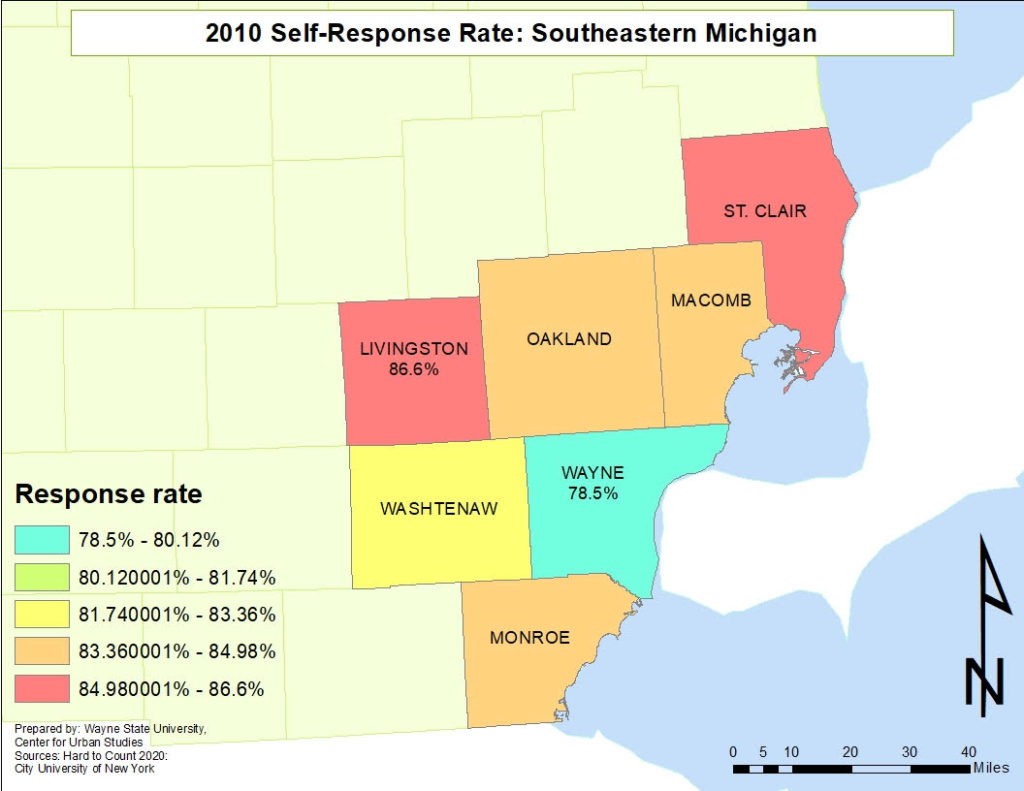
As the map shows below, at the county level, self-response mail in rates are high throughout Southeastern Michigan, ranging from 78.5 percent to 86.6 percent. Livingston County had the highest self-response rate at 86.6 percent while Wayne County had the lowest at 78.5 percent. Breaking this data down to the census tract level helped determined what areas would be hard to count for the 2020 Census.

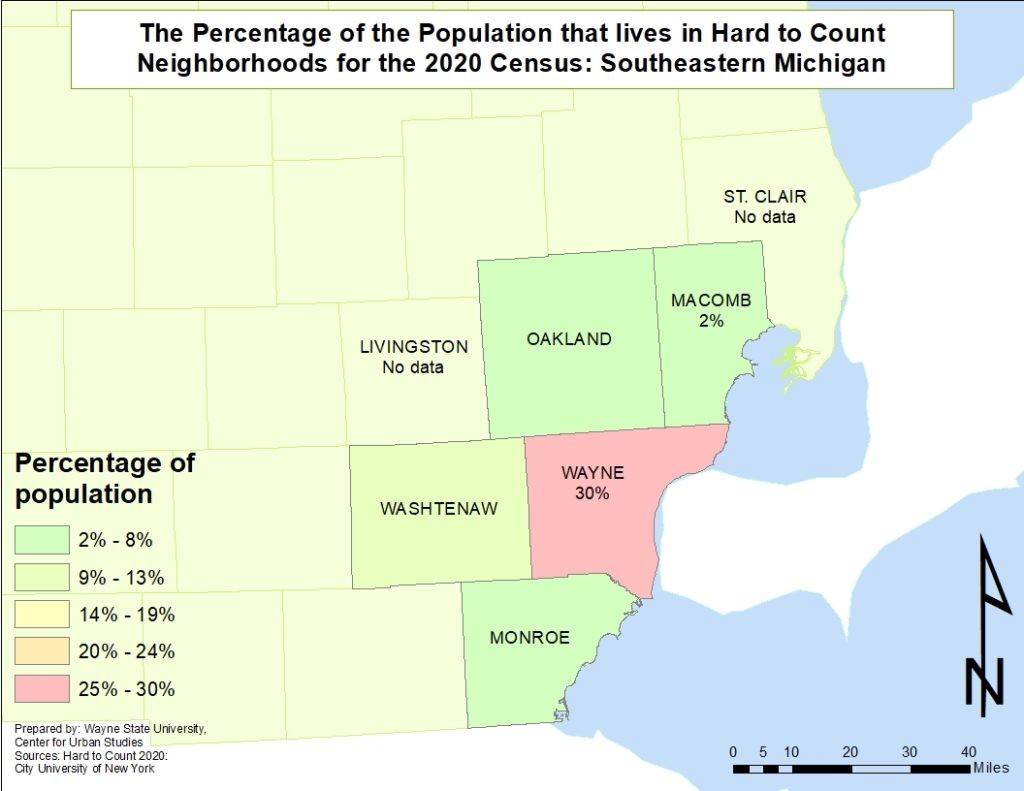
Overall, at the county level, five of the seven counties have hard to count populations. Wayne County has the highest hard to count population at 30 percent and Macomb County has the lowest hard to count population (of those with such a population) at 2 percent. Livingston and St. Clair counties did not have any hard to count data available. Wayne and Washtenaw counties are the only two in the region with hard to count populations in the double digits (30 and 10 percent, respectively).

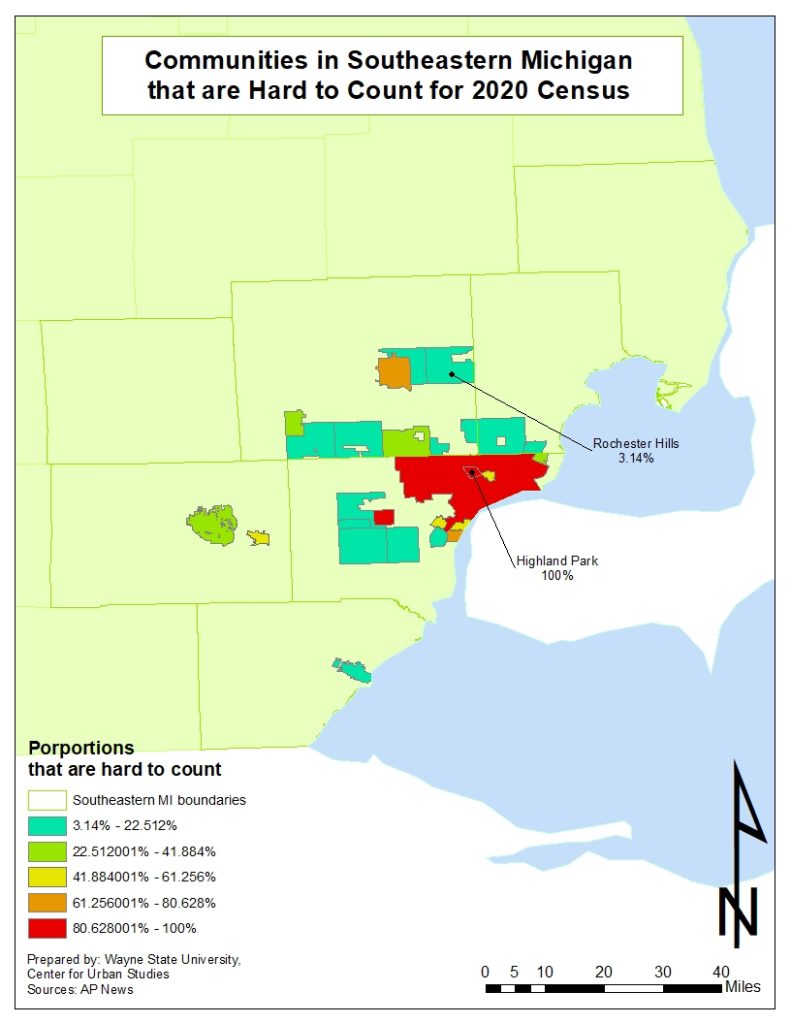
When looking at the counties on a deeper level, by census tract, we see that Highland Park, Inkster and Detroit (all in Wayne County) have the largest hard to count populations in the region. In Highland Park 100 percent of the population is considered hard to count for the 2020 Census; in Inkster that percentage is 91 percent and in Detroit 86 percent of the population is considered hard to count. The top reason for all three of these cities having such a percentage of hard to count populations is due to the high poverty levels. Other reasons, according to AP News, include a high African American population, low response rates to the American Community Survey and a high percentage of children living below the poverty level. Of the hard to count communities in Southeastern Michigan (27), nine have hard to count populations above 50 percent.

Washtenaw County has the second overall highest percentage of hard to count populations. This is because Ypsilanti has 52 percent of the population considered hard to count. Ann Arbor is estimated to have 29 percent of its population designated as hard to count. The main reason for Ann Arbor’s hard to count status is because of the high percentage of residents between the ages of 18-24 years of age (the University of Michigan is located in Ann Arbor); there is also a high proportion of renters there and a high proportion of individuals who move residences from one year to the next. In Ypsilanti there is a high hard to count population due to high poverty levels and the high number of renters.

To ensure overall high self-response rates the Census Bureau has now made it possible for individuals to complete the Census online, by mail and over the phone. If residents do not respond by one of those methods census takers will knock on the doors of homes that have not responded. Additionally, communities throughout the stateare also putting together large outreach campaigns to ensure members of their communities complete the Census. For example, the City of Detroit has a website that lists Census resources, ways to volunteer for outreach events and how to apply for a job with the Census. For more information on the Census visit 2020census.gov.

Eastpointe: Property Taxes Decrease, Number of Special Assessments Increase

For our cities to function effectively, taxes must be levied to support services vital to their survival. Here we examine the same hypothetical Eastpointe property discussed last week to portray what additional taxes—beyond general school, city and county operating millages—are levied to provide services to this city’s residents.

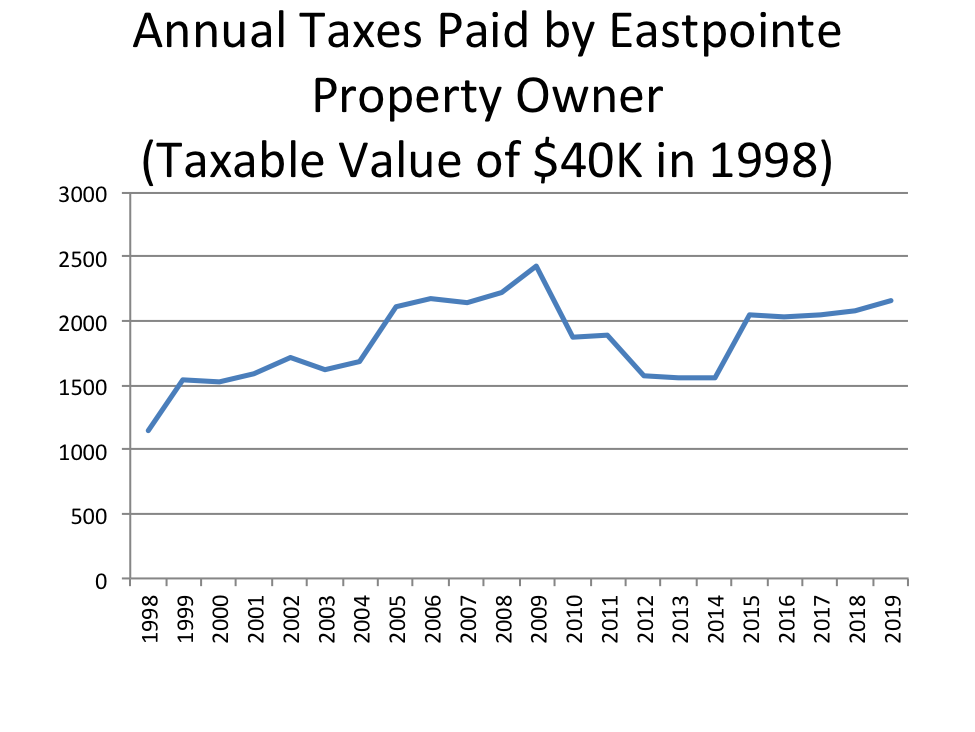
The first chart below shows that from 1998 to 2009, the total dollar amount this hypothetical property owner was paying in taxes gradually increased. This can be attributed to two factors. First, both the assessed and taxable value of the property (shown in Chart 3) gradually increased during that time, meaning more property tax revenue for local governments. Second, voters approved at least one new major tax levy during that time. This major tax was approved in 2005 and allowed the city to collect a special levy of up to 7 mills for public safety. For this hypothetical household, that levy equaled $327.94 in 2005. In contrast, a decade later, that same special levy brought in $219.08. The decline was due to the fact that the taxable value of the property plummeted, along with the assessed value, in the wake of the Great Recession.

As shown in Chart 1, the amount of taxes this hypothetical property owner paid peaked in 2009 ($2,432.30), which corresponded with the peak taxable value of this home ($53,599). The subsequent decline in tax bills occurred despite new service assessments approved by Macomb County voters. For example, it was in December of 2008 when the regional millage for the Detroit Zoo began to appear on the tax bills for this property, which by then had a taxable value of $51,340.41, costing the homeowner $5.13. Tax data from the City of Eastpointe also shows that this new assessment was much lower than existing county assessments such as the Huron-Clinton Metroparks millage, costing this hypothetical property owner $11.01 in 2009,and the Suburban Mobility Authority for Regional Transit (SMART) millage, which cost the homeowner $30.29 that year. Chart 2 below presents a timeline of the changes in county-wide and city millages that affected Eastpointe taxpayers.

Chart 1

**(Note-all taxes on the Eastpointe tax bill are included in the graph above)

Chart 2: Timeline of Eastpointe, Macomb County Millages and Increased Millage Renewals

1995

  • Suburban Mobility Area Transit Authority (SMART): 1 mill (quadrennial countywide renewals approved at varying rates; the most recent was narrowly approved in 2018)

2005

  • Eastpointe Public Safety: 7 mills (part of general city operating millage starting in 2016)

2008

  • Detroit Zoo: 0.1 mill (2008-present; renewal approved in 2016)
  • Macomb County Veteran Millage: 0.4 mills (2008-present; increase approved in 2016)

2011

  • Recreation Authority of Roseville and Eastpointe: 1 millage  (2011-Present)

2012

  • Detroit Institute of Arts: 0.2 mills (2012-2022; renewal question on March 2020 ballot)

2015

  • South Macomb Oakland Regional Services Authority (SMORSA): 14 mills (2015-present)

**The Huron Clinton Metropark Authority millage has been levied since the 1940s***

Chart 3

The trend of decreased property values and the addition of special assessments to tax bills continued in the wake of the Great Recession. In 2011, residents in Eastpointe and Roseville approved a 1-mill levy to fund the newly created Recreational Authority of Roseville and Eastpointe (RARE). Later, voters in Macomb, Oakland and Wayne counties approved a 10-year, 1 mill tax for the Detroit Institute of Arts (DIA), which appeared on tax bills in December of 2012. The largest increase came in 2015, when Eastpointe and Hazel Park voters approved the creation of the South Macomb Oakland Regional Services Authority (SMORSA), to provide a new revenue source for public safety services in both cities; this regional authority levies 14 mills annually. Macomb County voters also approved a 0.069 mill veterans millage in 2016, a slight increase from an earlier 0.04 millage rate.  In addition, residents of Eastpointe have regularly renewed a millage to support their local library.

Between 1998 and 2019, the timeline for the data in this post, the amount in taxes paid reached a high in 2009 at $2,432.30 (when the taxable value of the property was at its highest) and a low in 2014 at $1,563.50 (when the taxable value was at its lowest). Due to the limitations of Michigan’s Proposal A, which only allows annual taxable value increases of 5 percent or the rate of inflation (unless the property is sold), the taxable value of this hypothetical property rose only about 7.4 percent over the next five years (2015-19). However, due to these new assessments, the hypothetical property owner paid about 38 percent more in total property tax during that timeframe—roughly equal to the rate of the home’s assessed value increase.

Eastpointe’s case reveals that local governments have had some success in combating the fiscal consequences of the decline of general operating tax revenue with voter-approved special assessments for the county-level service authorities, and especially with SMORSA. Voter support for these services has been there in recent years, but it remains to be seen whether it will persist in the coming years.

This year, property owners across Macomb County may see some additional changes to their tax bills. In March, the DIA will ask voters to renew a 10 year, 1 mill tax renewal; if voted down in any particular county, the DIA assessment in that county will fall off the tax rolls in 2022. Voters will also be asked to approve a 1.9, 10-year millage on the March ballot to support classroom operations through the Macomb Intermediate School District (MISD); this proposed millage is different from the general operating millages currently levied by the MISD and local school districts.  Later, in August, Macomb County voters will also be asked to approve a millage for a yet to be determined amount and length to support either building a new county jail or renovating the current one. The Regional Transit Authority (RTA) may also be considering a millage proposal in 2020; although at this time it appears Macomb County voters will not be asked to support the proposal to support this.

Eastpointe: Property Values Rise as Taxable Values Inch Up

This post is the first of many that will demonstrate the difference between the taxable and assessed values in communities throughout Southeastern Michigan and explain the various taxes levied in these communities and their use. We will highlight at least one community in each county in the region and this post discusses Eastpointe in Macomb County. Eastpointe, formerly known as East Detroit, has a population of about 32,000, a median income of about $46,000 and a median home value of $64,700, according to the U.S. Census Bureau.

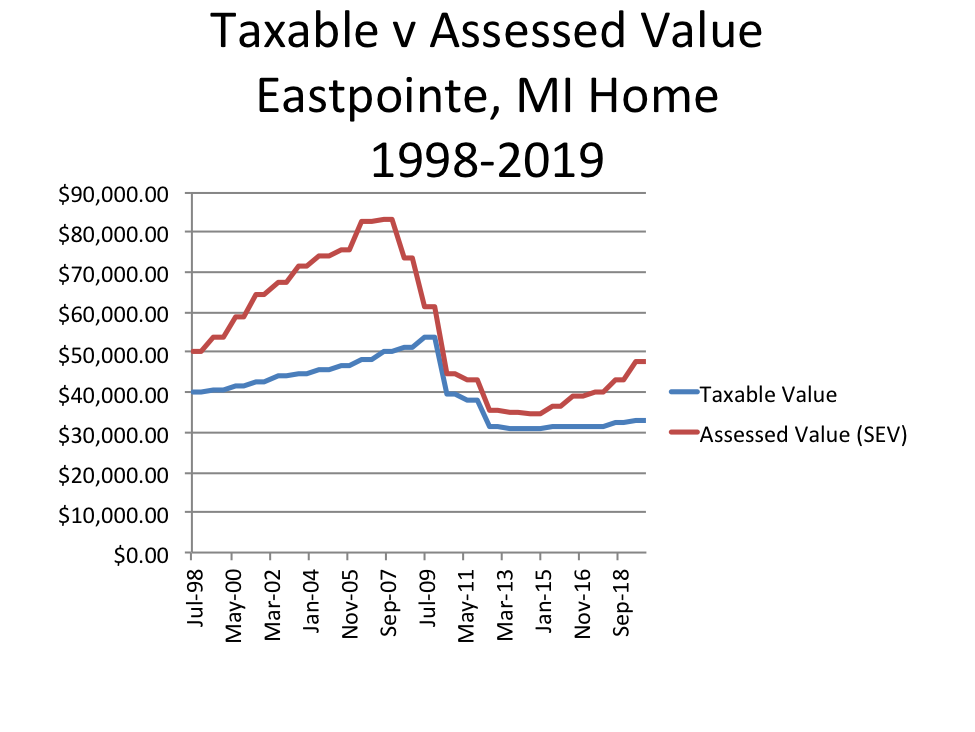
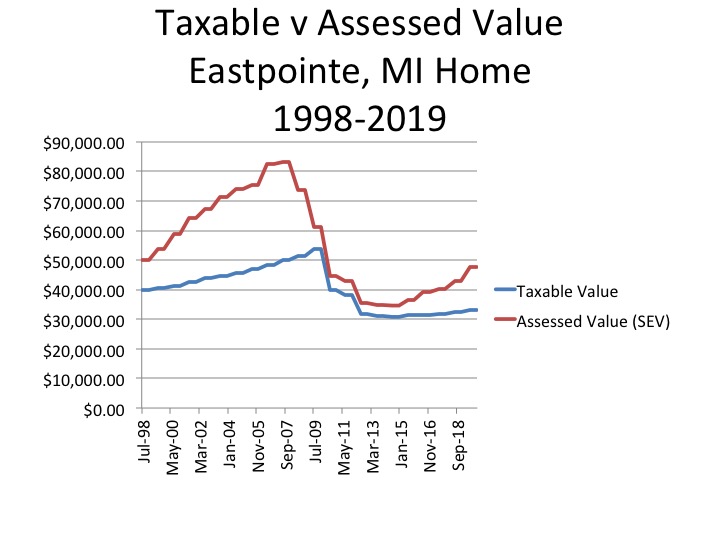
The chart below shows the taxable value and assessed value of a hypothetical Eastpointe home, beginning in July of 1998 through December of 2019. The taxable value is the value used to calculate a property’s taxes, and each year it can only increase by 5 percent or the rate of inflation, whichever is less. This number may be equal to the property’s state equalized, or assessed value, but not more than those values. Such limits on tax growth, or lack thereof, is a result of Proposal A, a state constitutional amendment approved by voter referendum in 1994. The assessed value of a property, or the state equalized valued (SEV), is usually about half of a property’s true cash value, and the true cash value is the fair market value of the property.

In 1998 the taxable value of the Eastpointe property examined was $40,000 and the assessed value was $50,000. In July of 2007 the assessed value of the property peaked at $83,252 but the taxable value was only at $50,186. By 2008 the Great Recession hit Southeastern Michigan and both the assessed values and taxable values of properties began to decline. Between July of 2007 and July of 2010 the assessed value decreased from $83,252 to $40,700, or more than 50 percent ($40,000). The annual declines continued after the recession, and the assessed value of the property reached its lowest point in July of 2014 at $34,641, a nearly 60% decline from its peak. Since July of 2014 the assessed value of the property has increased to $47,840.

As noted, the taxable value of the property was $40,000 in July of 1998, but it did not increase nearly as much as the assessed value did, because it cannot rise more than the rate of inflation or 5 percent from year-to-year. As a result, the taxable value of the property did not peak until July of 2009 ($53,599). A year later though, in July of 2010, the taxable value plummeted to $39,749. A property’s taxable value can decrease in such a way if there is a physical loss to the property and/or if the property is sold in the previous tax year. The Great Recession began in 2008 and by 2010 the taxable value of properties were on the decline, ultimately affecting governmental budgets, and services. In July of 2013 the taxable value of this Eastpointe property reached its low point at $30,804. Since then the taxable value of the property has only increased to $33,095.

Due to economic trends and the way taxable values and assessed values are calculated under Proposal A of, the assessed value of a property is nearly always higher than the taxable value. For this specific property, the only time the taxable value and assessed value were nearly the same was in July of 2009, when the taxable value was $39,749 and the assessed value was $40,700. In addition, while the gap between the two values has not been nearly as large as it was prior to the recession, since 2016 that gap has been widening.

As noted earlier, our various forms of government rely on property taxes to function, primarily our local governments (municipalities and school districts). The chart above shows that just because the local economy is recovering since the Great Recession, the budgets of local governments are not necessarily reaping the benefits. According to a recent report by the Michigan Municipal League, 173 cities in Michigan have experienced a 2 percent or less revenue growth in the last 15 years and an additional 52 have experienced a budget growth of 3 percent or more. For Eastpointe, according to the a recent report released by the Michigan Municipal League, the total revenue for the city in 2002 was $22.3 million, and in 2017 it was $25.8 million. While the total revenue for Eastpointe has increased by 16 percent the revenue generated by property and income taxes declined by 23 percent. However, while the effects of limited property tax have negatively affected municipalities across the state, the slow growth of such taxes has benefitted for the property owners. According to a September 2018 Detroit Free Press article while income growth in the state has increased since the last recession, household incomes prior to the recession have not yet been recouped. Since incomes are also recovering at a slower rate, it can be viewed that the slow growth rate of property tax revenue is allowing property owners to better stay afloat economically.

It should be noted though that a, at least in Southeastern Michigan, local tax bills have become gradually more complicated as voters approve additional tax levies, to help make up for the loss in revenue as a result of the recession, and the loss in revenue due to the limited growth of taxable values. Next week we will examine the various taxes levied for this hypothetical Eastpointe property, including what they are for, what additional ones have been added over time and how the overall tax amount for the property has either increased, or decreased, over time.