Equal Equitable Policies Needed for Longer Life Expectancy

Socioeconomic factors have a direct impact on the span of one’s life. Our posts on January 3,16 and 23 have demonstrated clear relationships between lifespan and key policy variables.

Where do you live? What is your highest-level education? How much do you earn? Do you have access to health care? Depending on how an individual answers each of those questions, their life expectancy may go up or down.

As we’ve learned over the last several weeks:

  • Those living at or below the poverty line have a lower life expectancy.
  • Those with a bachelor’s degree or higher have a higher life expectancy.
  • Those without health insurance have lower life expectancy.

We further examined the combined impact of these three factors to help understand which is most important. Using multiple regression analysis, we estimated the impact of each variable as well as their combined effect. Together they explain 62.6% of the variance in life expectancy across the region, meaning that nearly two thirds of one’s age at death is related to their combined effect. This is a highly statistically significant effect with less than one chance in a 1,000 that this estimate is a result of chance. Further, of the three variables, the most powerful variable is the level of education (b=0.100; beta=0.456). It is almost one and half times as powerful as poverty (-0.099; -0.345) the second most powerful variable. And education is four times as powerful as being uninsured (-0.081;-0.101).

Nevertheless, all three of these variables contributed an independent effect on life expectancy. These variables are correlated with each other, which under certain conditions can bias these results, but after examining statistics such multicollinearity this does not appear to be a problem. So, while poverty effects both education and the likelihood that somebody in uninsured, each provides an independent effect. No doubt other factors do as well, including chance, habits, and one’s genetic background.

Still it is both sad and potentially hopeful that much of the differences in life expectancy across our region can be explained by these factors because all of these factors are ones we, as a society and a polity, can affect.

This helps us answer the question of what can be done to improve average length of an individual’s life. We need to start by decreasing poverty. Decreasing poverty is not easy to tackle, but there are steps policy makers can take to lower the number of people living at or below the poverty level. Such actions include increasing the minimum wage, creating policies focused on long-term job growth and supporting equity in pay structures, job opportunities and available housing. Perhaps the most important policy is to use the tax system to redistribute income by taxing the very rich (the one and two percenters) to provide supports and services to those with less income. Remember the U.S. once taxed high earners at a rate over 70 percent.

More tax revenue would support higher education, which has recently been strangled by decreasing support from state governments and increasing reliance on student loans. The over-reliance on loans burdens graduating students with long term loan payments, which decrease their mobility and their ability to pursue graduate education.

The creation of a semblance of a national health care system through Obamacare has provided some basic protections for many who had no care. There are, however, still many that do not have care or for whom care is so expensive they cannot truly afford it. Increasing access to health insurance will also require extensive work, but one way to start includes providing information to the underserved on their current options to receive healthcare, and extending these services. Policies reforming the fee structures instituted by insurance and medical companies and creating alternative payment methods are other ways to make health care more accessible.

Overall, discovering reasons why certain communities in Southeastern Michigan have such lower average life expectancies helps us understand what we need to move ahead. Let’s provide them with the income to create healthy lifestyle and sustain longer lives. However, actions must be taken in order for those opportunities to be made available. We as a society, and our policy makers, need to ensure equity and equality are inherent parts of the socioeconomic policies that can ultimately give individuals an opportunity to live a longer life.
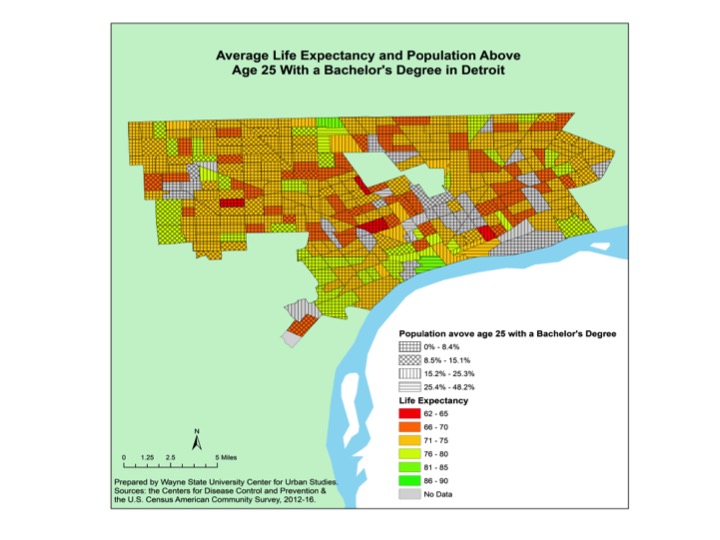
 

Education Related to Life Expectancy in Southeastern Michigan

Another way to think about life expectancy is to say that it is partially a result of the choices we make, and the quality of choices might be indicated by our extent of education. Here we have represented education by the percent of a tract’s population over 25 that has a bachelor’s degree or higher. One could argue, appropriately, that getting a college education is at least partially a function of family income, but for now we want to see the simple correlation of this measure or education and life expectancy. We find a correlation between life expectancy and those with a bachelor’s degree or higher is 0.721 (sig. 0.00), meaning, as an individual’s education level increases so does their average age of life expectancy. In Detroit, the map below shows that majority of the Census Tracts that make up the City have about 8 percent of the 25 years of age and older population having earned a bachelor’s degree or higher. And, as we’ve discussed throughout this series, Detroit has among the lowest average life expectancy rates in the Southeastern Michigan region. The two Census Tracts in Detroit with the highest life expectancy rates (86-90 years of age) also have the highest percentage of individuals age 25 years and older with a bachelor’s degree or higher. The one Census Tract just south of 8 Mile Road with the highest average life expectancy rate has between 15 and 25 percent of the 25 years of age and older population having earned a bachelor’s degree or higher. The other Census Tract in Detroit with the highest average life expectancy is just southwest of Downtown Detroit and has between 25 and 48 percent of the 25 and older population having earned a bachelor’s degree or higher. On the opposite side of the spectrum, three of the four Census Tracts in the Detroit with the lowest average life expectancy (62-65) also have the lowest percentage of residents 25 years of age and older who earned a bachelor’s degree or higher.

Outside of Detroit there are similar trends: communities with lower average life expectancies tend to also have lower percentages of individuals with a bachelor’s degree or higher. For example, the majority of Washtenaw County has an average life expectancy at 86 years of age or older. Additionally, the majority of that county has 15 percent or more of the 25 years of age and older population having earned a bachelor’s degree or higher. There are exceptions, areas in the more rural counties, particularly Monroe and St. Clair counties, though that have average life expectancies above the regional average but have lower percentages of individuals living with a bachelor’s degree or higher.

As has been shown above, there is a strong positive correlation between the percentage of individuals 25 years of age and older who earned a bachelor’s degree or higher and an individual’s life expectancy. This positive correlation is further demonstrated in the scattergram below, which shows that as the percentage of the population with a bachelor’s degree or higher increases, so does the average life expectancy. The chart also shows that majority of the population in Southeastern Michigan has a life expectancy between 70 and 80 years of age with 20 percent or less of that population having earned a bachelor’s degree or higher. Additionally, the chart shows that any area with a population that has 60 percent or more of the population having earned a bachelor’s degree or higher has an average life expectancy of 75 years of age or higher.

As has been shown through some of the examples above, there is a strong positive correlation between the percentage of individuals 25 years of age and older who earned a bachelor’s degree or higher and an individual’s life expectancy. This positive correlation is further demonstrated in the chart above, which shows that as the percentage of the population with a bachelor’s degree or higher increases, so does the average life expectancy. Additionally, the chart shows that any area with a population that has 60 percent or more of the population having earned a bachelor’s degree or higher has an average life expectancy of 75 years of age or higher.

Overall, these maps and the graph show that education is related to an individual’s life expectancy. Reasons for this include, tendency to earn higher wages, which allows easier access to health care and transportation. In a recent News Scientist article it was also stated that more education leads to higher life expectancy because education improves an individual’s cognitive abilities, which allows for better planning and self-control.

Next week, we will further examine how all three factors, education, access to health insurance and poverty, all affect an individual’s life expectancy.