Macomb County’s COVID Death Rate Highest in the Region

The total number of COVID cases in Michigan increased to 31,424 (Chart 1), which was equivalent to 314 cases per 100,000 people (Chart 2) on April 19. Of those total COVID cases, the City of Detroit had 7,604 cases, Oakland County had 6,109 cases, Wayne County (excluding Detroit) had 6,088 cases and Macomb County had 4,360 cases (Chart 3).  The number of confirmed cases in Washtenaw, Livingston, Monroe and St. Clair counties combined totaled 1,626, with Washtenaw County accounting for 870 of those cases,  according to the most recent data from the State.

The daily data highlighted in these posts is from Michigan.gov/coronavirus, where data is updated daily at 3 p.m. Historical data was supplied from covidtracking.com, which republishes COVID data from the State.

In Chart 4 we see that the City of Detroit has consistently had the highest number of COVID cases per 100,000 people, which was a rate of 1,130 on April 19. Oakland County had the second highest rate at 908 cases per 100,000 people and Wayne County (excluding Detroit) had 905 cases. Macomb County had 648 COVID cases per 100,000 people.

Chart 5 shows that there have been increases in the number of new daily COVID cases for Detroit and Macomb and Monroe counties. The number of new cases in Detroit on April 19 was 107, an increased from the new reported new cases of 83 on April 18. In Macomb County the number of new cases on April 19 was 109 and in Monroe County it was 9. For Oakland County, there was 88 new COVID cases reported on April 19, a continued decrease in the number of new cases since April 14. Wayne County has been experiencing a decrease in the number of new cases since April 16; on April 19 Wayne County reported 114 new cases.

According to the data, Detroit had a rate of 16 new COVID cases per 100,000 people on April 19; this was an increase through the weekend but a rate that is about half what it was during last week, and it was huge drop from Detroit’s peak. Macomb County was the only other county in the region with a rate about 10; Macomb County had a rate of 12 new COVID cases per 100,000 people on April 19 (Chart 6). 

In addition to the raw data of confirmed cases, we also show the percent change in the number of cases reported day-to-day. On April 19 the percent change from April 18 was 2 percent, a decrease from the day’s prior change of 2.6 percent.

It was reported by the State of Michigan that on April 19 the total of COVID-19 deaths reached 2,391. This was a 3.6 percent change from April 18, which was nearly same as the percent change in new daily deaths from the day prior (Chart 9). The 2,391 total deaths reported for April 19 was 83 deaths higher than what was reported on April 17 (Chart 10); this was two deaths higher than the number of daily deaths reported on April 18.

Of the total deaths reported, the number of COVID deaths in Detroit increased by 29 from the day prior. On April 19 the total  COVID deaths across time was 619 (Chart 11). Also on April 19, the Michigan Department of Health and Human Services also reported 501 total deaths in Wayne County (excluding Detroit), 471 in Oakland County and 391 in Macomb County (Chart 11). 

On a per capita basis, per 100,000 people, Detroit also continues to have the highest number of deaths per 100,000 people at 92 on April 19 (Chart 12). Wayne County had 74 COVID deaths per 100,000 people, Oakland County had 70 and Macomb County had 58.

Chart 13  shows that Detroit reported the highest number of new deaths on April 19 at 29; Wayne County reported 20 new daily deaths, and Oakland County reported 13. For Oakland County, the number of new daily deaths has continued to decrease since April 16; also note the number of new cases in Oakland County has been decreasing since April 14.

The final two charts below show the case death rates for the State of Michigan and for Detroit and the seven counties in Southeastern Michigan. To determine the rates we divided the reported deaths from each day by the number of total COVID cases each day.

On April 19 the COVID case death rate in Michigan was 7.5 percent; a slight increase from the 7.4 percent death rate reported the day before.

Of Detroit and the counties in the region, Macomb County had the highest case death rate on April 19 at 9 percent; it has been the highest since April 14. Wayne County (excluding Detroit) also had a higher death rate than Detroit. Wayne County’s death rate was 8.2 percent on April 19 and Detroit’s was 8.1 percent. The death rate for Oakland County was 7.7 percent, and, while the number of new cases and new deaths has been decreasing since in Oakland County over the last few days the death rate has been increasing.

These rates of death are very sensitive to the number of tests that are being completed across the region. In state or countries where far more testing is completed, death rates may be substantially lower. The failure of the CDC to complete and broadly distribute an early and accurate test has had huge consequences.

As the number of new COVID cases and deaths is increasing at a slower rate we do see that death rates for at least Detroit, Macomb, Oakland and Wayne counties are still increasing. While we know that the Stay at Home order is playing a large role in slowing the spread of the virus, how the virus is affecting those who have been infected is something we must watch, both in terms of death rates and other long-term effects for survivors.

Detroit, Wayne County Remain Epicenter for Coronavirus

The total number of COVID cases in Michigan increased to 29,263 (Chart 1), which was equivalent to 293 cases per 100,000 people (Chart 2) on April 16. Of those total COVID cases, the City of Detroit had 7,382 cases, Oakland County had 5,778 cases, Wayne County (excluding Detroit) had 5,619 cases and Macomb County had 3,992 cases (Chart 3).  The number of confirmed cases in Washtenaw, Livingston, Monroe and St. Clair counties combined totaled 1,538, with Washtenaw County accounting for 826 of those cases,  according to the most recent data from the State.

The daily data highlighted in these posts is from Michigan.gov/coronavirus, where data is updated daily at 3 p.m. Historical data was supplied from covidtracking.com, which republishes COVID data from the State.

In Chart 4 we see that the City of Detroit has consistently had the highest number of COVID cases per 100,000 people, which was a rate of 1,097 on April 16. Oakland County had the second highest rate at 859 cases per 100,000 people and Wayne County (excluding Detroit) had 835 cases. Macomb County had 593 COVID cases per 100,000 people. When looking at Chart 4 we also see that there were per capita increases for every county between April 15 and April 16, with Detroit having the largest day-to-day per capita rate increase at 36.

Chart 5 shows that Detroit, Macomb, St. Clair, Wayne and Washtenaw counties experienced decreases in the number of new COVID cases between April 15 and April 16. On April 16, Detroit reported the highest number of new COVID cases at 246. Wayne County had 211 new cases, Oakland County had 202 and Macomb County had 200. Washtenaw County had the fifth highest number in the region at 28 new cases.

When looking at new COVID cases on a per capita basis, the data shows that Detroit and Macomb County still have the highest rates (Chart 6). According to the data, on April 16 Detroit had 37 new COVID cases per 100,000 people and Macomb County had 23 new COVID cases per 100,000 people; Wayne County had 20 and Oakland County had 16.  In Oakland County, the number of new COVID cases per 100,000 people has been decreasing since April 14.

In addition to the raw data of confirmed cases, we also show the percent change in the number of cases reported day-to-day. On April 16 the percent change from April 15 was 4.29 percent, an increase from the day’s prior change of 4 percent.

Originally, we were reporting the day-to-day percent change in the number of cases from March 16. However, there was a spike in the number of tests available early on that made this data set also spike (on March 18 the day-to-day percent change as 320%). We have now started showing percent change data from March 21 forward to allow readers a more precise visual. If you would like to see the earlier versions of this data set please review our earlier posts. 

It was reported by the State of Michigan that on April 16 the total of COVID-19 deaths reached 2,093. This was a 9 percent increase from April 15, which had a slightly smaller increase of 8.7 percent of the day prior (Chart 9). The 2,093 total deaths reported for April 16 was 172 deaths higher than what was reported on April 15 (Chart 10). According to the State of Michigan, the reported increase in deaths on April 16 is related to a new weekly death certificate review the Michigan Department of Health and Human Services has put in place. As a part of this process, records that identify COVID-19 infection as a contributing factor to death are compared against all laboratory confirmed cases of COVID-19 in the Michigan Disease Surveillance System (MDSS). If a death certificate is matched to a confirmed COVID-19 case and that record in the MDSS does not indicate a death, the MDSS record is updated to indicate the death and the appropriate local health department is notified. These matched deaths are then included with mortality information posted to the State’s Michigan Coronavirus website. As a result of this week’s assessment, the data from April 16 includes 65 additional deaths that have been identified through this methodology.

Of the total deaths reported, the number of COVID deaths in Detroit on April 16 toped over 500 at 546. On April 16, the Michigan Department of Health and Human Services also reported 435 total deaths in Wayne County (excluding Detroit), 420 in Oakland County and 354 in Macomb County. Washtenaw County had 25 deaths and Livingston, Monroe and St. Clair counties all had 10 deaths or less (Chart 11).

On a per capita basis, per 100,000 people, Detroit also continues to have the highest number of deaths per 100,000 people at 81; there were 71 deaths per 100,000 people in Detroit on April 15 (Chart 12). On April 16 Wayne County had 65 COVID deaths per 100,000 people, Oakland County had 62, and Macomb County had 53.

The number of new COVID deaths reported in Detroit on April 16 was nearly three times higher than those reported in Wayne, Oakland or Macomb counties. On April 16 there were 71 new COVID deaths in Detroit, 26 in Wayne County (excluding Detroit), 28 in Oakland County and 24 in Macomb County. Monroe County reported 0 new deaths.

Detroit and Wayne County continue to remain the epicenter of the virus. When looking at the entire state, only one county in the Lower Peninsula has not reported any coronavirus cases and that is Benzie County (near Traverse City). The spread has not stopped, and in areas such as Detroit and Wayne and Macomb counties it doesn’t appear to have slowed much. Oakland County though has reported a decrease in the number of new daily cases for the last few days, and the number of new daily deaths has remained stagnant for the same time period. In Macomb County, the number of new daily deaths has decreased but the number of new daily cases has continued to increase.

Michigan’s Urban Core Continues to Experience Highest COVID Numbers

The total number of COVID cases in Michigan increased to 28,059 (Chart 1), which was equivalent to 281 cases per 100,000 people (Chart 2) on April 15. Of those total COVID cases, the City of Detroit had 7,236 cases, Oakland County had 5,576 cases, Wayne County (excluding Detroit) had 5,408 cases and Macomb County had 3,792 cases (Chart 3).  The number of confirmed cases in Washtenaw, Livingston, Monroe and St. Clair counties combined totaled 1,484, with Washtenaw County accounting for 798 of those cases,  according to the most recent data from the State.

The daily data highlighted in these posts is from Michigan.gov/coronavirus, where data is updated daily at 3 p.m. Historical data was supplied from covidtracking.com, which republishes COVID data from the State.

In Chart 4 we see that the City of Detroit has consistently had the highest number of COVID cases per 100,000 people, which was a rate of 1,061 on April 15. Oakland County had the second highest rate at 829 cases per 100,000 people and Wayne County (excluding Detroit) had 804 cases. Macomb County had 564 COVID cases per 100,000 people. When looking at Chart 4 we also see that there were per capita increases for every county between April 14 and April 15, but Macomb County had the highest increase in the number of COVID cases per 100,000 people at 32. In Wayne County the rate increased by 30, and it increased by 20 COVID cases per 100,000 people in Detroit between April 14 and April 15.

Chart 5 shows that Detroit, Macomb, Oakland, Wayne and Washtenaw counties experienced decreases in the number of new COVID cases between April 14 and April 15. On April 15, Oakland County reported the highest number of new COVID cases at 212. Wayne County had 203 new cases, Macomb County had 172 and Detroit had 132.

When looking at new COVID cases on a per capita basis, the data shows that Detroit and Macomb County now have the highest rates (Chart 6). According to the data, on April 15 both Detroit and Macomb County had 20 new COVID cases per 100,000 people; Wayne County had 19 and Oakland County had 17.  These four areas had nearly double the number of new COVID cases per capita as those more rural counties in the region (Washtenaw, St. Clair, Monroe and Livingston).

In addition to the raw data of confirmed cases, we also show the percent change in the number of cases reported day-to-day. On April 15 the percent change from April 14 was 3.92 percent, a decrease from the day’s prior change of 5 percent.

Originally, we were reporting the day-to-day percent change in the number of cases from March 16. However, there was a spike in the number of tests available early on that made this data set also spike (on March 18 the day-to-day percent change as 320%). We have now started showing percent change data from March 21 forward to allow readers a more precise visual. If you would like to see the earlier versions of this data set please review our earlier posts. 

It was reported by the State of Michigan that on April 14 the total of COVID-19 deaths reached 1,921. This was a percent change of 8.6 percent from April 15, which was a decrease from the 10.4 percent increase of the day prior (Chart 9). The 1,921 total deaths reported for April 15 was 153 deaths higher than what was reported on April 14 (Chart 10). The new deaths reported on April 15 was a decrease from the 166 new deaths reported on April 14.

Of the total deaths reported, Detroit continues to make up the majority of them. On April 15, the Michigan Department of Health and Human Services reported 475 total deaths in Detroit-the highest total number of deaths in one city or county in the state. However, also on April 15 Wayne County, excluding Detroit, broke 400-the county now has 409 COVID deaths. Additionally, there were 392 deaths in Oakland County and 332 deaths in Macomb County (Chart 11).

On a per capita basis, per 100,000 people, Detroit also continues to have the highest number of deaths per 100,000 people at 71 (Chart 12). On April 15 Wayne County had 61 COVID deaths per 100,000 people, Oakland County had 58 and Macomb County had 49.

At 48 Detroit had the highest number of new COVID deaths on April 15, and Macomb County had the second highest at 37. Wayne County continued to experience a decrease; it reported 16 new COVID deaths on April 15.

COVID deaths in Michigan continue to rise and the data is showing that some areas, such as Macomb County, are now reporting higher daily new cases and deaths. This shows that the virus continues to spread from the urban core-Detroit-and outward. The data also reflects that the more rural counties in the region are experiencing much lower case and death numbers. However, the risk of spread is still very real which is why everyone must remain home.

COVID Death Still Steadily Climbing in Michigan

The total number of COVID cases in Michigan increased to 27,001 (Chart 1), which was equivalent to 270 cases per 100,000 people (Chart 2) on April 14. Of those total COVID cases, the City of Detroit had 7,004 cases, Oakland County had 5,364 cases, Wayne County (excluding Detroit) had 5,002 cases and Macomb County had 3,620 cases (Chart 3).  The number of confirmed cases in Washtenaw, Livingston, Monroe and St. Clair counties combined totaled 1,471, with Washtenaw County accounting for 772 of those cases,  according to the most recent data from the State.

The daily data highlighted in these posts is from Michigan.gov/coronavirus. Historical data was supplied from covidtracking.com, which republishes COVID data from the State.

In Chart 4 we see that the City of Detroit has consistently had the highest number of COVID cases per 100,000 people, which was a rate of 1,004 on April 14. Oakland County had the second highest rate at 797 cases per 100,000 people and Wayne County (excluding Detroit) had 774 cases. Macomb County had 538 COVID cases per 100,000 people.

Chart 5 shows that Detroit experienced a decrease in the number of new daily confirmed cases from April 13 to April 14 while Wayne, Oakland and Macomb experienced increases. Wayne County had the highest number of new cases on April 14 at 338, followed by Oakland County with 291 new cases. Detroit reported  223 new cases on April 14, a decrease from the 279 new COVID cases reported on April 13. Macomb County reported 202 new cases on April 14.

When looking at new COVID cases on a per capita basis, the data shows that Detroit continues to have the highest rates (Chart 6). According to the data, on April 14 Detroit had 33 new COVID cases per 100,000 people and Wayne County had 31. Oakland and Macomb counties each had 23 new COVID cases per 100,000 people on April 14.

In addition to the raw data of confirmed cases, we also show the percent change in the number of cases reported day-to-day. For Michigan, the largest percent change thus far reported was on March 19 at 320 percent-this increase was also likely related to an increase in  the number of available tests at that time. On April 14 the percent change from April 13 was 5.33 percent, an increase from the day’s prior change of 4 percent. Recall that the state has reported that new tests are being implemented, so this increase could be a result of this. Test more; find more cases.

It was reported by the State of Michigan that on April 14 the total of COVID-19 deaths reached 1,768. This was a percent change of 10.4 percent from April 13, which was an increase from the 7.7 percent increase of the day prior (Chart 9). The 1,768 total deaths reported for April 14 was 166 deaths higher than what was reported on April 13 (Chart 10). The new deaths reported on April 14 was the second day of increases; both April 13 and April 14 had more than 100 new COVID deaths each day.

Of the total deaths reported, Detroit continues to make up the majority of them. On April 14, the Michigan Department of Health and Human Services reported 427 total deaths in Detroit-the highest total number of deaths in one city or county in the state. Wayne County, excluding Detroit, continued to have a higher number of total deaths than Oakland County. On April 14 there were 393 COVID deaths in Wayne County and 364 deaths in Oakland County (Chart 11). The data shows that number of COVID deaths may be slowing in Oakland County, at least compared to the rate of deaths in Wayne County.

On a per capita basis, per 100,000 people, Detroit also continues to have the highest number of deaths per 100,000 people at 63 (Chart 12). The rate of  COVID deaths in Macomb County has increased by 12 in just the last two days. On April 12 there 32 COVID deaths per 100,000 people in Macomb County and on April 14 that had increased to 44.

Macomb County also had the highest of new daily COVID deaths for April 14 at 53; just two days prior (April 12) 8 deaths were reported for Macomb County. In Detroit there were 31 new COVID deaths, a continued increase since April 12. In Wayne County a decrease in the number of new deaths continued with 28 being reported for April 14. Oakland County had 17 deaths on April 14.

Even though Detroit still has the highest total number of deaths, the increases in deaths in places such as Macomb County highlights that the virus is spreading out of the urban core and into the suburbs.

Despite some saying that Michigan is turning the corner, there is little evidence to this effect. Deaths, our strongest indicator, are still climbing steadily. Bridge Magazine cited Michigan as having the highest number of coronavirus deaths per capita and Deadline Detroit said Michigan has conducted the fewest number of tests per capita. Due to this gap in testing we may see the number of deaths per confirmed case be much greater than other states,  and we anticipate that the number of confirmed cases may rise due to testing but the true infection rate may not be rising or rising as quickly.  Gov. Gretchen Whitmer has recently authorized additional testing criteria and sites and many more will likely be getting tested. 

According to Whitmer, all projections regarding the apex of the curve and when it will flatten are based on social distancing and as many people remaining home as possible. Now is not a time to loosen up on any restrictions you have been following.

Future COVID Testing Availability May Impact Case Numbers in Michigan

Yesterday, Gov. Gretchen Whitmer announced that it appeared the COVID-19 curve may be flattening, but we are not there yet. On April 13 the total number of COVID cases increased to 25,635 (Chart 1), which was equivalent to 257 cases per 100,000 people (Chart 2). Of those 25,635 total COVID cases, the City of Detroit had 6,781 cases, Oakland County had 5,073 cases, Wayne County (excluding Detroit) 4,867 and Macomb County had 3,418 cases (Chart 3).  The number of confirmed cases in Washtenaw, Livingston, Monroe and St. Clair counties combined totaled 1,357, with Washtenaw County accounting for 735 of those cases,  according to the most recent data from the State.

Also, yesterday the State announced additional tests were becoming available, including to those with mild symptoms who have just been told to stay home. As these tests become available there may very well lead to continued upticks in the number of cases. 

In Chart 4 we see that the City of Detroit has consistently had the highest number of COVID cases per 100,000 people. On April 13 Detroit had 1,008 cases per 100,000. Oakland County had the second highest rate at 754 cases per 100,000 people and Wayne County (excluding Detroit) had 724 cases. Macomb County had 508 COVID cases per 100,000 people.

While the total number of cases per capita continues to rise, in Chart 5 and Chart 6 we see that the new COVID cases each day do not consistently increase. On April 13, Washtenaw and St. Clair counties experienced a decrease in the number of new cases, while the other five counties and Detroit experienced increases (Chart 5). Detroit experienced the highest increase at 279 new cases for April 13 and Wayne County had 205 new cases. (The relatively erratic pattern of these data partially reflect variation in how much testing is done and reported on weekends.) The per capita data, Chart 6, shows a similar pattern, with Detroit having the highest per capita for new cases at 41.5 COVID cases per 100,000. Wayne County had 19 new COVID cases per 100,000 people, Macomb County had 18.8 new cases per 100,000 people, and Oakland County had 12.6 cases per 100,000 people.

In addition to the raw data of confirmed cases, we also show the percent change in the number of cases reported day-to-day. The largest percent change thus far reported was on March 19 at 320 percent-this increase was also likely related to an increase in  the number of available tests. Also the 0 percent change on March 28 reflects that the data reported from the day prior did not change; it is unlikely that no new cases were reported that day. On April 13 the percent change from April 12 was 4 percent, an increase from the day’s prior change of 2.6 percent.

It was reported by the State of Michigan that on April 13 the total of COVID-19 deaths reached 1,602. This was a percent change of 7.7 percent from April 12, which was an increase from the 6.8 percent increase of the day prior (Chart 9).** The 1,602 total deaths reported for April 13 was 115 deaths higher than what was reported on April 12 (Chart 10). The 115 new deaths reported on April 13 was an increase in total daily deaths.

Of the total deaths reported, Detroit continues to make up the majority of those deaths. On April 13 the Michigan Department of Health and Human services reported there were 396 total deaths in the Detroit-the highest total number of deaths in one city or county in the state. Wayne County, excluding Detroit, continued to have a higher number of total deaths than Oakland County. On April 13 there were 365 COVID deaths in Wayne County and 347 deaths in Oakland County (Chart 11)

On a per capita basis, per 100,000 people, Detroit also continues to have the highest number of deaths per capita at 59 (Chart 12).

When looking at the total number of daily deaths, Wayne County had the highest for April 13, despite it experiencing a decrease. On April 13, there were 29 new COVID deaths reported in Wayne County and 28 in Detroit. Macomb County had 23 deaths and Oakland County had 18 deaths on April 13.

The overall numbers of COVID cases and deaths continue to rise, but when looking at the new daily cases and deaths the daily changes don’t show a consistent increase. We must remember testing does contribute to this, and numbers may increase regularly due to the additional tests the State announced will soon be available. However, as Gov. Whitmer said, it does appear the curve is starting to flatten, though this pattern is inconsistent even across the counties of Southeastern Michigan.

Michigan’s COVID Cases Have Yet to Consistently Slow Down

On April 12, 2020 the State of Michigan reported 24,638 COVID-19 confirmed cases, which equates to 248 cases per 100,000 in the State of Michigan. Cases continue to rise both in the State as a whole and throughout the counties, but Gov. Gretchen Whitmer anticipates the peak to be reached within the next two weeks. We do see some change in these curves, though this could also occur because of a slowing of testing or test results. Southeastern Michigan, and throughout the State, the City of Detroit continues to have the highest number of COVID cases at 6,502 cases as of April 12, according to the Michigan Department of Health and Human Services. Chart 1 shows the total number of confirmed COVID cases in the State and Chart 2 shows the total number of cases by county and in Detroit. Oakland County had the second highest number of total cases at 4,915; this is 1,587 fewer cases than the City of Detroit. Also according to the State, there were 4,662 cases in Wayne County (excluding Detroit numbers) and 3,254 in Macomb County. The number of confirmed cases in Washtenaw, Livingston, Monroe and St. Clair counties combined totaled 1,285, with Washtenaw County accounting for 716 of those cases,  according to the most recent data from the State.

The three charts below give us a better perspective at what is happening at the county level. Chart 4 shows the total number of COVID cases per capita (100,000 people) by county, the Chart 5 shows the number of new COVID cases per county and Chart 6 shows the new number of COVID cases per capita by county (Detroit numbers are included with Wayne County numbers here). Just as the raw data reflects, the number of COVID cases per capita continues to rise, with Wayne County consistently having the highest number of cases per 100,000 people. On April 12 there were 626 COVID cases per 100,000 people in Wayne County; Oakland County had the second highest number at 382 confirmed cases per 100,000. Livingston County had the lowest number of cases per 100,000 people at 107. Day-to-day changes regarding the new number of cases by county has not followed such a clean increase as was shown in the first chart below. Rather, the new number of cases seem to be a bit more erratic, and this could be a result of testing. For example, Detroit Mayor Mike Duggan has noted within the last week test results slowed down due to a backup. On April 12, Detroit had 116 new confirmed cases , Oakland County had 113, Wayne County (excluding Detroit) had 93 and Macomb County had 90. When looking at this per 100,000, Wayne County (including Detroit) had  51 new cases per 100,000 people, Oakland County had 59 and Macomb County had 47.

Please note in the per capita charts Detroit and Wayne County are combined due to how Wayne County’s population data is expressed. Moving forward we will separate the two for better consistency with the other data we are tracking.

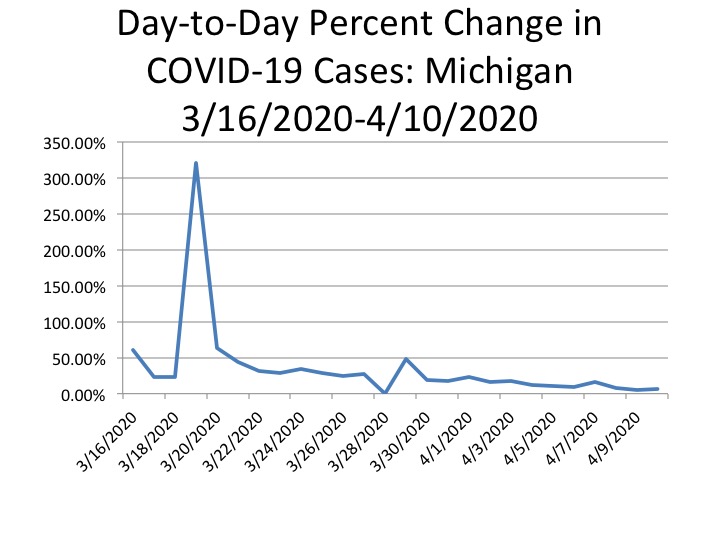
In addition to the raw data of confirmed cases, we also show the percent change in the number of cases reported day-to-day. The largest percent change thus far reported was on March 19 at 320 percent-this increase was also likely related to an increase in  the number of available tests. Also the 0 percent change on March 28 reflects that the data reported from the day prior did not change; it is unlikely that no new cases were reported that day. On April 12 the percent change from April 11 was 2.7 percent, a small decrease the day’s prior change of 5.3 percent. Again, this may be a result of testing backlogs. Next week’s data will show.

It was reported by the State of Michigan that on April 12 the total of COVID-19 deaths reached 1,487 (Chart 8). This was a percent change of 6.8 percent from April 11, which was a decrease from the 8.7 percent increase of the day prior (Chart 9). The 1,487 total deaths reported for April 12 was 95 deaths higher than what was reported on April 11. As shown in Chart 10, the 95 new deaths reported on April 12 was a decrease in total daily deaths; on April 11 there were 111 new deaths, and 205 deaths were reported on April 10 (this was the highest total of new daily deaths yet to be reported). Of the total deaths reported, Detroit continues to make up the majority of those deaths. On April 12 the Michigan Department of Health and Human services reported there were 368 total deaths in the Detroit-the highest total number of deaths in one city or county in the state. Wayne County, excluding Detroit, crept above Oakland County for the second highest number of deaths on April 12 (Chart 11). According to the data, there were 336 COVID deaths in Wayne County and 329 in Oakland County.

On a per capita basis, per 100,000 people, Wayne County has continuously had the highest number of deaths in the region. This data is shown in Chart 12. The Wayne County data does include the number of Detroit deaths too due to how population data is expressed. On April 12 there were 367 COVID deaths per 100,000 people. Oakland County had the second highest number at 171 deaths per 100,000 people.

When looking at the total number of daily deaths, it peaked on April 10 in the City of Detroit at 52, according to the State’s data, while on April 12 it was reported there were 20 new COVID deaths in the City (Chart 13). Wayne County had the highest total of COVID deaths reported on April 12 at 32. These April 12th data may be affected by reporting practices in that some counties may not be reporting on the weekend.

Although the number of COVID cases and deaths in several counties recently decreased for April 12 (not for Wayne County for deaths though) this does not necessarily mean the spread is slowing. Factors such as backlogs on testing, availability of testing and methods of determining cause of death all play a factor in the numbers reported. Additionally, as we have seen with the data before, a single day decrease does not reflect the much anticipated flattening of the curve. This means we must continue to be vigilant in remaining home and cautious when outside of home. This will, hopefully, help lead to a consistent decline in the number of cases and deaths.

April 10 Has Highest Number of COVID-19 Deaths in Michigan

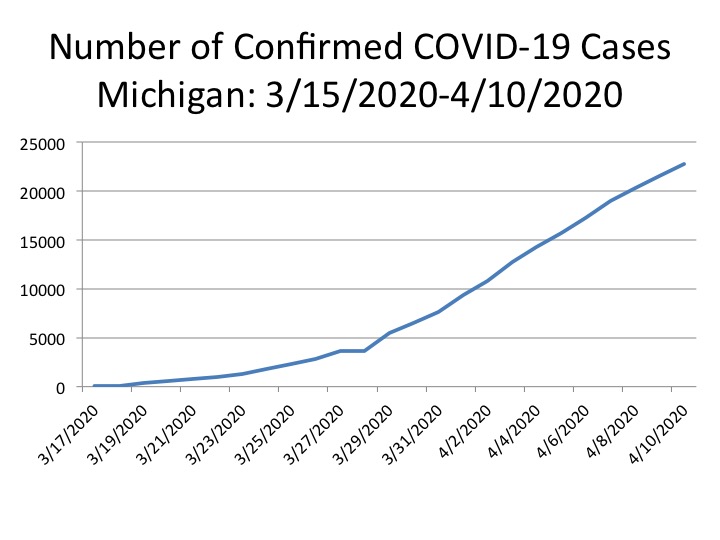
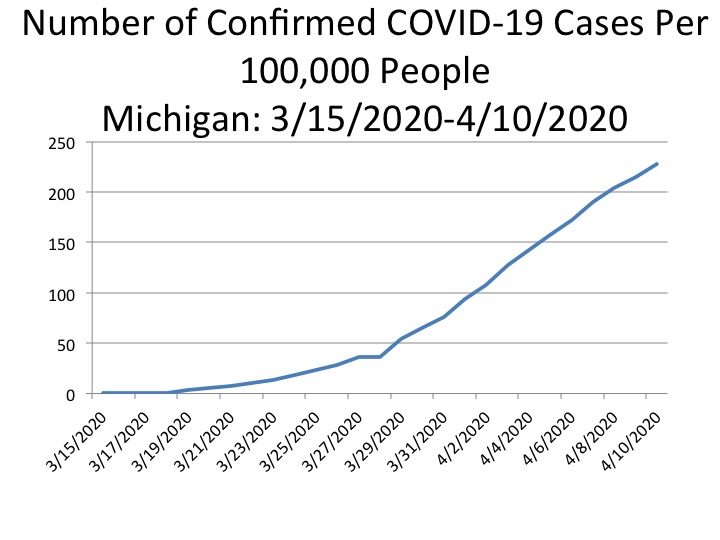
On April 10, 2020 the State of Michigan reported 22,783 COVID-19 confirmed cases, which equates to 228 cases per 100,000 in the State of Michigan. Cases continue to rise both in the State as a whole and throughout the counties. These overall data are reflected in the first two charts. It’s important to note, however, that these data are strongly affected by the lack of testing, which means rates could be much higher.

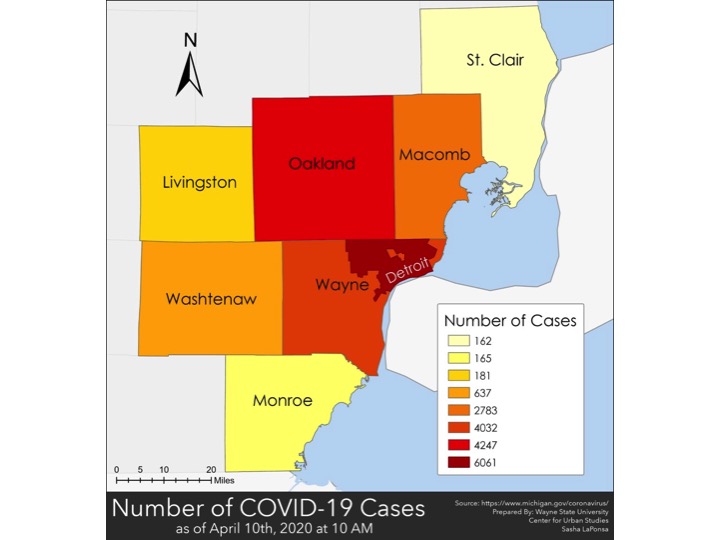
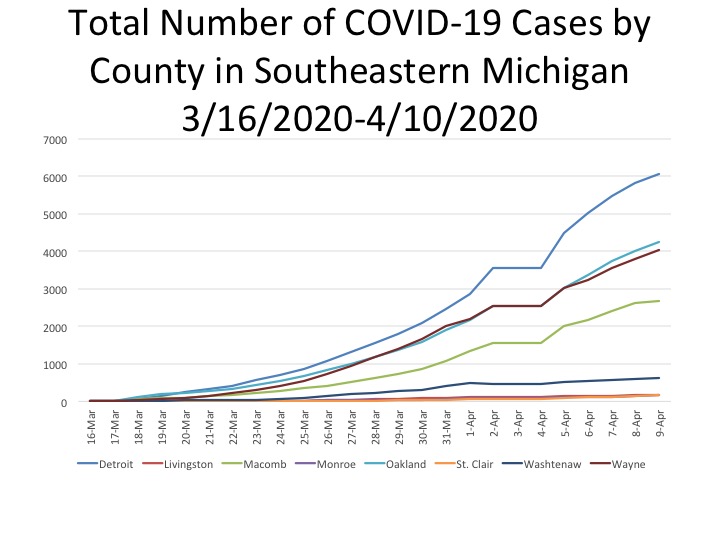
In Southeastern Michigan, and throughout the State, the City of Detroit continues to have the highest number of cases at 6,061 cases as of April 10, according to the Michigan Department of Health and Human Services, which was higher than any number of cases throughout the counties in Southeastern Michigan. Oakland County had the second highest number of total cases at 40,27; this is 1,814 fewer cases than the City of Detroit. Also according to the State, there were 4,032 cases in Wayne County (excluding Detroit numbers) and 2,683 in Macomb County. In total, the number of confirmed cases in Washtenaw, Livingston, Monroe and St. Clair counties combined totaled 1,223, with Washtenaw County accounting for 637 of those cases,  according to the most recent data from the State. These data are represented in the next three charts.

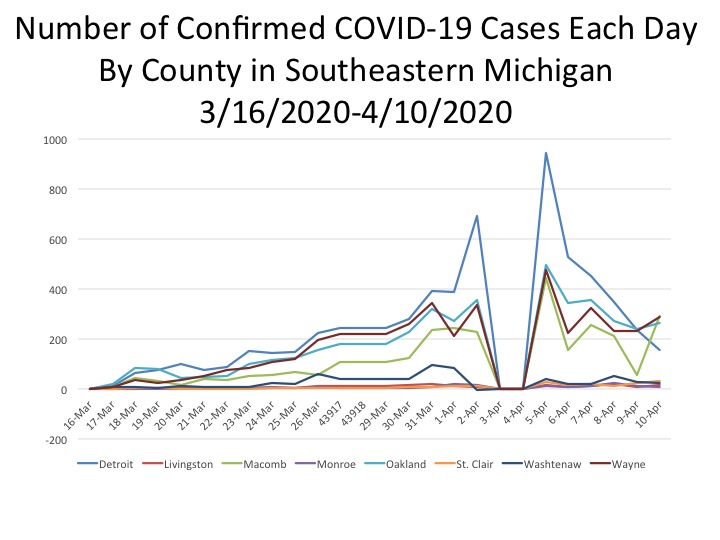
In fifth chart down we show the total number of new cases reported each day at the county level, and for the City of Detroit COVID cases. Please note that these data from the State were likely reported for April 3 was also likely reported on April 4, which is why no change is shown and a “0” for April 4 is shown on the chart. Despite this, April 5 had the highest number of cases reported for the City of Detroit, Wayne (excluding Detroit), Macomb and Oakland counties; 945 case were reported for the City of Detroit that day. Since then, the City of Detroit has experienced a consistent decline in the number of new cases reported each day, while the other Wayne (excluding Detroit) Oakland, Macomb and Washtenaw have experienced small upticks following declines. Again, part of this could be an artifact of the limited testing.

In addition to the raw data of confirmed cases, we also show in the sixth chart the percent change in the number of cases reported day-to-day. The largest percent change thus far reported was on March 19 at 320 percent-this increase was also likely related to an increase in  the number of available tests. Also the 0 percent change on March 28 reflects that the data reported from the day prior did not change; it is unlikely that no new cases were reported that day. On April 10 the percent change from April 9 was 6 percent, a small increase the day’s prior change of 5.23 percent. April 7 was the peak for the day-to-day percent change during this week and that was reported at 16.23 percent.  

The next 6 charts explain the data about deaths. We consider the data on deaths more reliable, given that they are not directly affected by the shortage of tests.

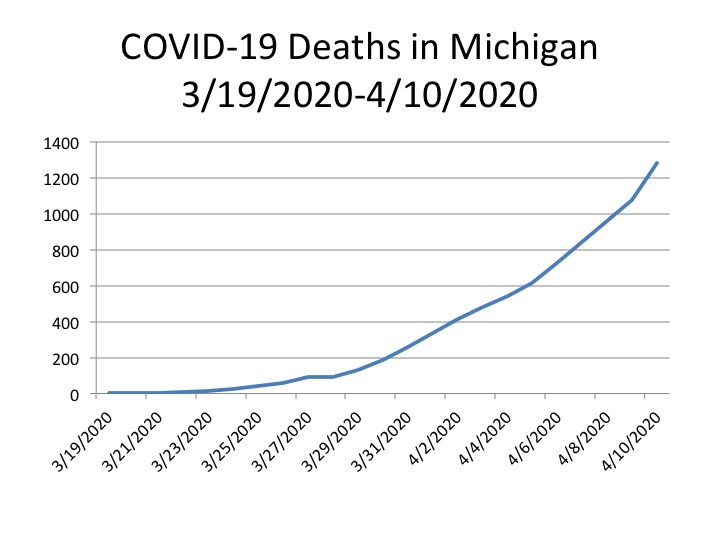
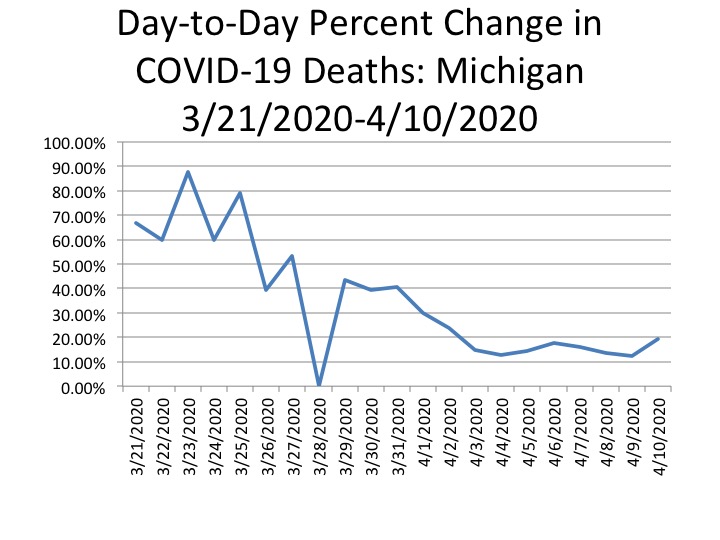
The first chart shows that on April 10 the total of COVID-19 deaths reached 1,281, the highest number of newly reported COVID-19 deaths in the State of Michigan. Percentage changes are reflected in the second chart. There was  a 19.5 percent change from April 9 to the 10th, while the change from April 8th to April 9th was 12.2 percent. The last time the percent change was at 19 percent or higher was on April 2 when it was reported there was a 23 percent change in the number of Covid-19 deaths from the day prior. The third chart below shows the increase in number of deaths by day. The 1,281 total deaths reported for April 10 was 205 deaths higher than what was reported on April 9. On April 9 there were 117 deaths reported by the State for that day, and this number showed a small hope that the deaths were beginning to flatten off. However, Friday’s numbers suggest otherwise.

As shown in the fifth chart below, Detroit reported the highest number of deaths on April 10 at 52, according to the data provided by the Michigan Department of Health and Human Services (the City of Detroit is reporting 54 new deaths for April 10). Wayne County (excluding the City of Detroit) had 53 new deaths on April 10. Oakland and Macomb counties also experienced spikes in new death numbers from the day prior. For Oakland County there were 12 reported deaths on April 9 and 36 on April 10; in Macomb County there were 24 reported deaths on April 9 and 32 on April 10. Also, please note the data from the State was likely not reported for April 3 and April 4, which is why the chart shows such a severe decline; we assume this was an error.

Detroit continues to have the total highest number of COVID-19 deaths in the region, and in the State, according to data from the Michigan Department of Health and Human Services. This is shown in the sixth chart below, which also shows that on April 10 both Oakland and Wayne County (excluding Detroit) had the same number of total deaths, 282.

**Note-the 0 percent change on March 28 reflects that the data reported from the day prior did not change; it is unlikely that no new cases were reported that day.**

Yesterday we noted that with cautious optimism there was a glimmer of hope that COVID-19 cases may have been leveling off. The April 10 data showed that in some counties-Wayne, Oakland and Macomb-there was an uptick in the number of cases but in Detroit the total number of new cases per day has been on the decline. However, the total number of deaths reported on April 10 showed a different story. April 10 was the day in which the highest number of single day deaths were reported for the State, Detroit, Wayne, Oakland, Macomb an Monroe counties.

Use Cautious Optimism as New COVID Cases Level Off

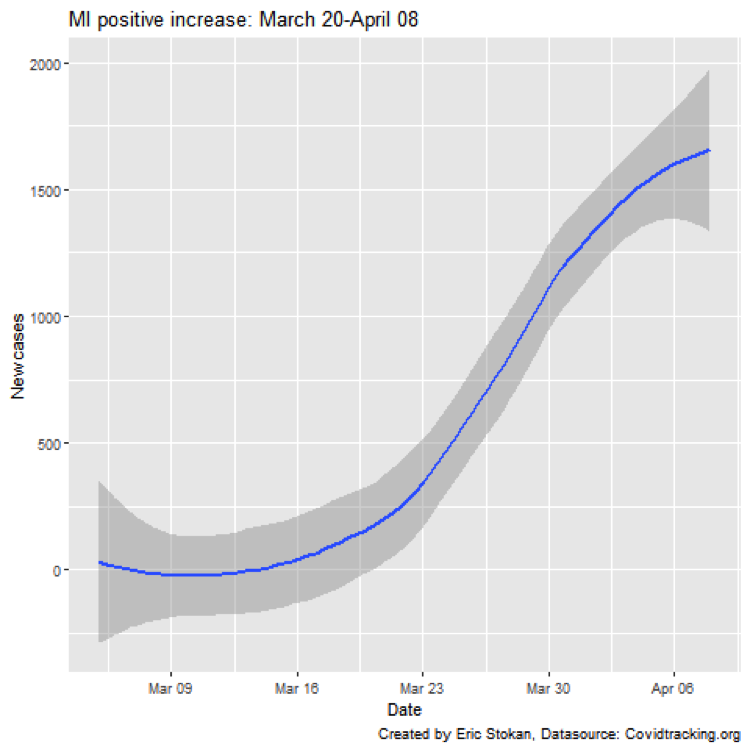
As we continue to monitor the situation in the Metro-Detroit area we are cautiously optimistic that social distancing is helping reduce the number of new COVID-19 cases.  Like many other areas around the state, country, and world , Metro-Detroit experienced an exponential growth rate in new cases.  According to the New York Times, The Metro-Detroit area is second only to New York City in confirmed cases. Following Gov. Gretchen Whitmer’s Stay at Home Order being issued on March 23, we may be seeing a slowing trend in the number of new cases.  This is positive, but we should be cautious.  There are still many infected people who are unaware they are infected, and could easily spread the virus if the State and city lift restrictions too early or too aggressively.  On April 9 Whitmer extended the Stay at Home Order for the State with the intent to continue to try to flatten the curve. 

First, we see that the number of new cases across the State is beginning to level off.  We utilize Covidtracking.org as the source of collected data- which is reported by the Michigan Department of Health and Human Services (MDHHS) daily.  One note, because on the last two Fridays and Saturdays the numbers were simply repeated we used a linear interpolation (averaging growth between those two days) in the data series to get a clearer sense of what is happening in the state.  We care a lot about the policy responses at the Wayne State Center for Urban Studies and are in the process of analyzing government responses across the 50 states and Washington DC to see how we can help slow, and eventually stop, the spread of the coronavirus.

Despite this potential levelling of new cases in many areas, we need to continue forcefully exercising our social distance to the extent that we can.  This is vitally important, and our actions do not simply impact our probability of contracting the virus it can be the difference between life and death for many populations.  The Jacob France Institute at the University of Baltimore, through the National Neighborhood Indicator’s Partnership, recently estimated that for each additional week we stay home we save 378 lives and if we stayed home for 60 full days we would 2,713. 

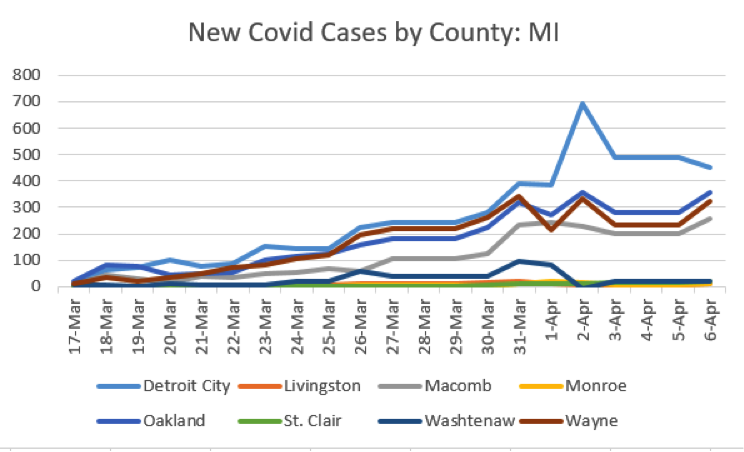
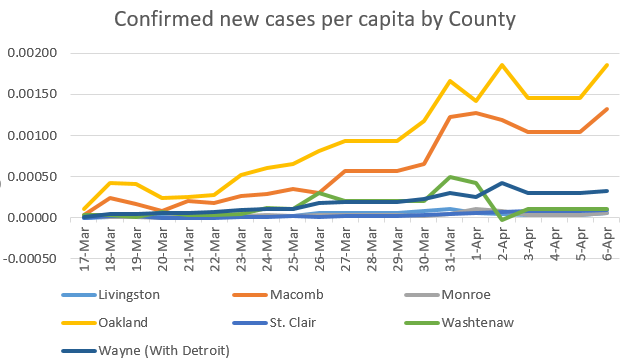
We know that the disproportionate number of cases in the State are in the Metro-Detroit area.  It’s worth noting that this metropolitan area experienced many of the first cases and a very rapid rise, and while the region is slowing we are still seeing an uptick in cases in Wayne County (outside of Detroit), Macomb, and Oakland.  We use MDHHS for these data as well. 

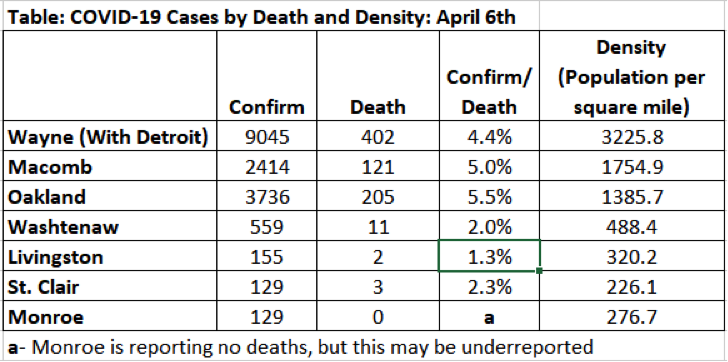
Finally, we know density matters regarding the spread.  In the following table we see that there is a tendency for the number of confirmed cases, death rates and deaths per confirmed case to rise with population density. This may be a function of the health care system becoming too overwhelmed as the total number of cases rises.