Between 2009 and 2014, poverty levels in the region’s urban communities, such as Detroit, Pontiac and Highland Park, increased, just as they did for some of their suburban neighbors. One might assume that the city of Detroit had the region’s highest percentage of residents living below the poverty level in 2014 due to the amount of press coverage it receives regarding poverty, crime, and various economic indicators. However, the city of Hamtramck, an immediate neighbor to Detroit, actually had the highest percentage of residents living below the federal poverty level in 2014.
This post will examine the percent of residents throughout the region below the poverty level in 2009 and 2014. Both the change in percent and concentration will be shown with various maps. For reference, according to the U.S. government, the Federal Poverty Level (FPL) in 2014 for a family of four was $23,850; in 2009 the FPL was $22,050 for a family of four.
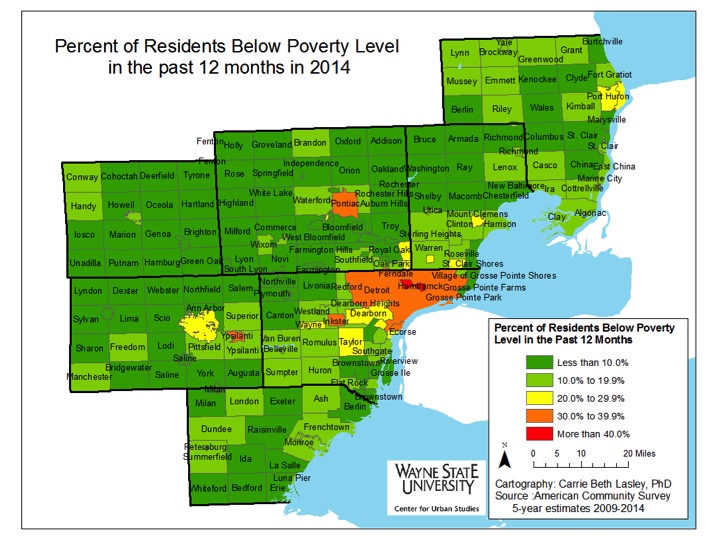
In 2014, the cities with 30 percent or more of residents living below the poverty line were:
- Ypsilanti: 30.6%
- Inkster: 37 %
- Pontiac: 37.8%
- Detroit: 39.4%
- Highland Park: 47.6%
- Hamtramck: 48.5%
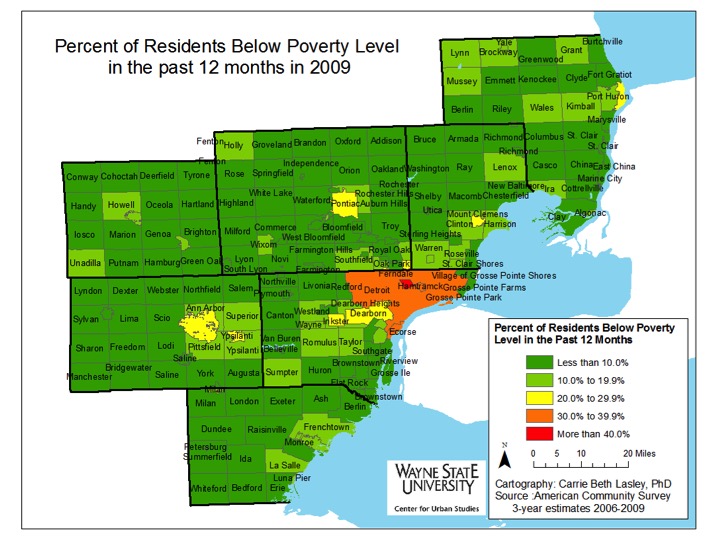
As mentioned above, in 2014, the city of Hamtramck had the highest percentage of individuals living below the poverty line at 48.5 percent; in 2009, that number was 38.4 percent. In the city of Detroit, the percentage of individuals living below the poverty line increased from 33.2 percent in 2009 to 39.4 percent in 2014.
Each county within the Southeastern Michigan region, with the exception of Livingston County, experienced an increase in the number of communities with a higher percentage of residents living below the poverty line between 2009 and 2014. For example, in 2009, a majority of St. Clair County had less than 10 percent of its residents living below the poverty level, but by 2014 that shifted to between 10-19 percent of residents. There were some communities within that county, though, such as Fort Gratiot and Port Huron Township, which experienced a decrease in the percentage of people living below the poverty level. The higher poverty levels in St. Clair County shifted to the more rural area (the northern part of the county) and to the waterfront communities. Overall, the percentage of individuals living below the poverty line in St. Clair County in 2014 was 15.2 percent.
Another visible increase in the percentage of residents living below the poverty level was in the southern portion of Macomb County. Here, cities such as Eastpointe, Sterling Heights, Center Line and Utica all went from having less than 10 percent of their populations living below the poverty level to between 10 to 19 percent of the populations living below the poverty level. For Eastpointe, just under 10 percent of the population lived below the poverty level in 2009 and in 2014 that percentage increased to 23.5 percent. In Sterling Heights, 7.9 percent of the population lived below the poverty level in 2009, and in 2014 that number increased to 13 percent. Macomb County’s overall poverty rate was 12.2 percent in 2014.
The increase in the percentage of individuals living below the poverty line took place in Wayne County as well, with Redford, Flat Rock, Inkster, Wayne, and the southwest portion of the county all experiencing visible changes. Overall, Wayne County had a poverty rate of 24 percent in 2014.
While several communities throughout the region did experience an increase in the percentage of residents living below the poverty line there were, as noted above, some that experienced a decrease. For example, in 2009, 10.5 percent of the population in Howell Township in Livingston County lived below the poverty line and in 2014 that number was 4.6 percent.
Among the counties in Southeastern Michigan, Livingston County had the lowest percentage of individuals living below the poverty level in 2014 at 5.4 percent. The percentage of individuals living below the poverty level in Oakland County in 2014 was 9.9 percent and in Monroe County it was 11.8 percent.
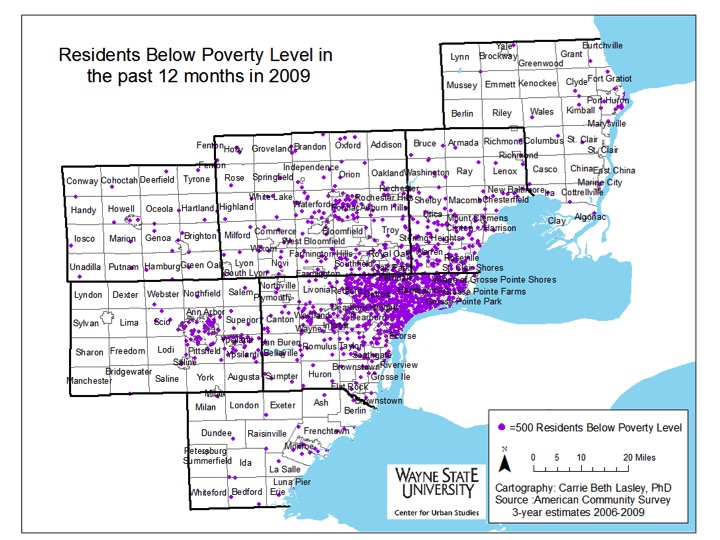
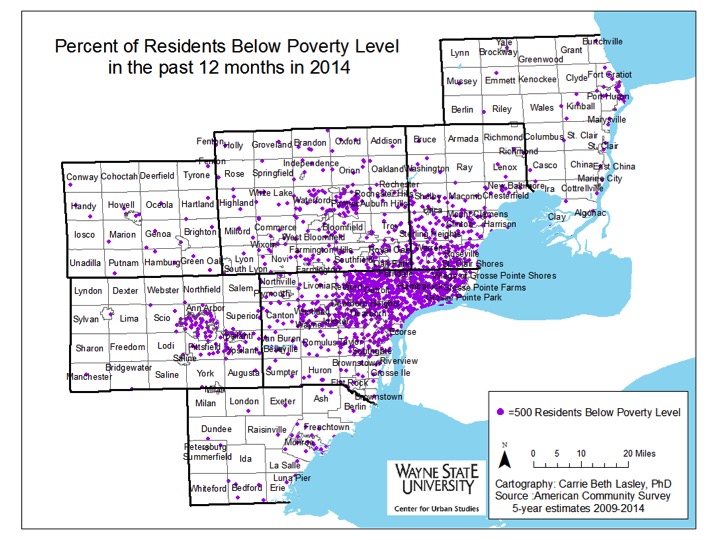
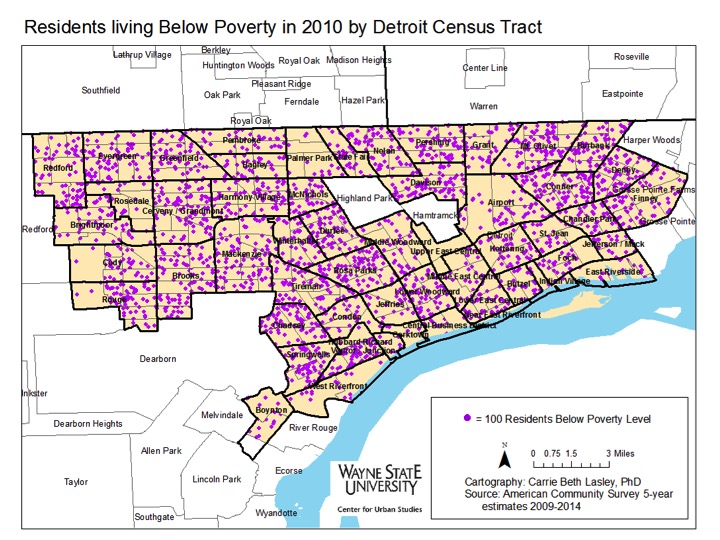
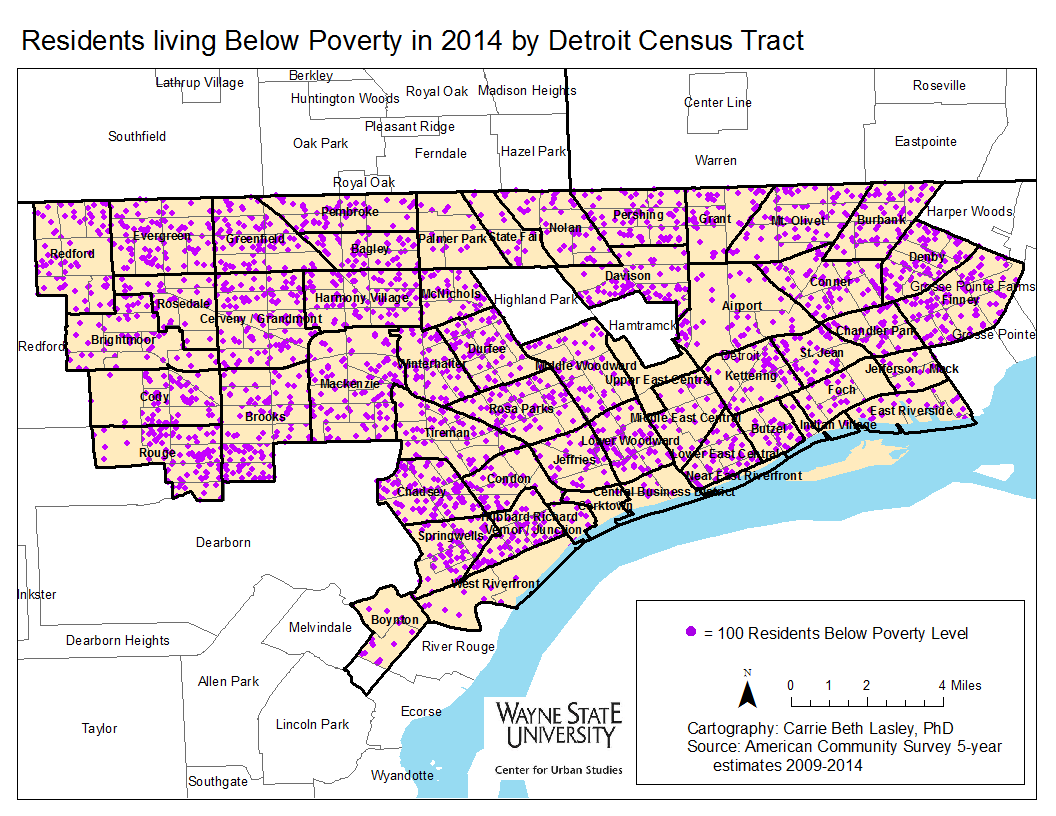
Poverty, while being largely concentrated in the city of Detroit, has shifted outward toward the suburbs between 2009 and 2014, as illustrated above. In Wayne County, areas of Detroit, such as downtown, have experienced decreases in the percentage of individuals living below the poverty line while places such as Westland, Romulus and the western portion of the county have experienced an increase. To the north of Detroit, communities in southern Macomb County, such as Eastpointe, and in southeastern Oakland County, such as Hazel Park and Oak Park, have also experienced an increased percentage in the number of residents living below the poverty line.
Ann Arbor, while not experiencing a shift the magnitude of Detroit’s, has also seen its populations living below the poverty levels shift to nearby areas like Pittsfield and Scio. Additionally, in Ann Arbor, poverty concentration has decreased in the northeastern portion of the city and dispersed throughout the entire city.
While the region has experienced a slight shift and a clear growth in concentrated poverty, this isn’t an uncommon trend for other metropolitan areas throughout the Midwest region. According to “Architecture of Segregation: Civil Unrest, the Concentration of Poverty, and Public Policy,” a new study by the Century Foundation, concentrated poverty has spread from within the boundaries of metropolitan cities and into the inner ring suburbs. This has been attributed, in part, to the gentrification and increased taxes of urban communities, which has resulted in the movement of residents who are living below the poverty level to inner ring suburbs with aging infrastructure.
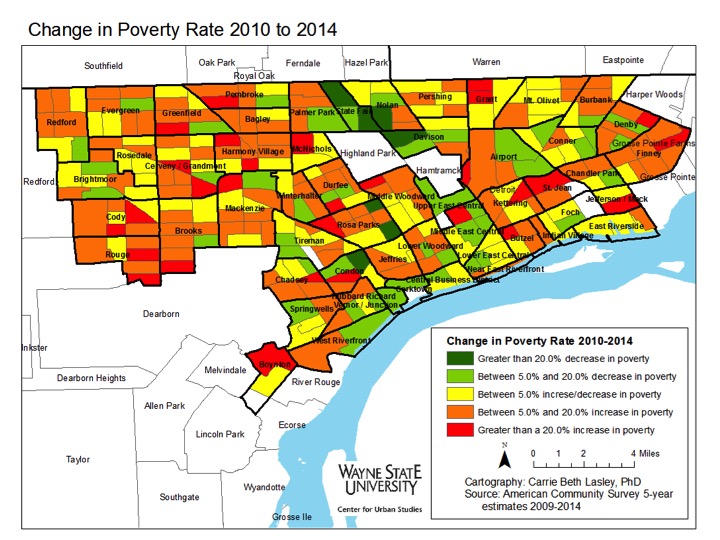
Between 2010 and 2014, pockets of Detroit neighborhoods experienced a decline in the percentage of individuals living below the poverty line while others experienced increases upwards of 20 percent. Concentrations of poverty in Detroit increased in areas such as Cody/Rouge, the neighborhoods bordering Grosse Pointe Farms, along the borders of Hamtramck, and the Southwest neighborhoods of the city.
Only about a dozen census tracts had less than 20 percent of individuals living below the poverty line in 2010. A majority of these census tracts were located on the city’s west side, west of Palmer Park and near Rosedale Park, along with about four bordering the Grosse Pointes on the east side. By 2014, a majority of those census tracts experienced at least a 5 percent increase in the percentage of residents living below the poverty level.
The neighborhoods along Woodward Avenue north of Highland Park, such as Palmer Park and Green Acres, experienced some of the largest decreases in the percentage of individuals living below the poverty level in the city of Detroit between 2010 and 2014. The Midtown, East Riverside, and Corktown areas also experienced decreases in the percentage of residents living below the poverty level.
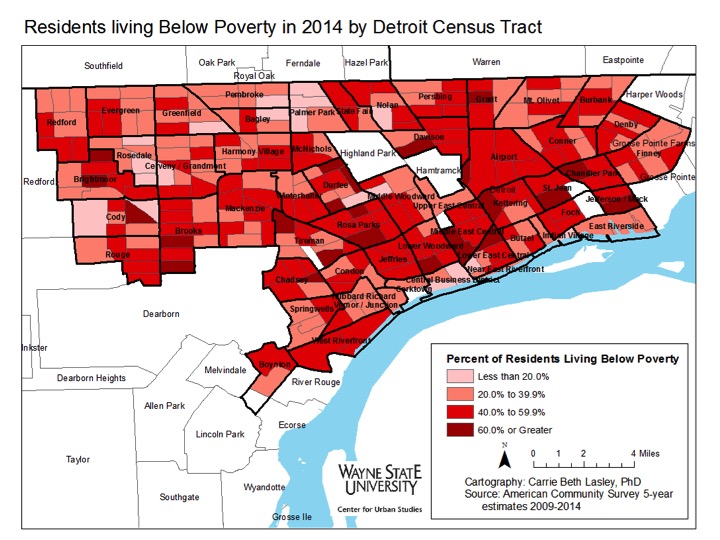
In spite of the positive trends in these neighborhoods, however, high poverty census tracts have dramatically increased in the city of Detroit since 2000, according to the Century Foundation study cited earlier. By 2014, the majority of the census tracts in the city of Detroit had between 40 and 59.9 percent of residents living below the poverty level. As such, even with the improvements made, poverty concentration continues to be a challenge in the city of Detroit.
It is policies, both new and recent, that have helped contribute to the increase in concentrated poverty. From the investment into new infrastructure, rather than fixing what already stands, to urban sprawl and the disproportionate building of homes for the middle class and wealthy to the income increases being felt by the rich, but maintaining stagnant for the poor, there are policies in place that allow the growth of poverty and concentrated poverty to occur.
