Supplemental Security Income (SSI) is administered on a monthly basis by the federal government to the disabled, blind, or those above the age of 65. It is only provided to such recipients in these categories who have a limited income, with the purpose of aiding in the purchasing of food, clothing and shelter (for more info-click here). In 2014, the monthly SSI benefit rate increased to $721 for an individual and $1,082 for a couple; these increases were reflective of an increase in the Consumer Price Index, according to the Social Security Administration. Thus an individual receiving SSI in 2014, would receive an annual income of $8,652.
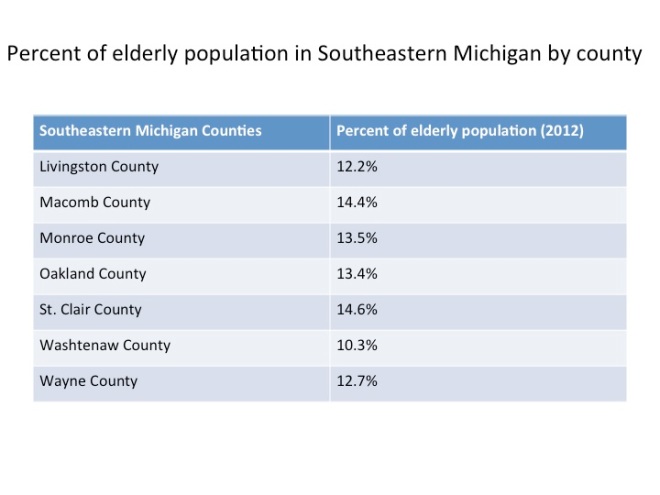
This post examines the percentage of residents who received SSI in 2012 throughout the seven-county region of southeast Michigan. At that time, an individual’s monthly benefit was $698 and a couple’s was $1,048. In examining the percent of residents throughout the region who collect SSI, it is also helpful to understand the percentage of residents age 65 or older in each community and county. To view this information, please click here for our previous post.
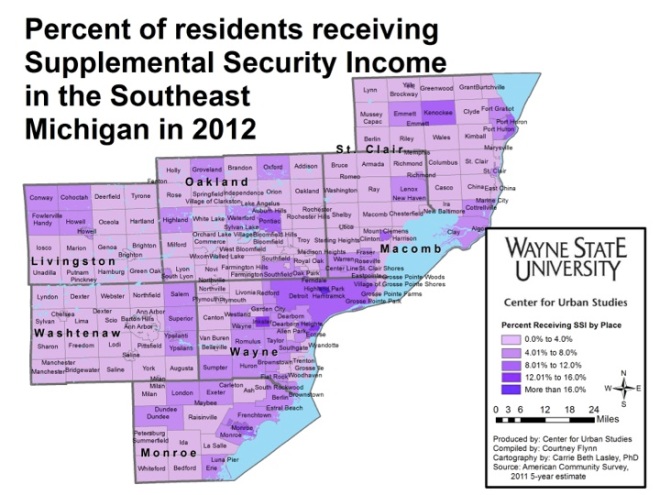
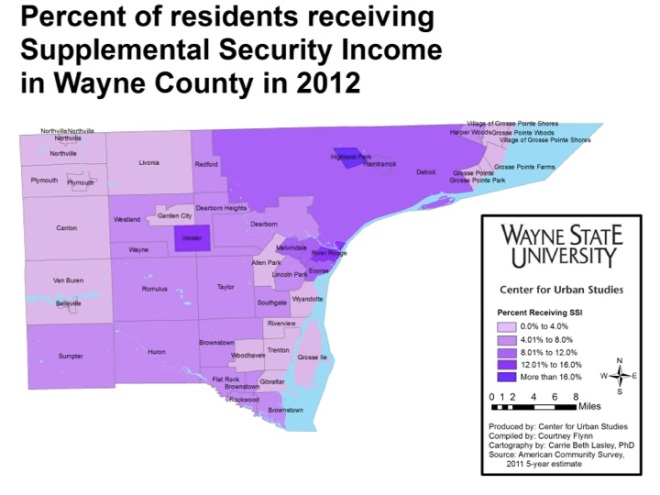
As noted earlier, SSI recipients must be either legally disabled, blind, or above the age of 65, and have limited incomes. The first map shows that Washtenaw County had the lowest percent of residents who received SSI in 2012. There were only four municipalities’ in that county where more than 4.01 percent of the population received SSI checks, and none of those communities had more than 8.01 percent of the population collecting SSI. It is important to note that Washtenaw County also had the lowest population of residents aged 65 or older in 2012. According to American Community Survey data, 10.3 percent of Washtenaw’s County was 65 years of age or older in 2012.
Macomb and St. Clair counties had the highest population of those 65 years of age and above in 2012 at 14.4 percent and 14.6 percent, respectively. However, both of these counties had fewer municipalities with more than 4.01 percent of the population collecting SSI benefits than Wayne County. Macomb had eight municipalities and St. Clair had 10 municipalities with more than 4.01 percent of the population receiving SSI benefits. Wayne County, where seniors comprised 12.7 percent of the population, had 22 communities with more than 4.01 percent of residents receiving SSI in 2012. In St. Clair County, the city of Memphis had the highest percent of residents collecting SSI benefits at 12.8 percent. In Macomb County, Richmond Township had the highest percentage of residents receiving SSI benefits at 5.1 percent.
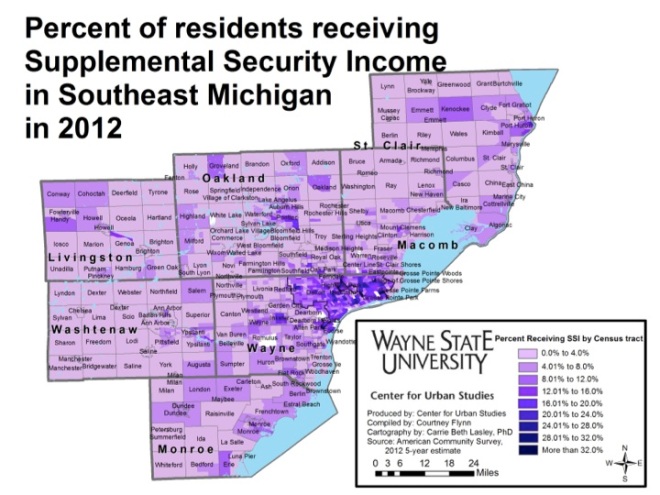
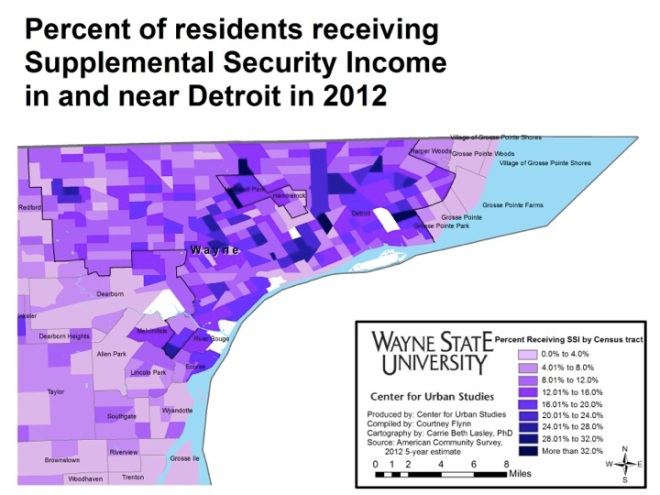
The second map above breaks down the percentage of residents in each community who collect SSI benefits by census tract. For example, in St. Clair County, both the city of St. Clair and Casco Township are split in half with the percent of residents who collect SSI benefits. For both of these municipalities, one half has 4 percent or less of the population collecting SSI benefits while the other half has between 4.01 and 8 percent of the residents collecting SSI benefits. One reason for this may be that those census tracts with a higher percent of the population collecting SSI benefits house facilities such as nursing homes.
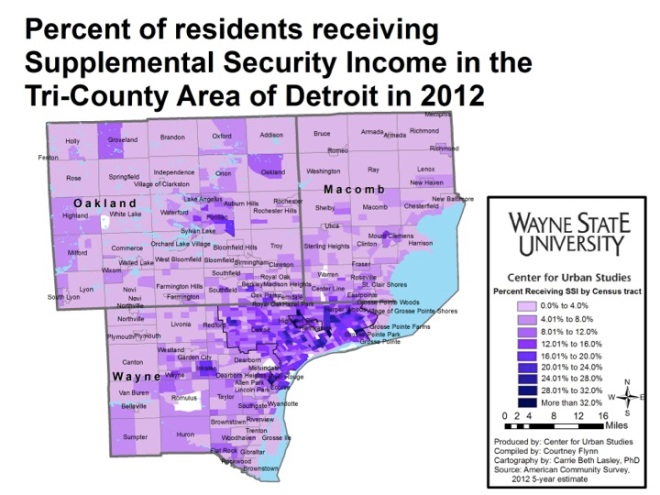
In 2012 in Wayne County, there were five different municipalities where more than 10 percent of the population collected SSI benefits. Highland Park had the largest percentage at 19.2 percent. The City of Detroit was also one of the top five municipalities; 11.9 percent of that population collected SSI benefits in 2012. During that same year, 12.5 percent of Wayne County’s population, 14.3 percent of Highland Park’s population and 11.5 percent of Detroit’s population were 65 years of age or above.
The final map shows the percent of residents receiving SSI in each census tract in Detroit and the surrounding areas. There were five tracts where 32.1 percent or more of residents collected SSI benefits.
