This post is an extension of last week’s (link here), in that we are showing which industries draw the most about of Detroit residents, ages 16 and older, for employment. Here we examine the types of jobs by percentage of the working population in the City of Detroit in 2011, according to the five-year American Community Survey. To learn more about the specific occupations included in the different industries described in this post please click here.
In reviewing the maps, a pattern similar to the region is reflected. The structure of the local economy is based around health care, educational services, social assistance, manufacturing, arts, entertainment, and food service industries.
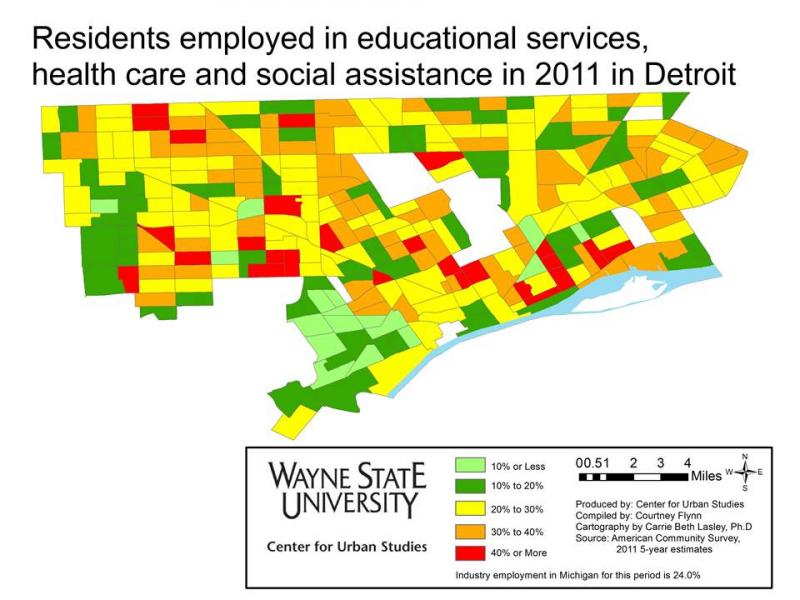
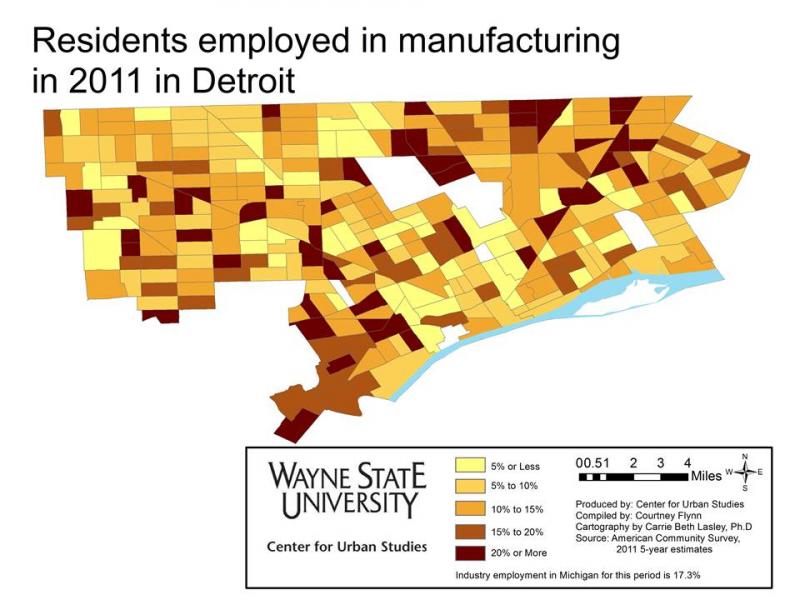
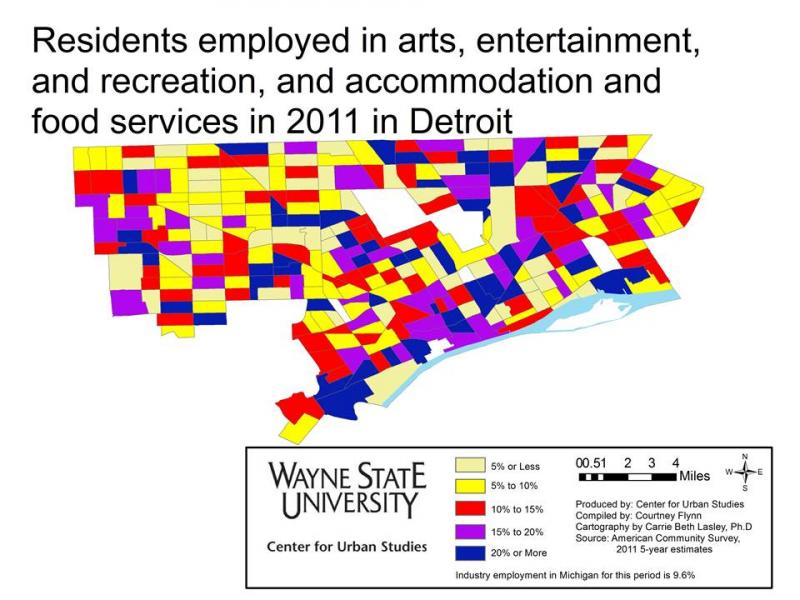
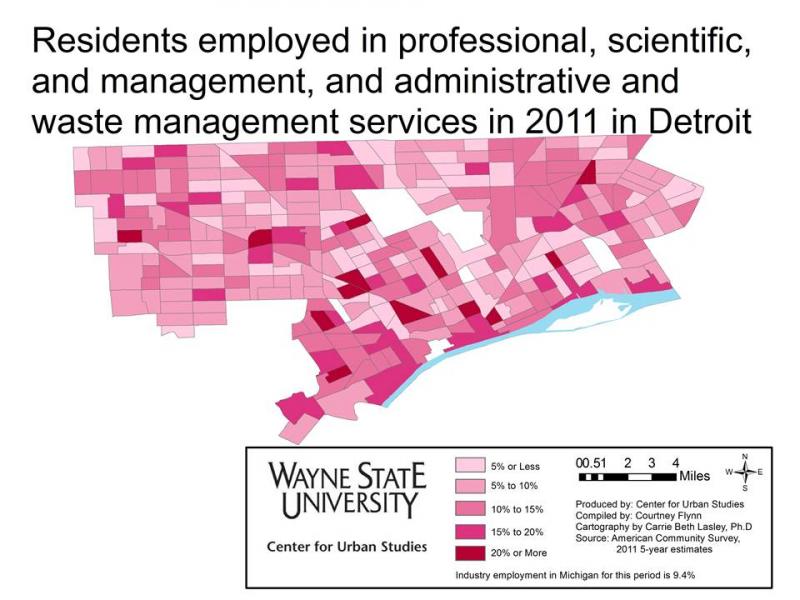
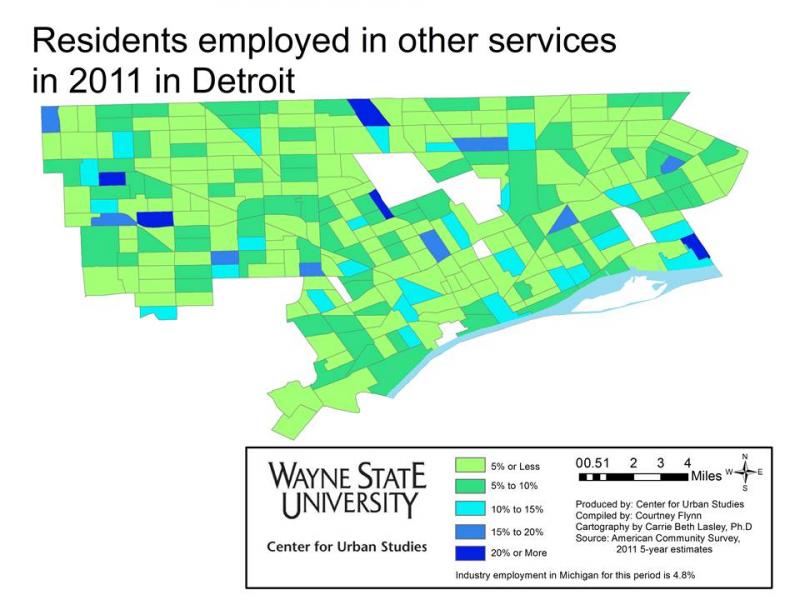
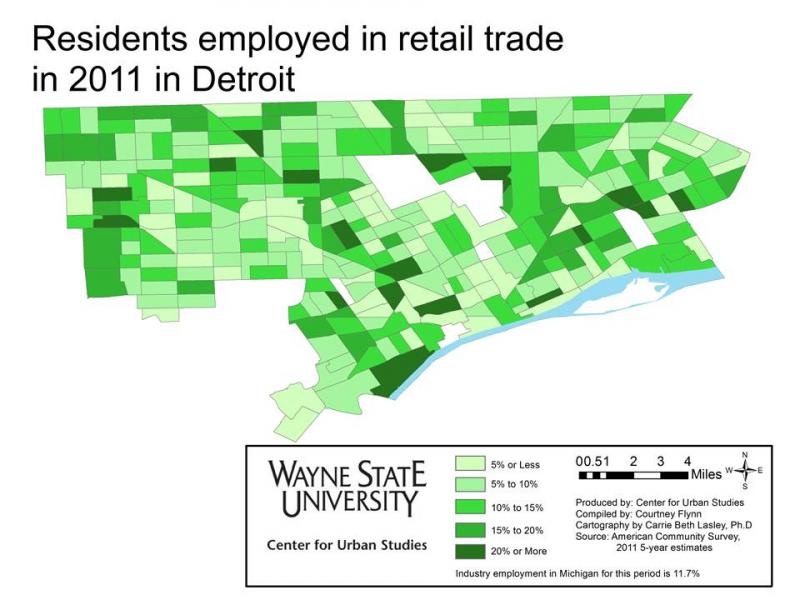
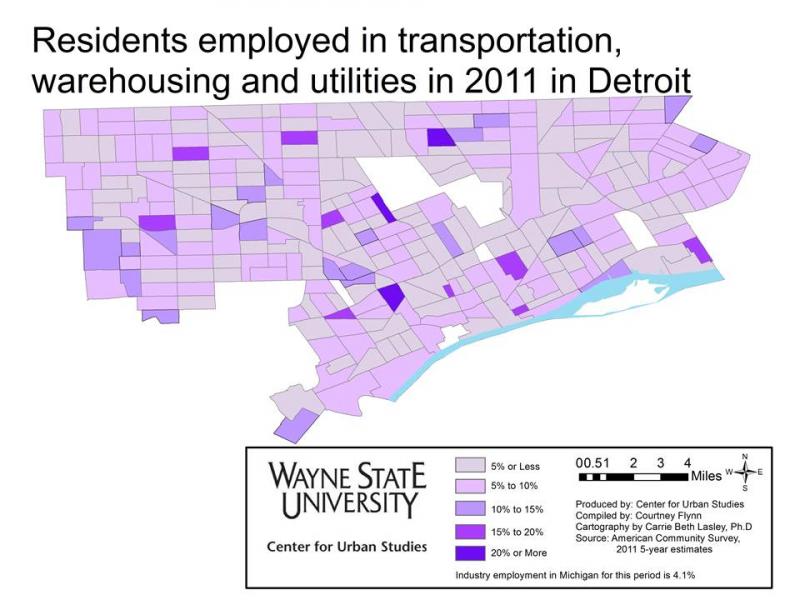
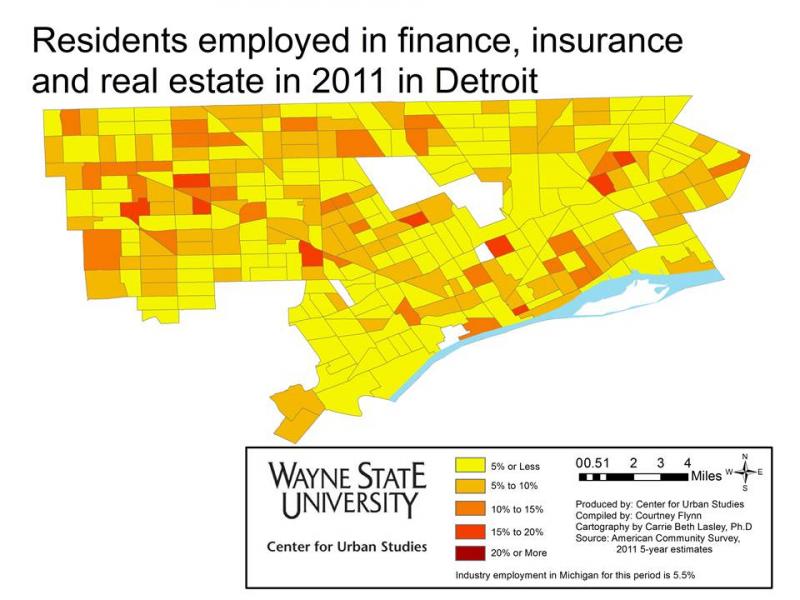
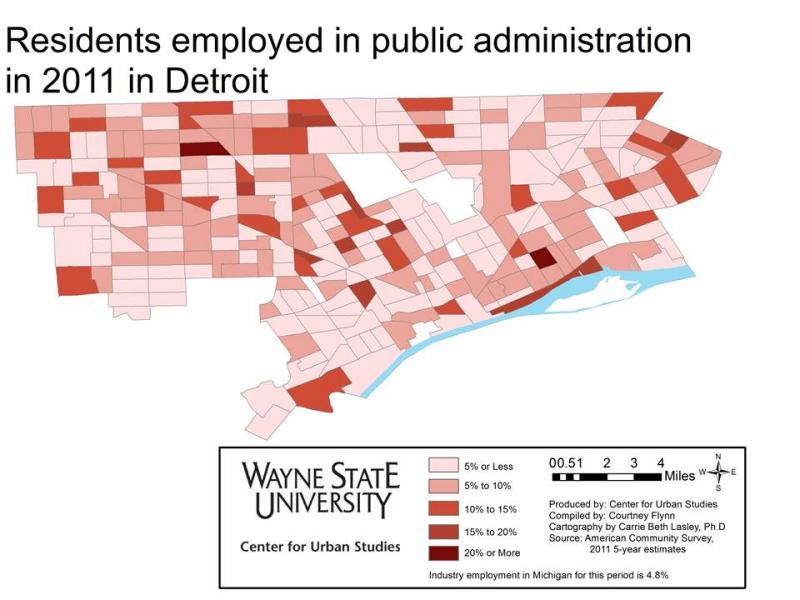
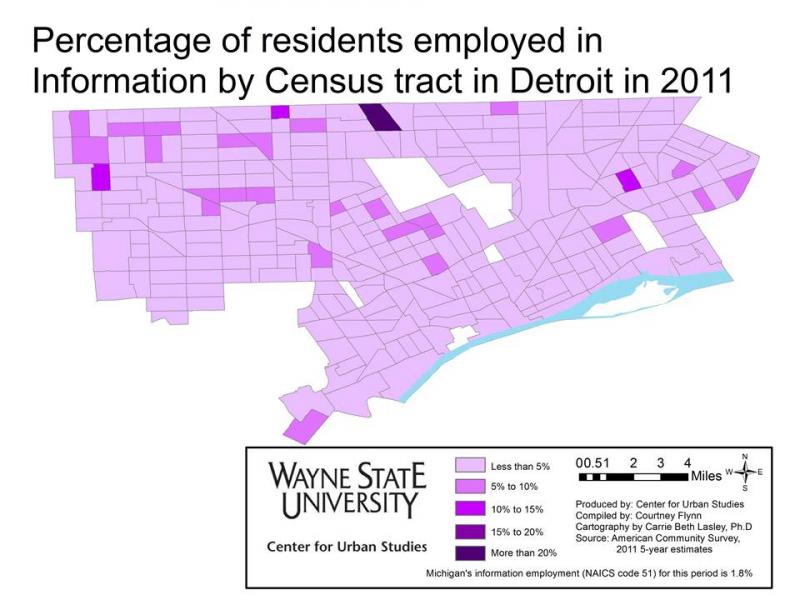
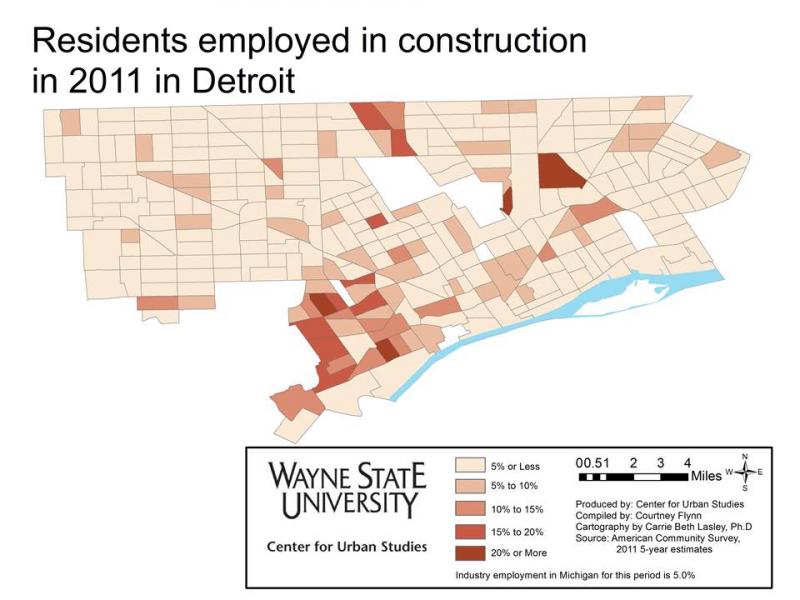
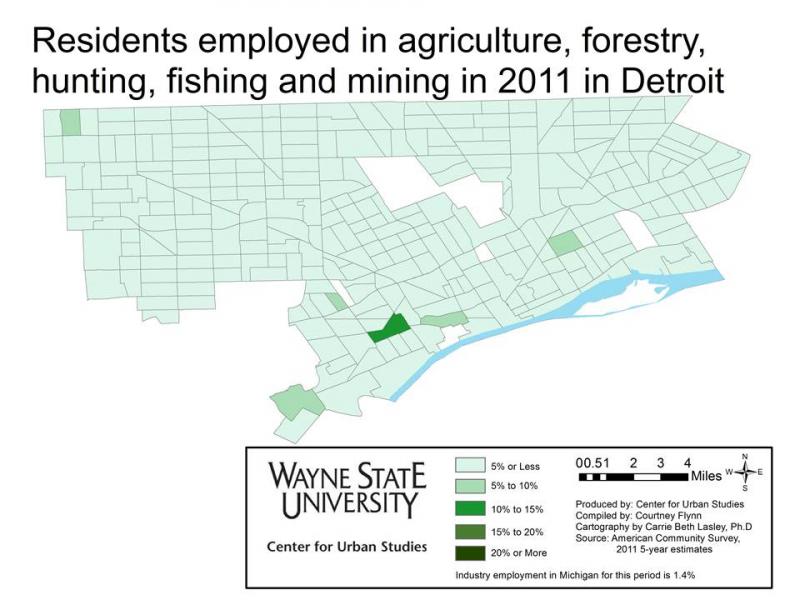
According to the map, in the health care, educational services, and social assistance industries there were about 20 Census tracts that had 41 percent or more of the population employed in these services. There were also about 75 Census tracts where between 30 and 40 percent of the population was employed in these industries in 2011.The other top industries in which Detroit residents were employed in for the year 2011 were the arts, entertainment and recreation, accommodation, and food service industries. There were about 40 Census tracts in the city were 20 percent or more of the residents were employed in these industries. Manufacturing also had a large employment draw in the city; there were about 35 Census tracts within Detroit where 20 percent or more of the 16 years and older population was employed in the manufacturing industry.
Agriculture was the industry with the least amount of Detroit residents employed in it. All but five of the Census tracts had 5 percent or less of the population employed in the industry. The information and construction industries also had low draws. There was a pocket in southwest Detroit though where there was about 15 Census tracts in 2011 with 15 percent or more of the population employed in construction.