Economic Indicators: Unemployment Rates, Housing Costs Remain Higher than Pre-COVID

We are a year into the COVID pandemic, unemployment rates have peaked and then declined, but they are still substantially higher than a year ago. Average home prices have increased as demand for homes has increased. Broader consumption trends though, while they are faring better than nearly a year ago, have yet to fully recover to pre-pandemic levels. Below we show just how these various indicators have changed over the last year.

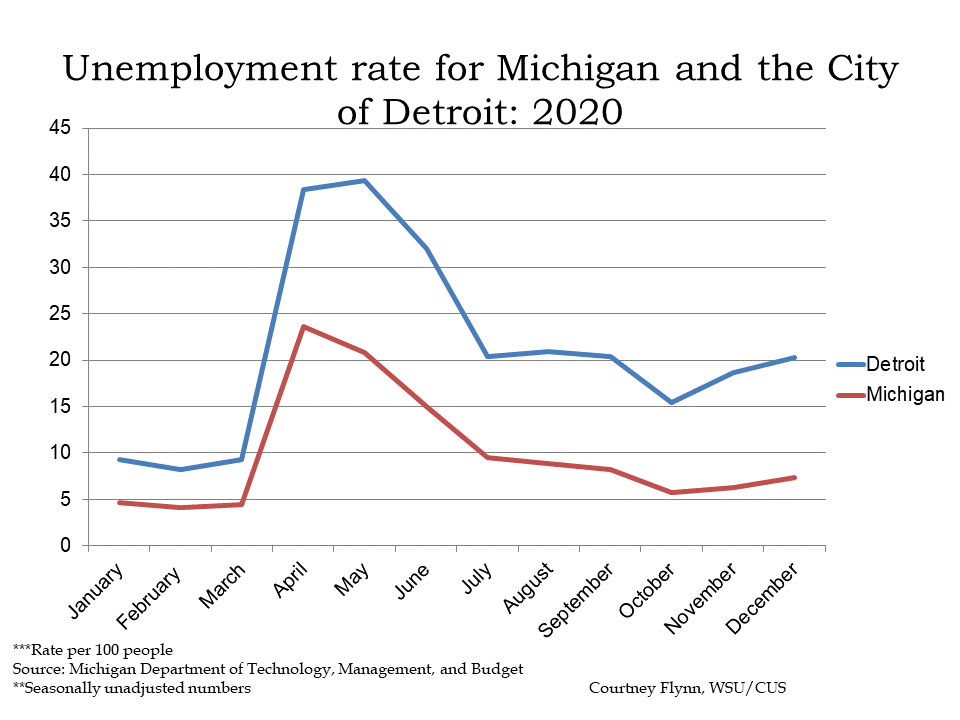
In December of 2020 the unemployment rates for the State of Michigan and for the City of Detroit continued to increase after declines following the initial unemployment spikes due to COVID-19. The State of Michigan reported an unemployment rate of 7.3 in December, a higher rate than what was reported in November, which was 6.3. For the City of Detroit, the unemployment rate for December of 2020 was 20.3, which is higher than the November rate of 18.7. The December unemployment data further highlights how the unemployment gap between the State and Detroit continues to grow wider as the COVID case numbers increased rapidly over the holidays.

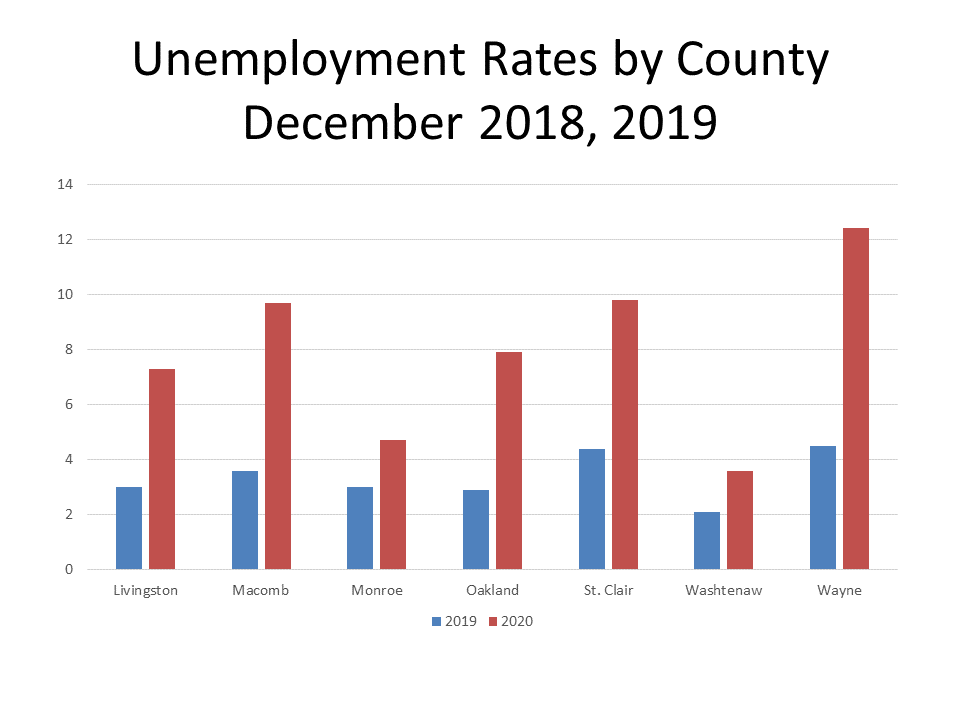
In line with what was reported above, COVID impacted unemployment rates at the county level in Michigan as well. In December of 2020 each county in Southeastern Michigan had a significantly higher unemployment rate than the year prior. According to data from the Michigan Department of Technology, Management and Budget, Wayne County experienced the largest increase at about 8 points. In December of 2020 Wayne County had an unemployment rate of 12.4 and in December of 2019 it was 4.5. Washtenaw County experienced the smallest increase at 1.5 points. In December of 2020 Washtenaw County had an unemployment rate of 3.6 and in December of 2019 it was 2.1. While there were overall unemployment increases, the differences in the unemployment percentages between each county is, at least in part, dependent on the type of jobs available in each county and the occupations of residents. For example, in Wayne County the top occupations are office and administrative support, production and sales and food service. In Washtenaw County the top occupations are office and administrative support, education instruction, health care practitioners and food service workers. Throughout much of the year some positions related to office and administrative support and food service have been considered non-essential or experienced higher layoff rates while those in health care and education have been at less risk of being unemployed.

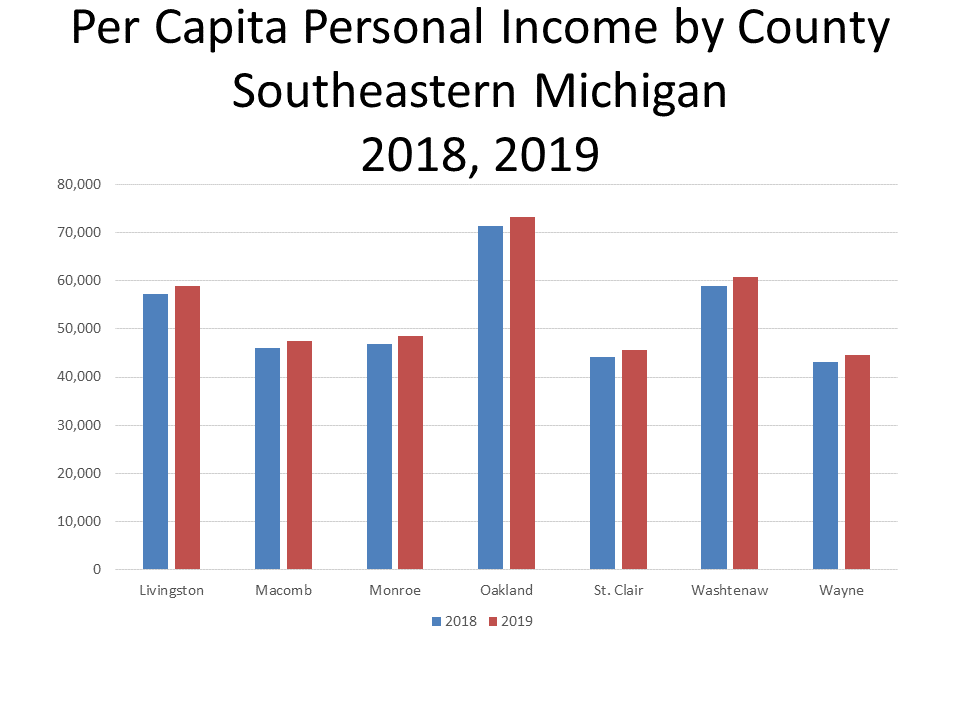
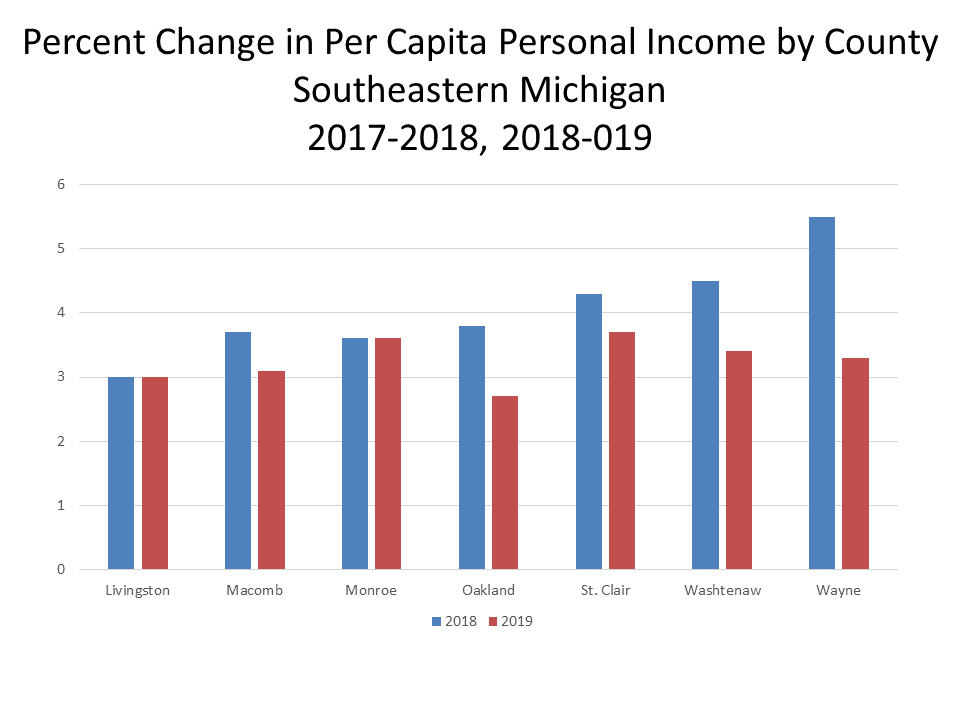
The Bureau of Economic Analysis recently released data on the per capita personal income by county for 2019, showing that overall incomes in Southeastern Michigan did grow between 2018 and 2019. In 2019 Oakland County had the highest per capita personal income at $72,271 but it had the lowest percent change between 2018 and 2019 at 2.7 percent.  Wayne County had the lowest per capital personal income at $44,512 with the percent change from the year prior being 3.3 percent. St. Clair County had the lowest percent change in per capita income between 2018 and 2019 and 2.7 percent; its per capita personal income in 2019 was $45,662.

When examining personal income growth between 2017-18 and 2018-19 the percent change was lowest for the most recent year of data, as opposed to the growth from between 2017-18.

We have yet to know what the impact COVID will have on personal income for 2020, but the data below does show that growth was already beginning to slow down prior to the pandemic. That coupled with higher rates of unemployment, business closures and decreases in spending on goods and services may very well mean lower personal incomes for 2020.

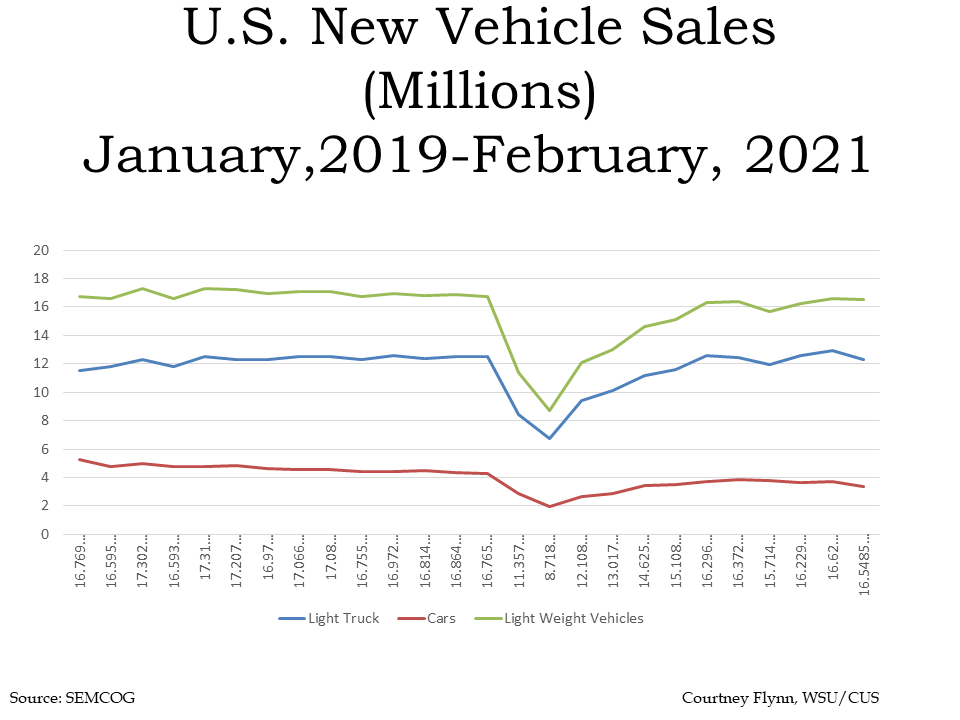
The automobile industry continues to be a driving force in Michigan’s economy and the latest data on vehicle sales show that the number of auto sales for lightweight vehicles has been steadily increasing in recent months while light truck and car sales slightly declined in February of 2021. However, compared to a year ago, sales still remain below what they were. In February of 2021 auto sales for: sales of light weight vehicles were 16.5 million, compared to 16.8 million the year prior; light truck sales were 12.3 million compared to 12.5 million in February of 2020; car sales were 3.4 million, compared to 4.2 million the year prior.

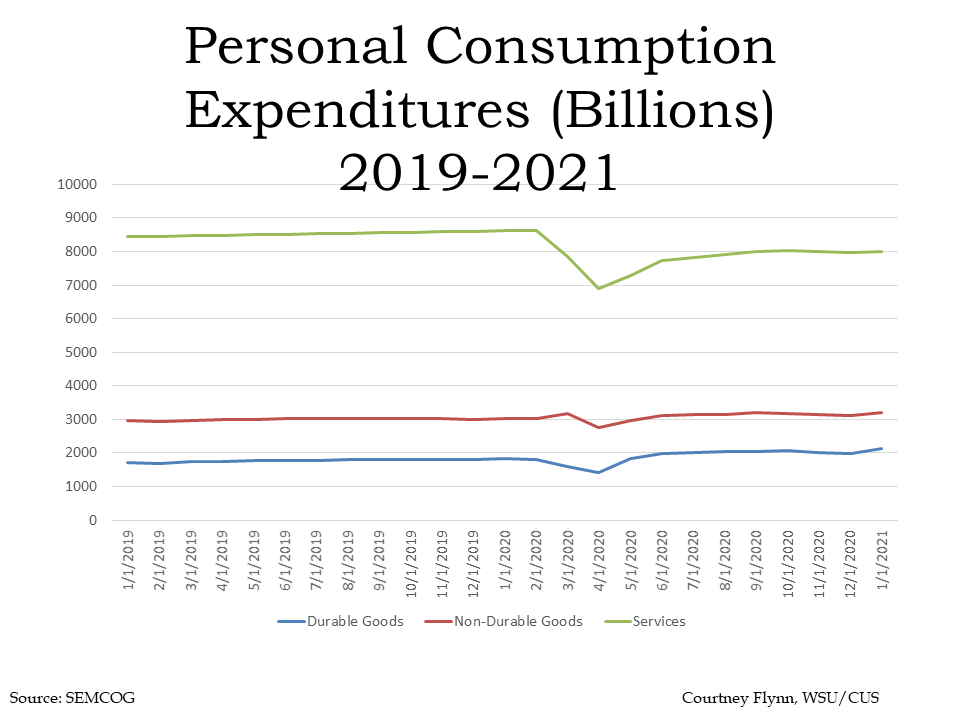
Below shows the consumption expenditures of goods in the U.S. between 2019 and 2021. According to the U.S. Bureau of Economic Analysis, durable goods have an average useful life of at least 3 years (e.g. motor vehicles) while nondurable goods have an average useful life of less than 3 years (e.g. food) and services are commodities that cannot be stored or inventoried and are consumed at the time of purchase (e.g., dining out). The chart below shows how services have yet to make it back to the pre-COVID consumption levels, but the consumption of durable and non-durable goods have risen. In January of 2021 $8,016 billion in services was consumed, $2,148 billion in goods was consumed and $3,206 billion in nondurable goods was consumed.

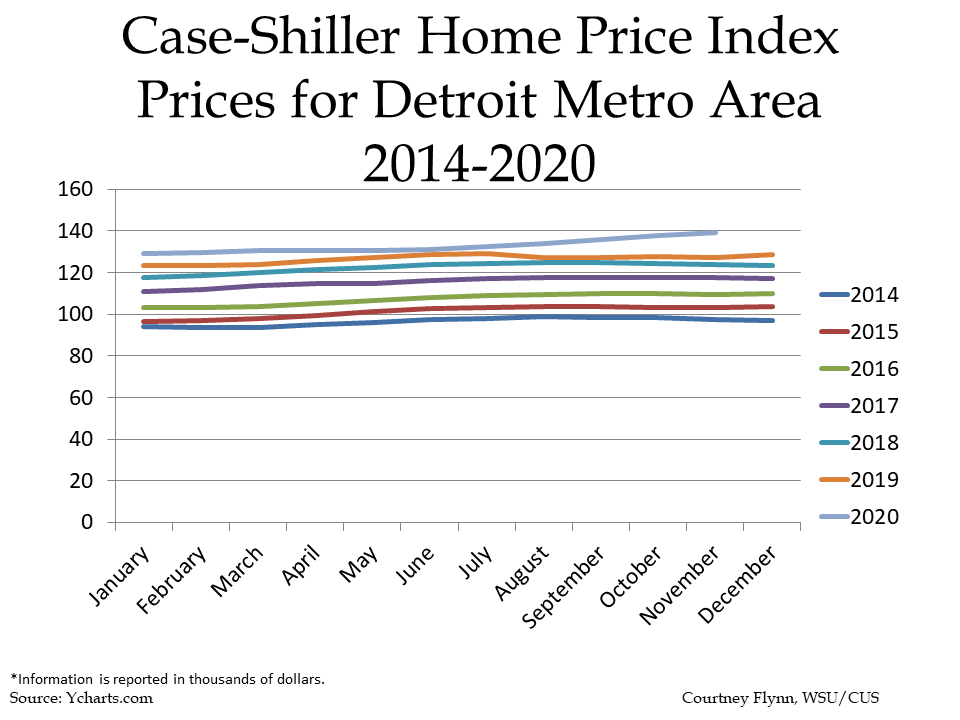
According to the Case-Shiller Home Price Index, the average price of single-family dwellings sold in Metro Detroit was $139,240 in November of 2020; this was $145 higher than the average family dwelling price in October. The November 2020 price was an increase of $11,770 from November of 2019 and $15,200 from November of 2018. So, just as unemployment rates remain higher than what they were a year ago so do average home prices. This is interesting though because with higher unemployment rates traditionally comes lower incomes and hesitation around the housing market. However, during the COVID-19 pandemic, as shown, the average price for a home has been increasing despite higher unemployment rates. Demand for existing homes has been up substantially across the nation over the last year

Commute Times, Mobility Decline in COVID Times

In 2019, before COVID, the average American spent 28 minutes commuting to, or from, their job; in Michigan that average was 25 minutes. However, once the pandemic hit many of us began working from home, which directly impacted mobility to and from workplaces and commute times, presumably. According to a Feb. 23, 2021 report from Google, mobility to places of work in the State of Michigan have declined by 29 percent. At a regional level in Southeastern Michigan mobility has declined even more than the state average since last March. According to the data, mobility declined by the following percentages for the seven counties in Southeastern Michigan from the pre-pandemic baseline:

  • Livingston County: 31 percent
  • Macomb County: 33 percent
  • Monroe County: 22 percent
  • Oakland: 41 percent
  • St Clair County: 15 percent
  • Washtenaw County: 49 percent
  • Wayne County: 35 percent

While mobility data differs from commute data, the fact that people are going to work less means commute times will also decline. Below are two maps showing the average work commute times in 2019 at the municipal and county levels. 

In 2019, the City of Ann Arbor had the lowest average commute time at 20 minutes, according to the American Community Survey, and Clay Township had the highest average commute time at 37 minutes. At the county level, Washtenaw County (where Ann Arbor is located) had the lowest average commute time at 24 minutes and Livingston County had the highest average commute time at 33 minutes. 

When the 2020 commute data is available it will be interesting to see just how many minutes the average commute time declined in Southeastern Michigan, and if that trend lasts for the long-term. Declined commute times and mobility to and from places of work means several things, including less automobile pollution and more time for individuals to participate in leisure activities, perform additional work, do chores or anything else that may be of interest to them. 

Inner-Ring Detroit Suburbs Have Highest Vacancy Rates in 2019

In 2019, Highland Park had the highest vacancy rate in Southeastern Michigan at 34 percent, according to the American Community Survey; the vacancy rate is the percentage of all available units in a rental property, such as a hotel or apartment complex, that are vacant or unoccupied. Clay Township (St. Clair County) had the second highest vacancy rate at 30 percent and Detroit had the third highest rate at 27percent. There were only seven communities in the region with vacancy rates at or above 20 percent; of those communities four were Detroit or an inner-ring suburb (Highland Park, River Rouge and Eastpointe) and the remaining three were outer-ring suburbs (Clay, Burtchville and Lyndon townships). While there were a handful of outer-ring suburbs with high vacancy rates, those with the lowest vacancy rates were all outer-ring suburbs. Orchard Lake Village had the lowest vacancy rate in 2019 at 1.4 percent, followed by Clarkston at 1.6 percent and Plymouth and Augusta townships at 1.8 percent. The inner-ring suburb with the lowest vacancy rate was Southfield Township at 4.1 percent, followed by Allen Park at 4.9 percent. 

In knowing that the Detroit inner-ring suburbs had among the highest vacancy rates in the region, it is not surprising that Wayne County had the highest vacancy rate at the county-level at 15.5 percent. However, St. Clair County had the second highest vacancy rate at 12 percent; St. Clair County is home to the community with the highest vacancy rate (Clay Township). When breaking down the type of vacancies that makeup each county’s overall percentage though Wayne County did not rank the highest amongst any of the categories. The breakdown of vacancy types-housings units for sale, housings units for rent and “other” (described below)-is only available at the county level. So, while we cannot fully understand the specifics of vacancy rates at the municipal level, the county data does give us some insight.

According to the data, Livingston County had the highest percentage of vacant homes for sale at 18 percent, followed by Macomb County at 14 percent and then Wayne County at 10 percent. For rental vacancies, Oakland County had the highest percentage at 31 percent and Macomb County at 26 percent; Wayne County had an 11 percent vacancy rate for rentals. Overall we see that rental units tend to have higher vacancy rates than homes for sale; the rental vacancy rate may grow even higher in areas such as Detroit where demand for rentals is down just as new apartment buildings are opening, according to the Detroit Free Press.

A property is labeled as “other” vacant by the U.S. Census Bureau when it does not fit into one of the categories discussed above. According to the U.S. Census Bureau “other” properties are typically vacant because the owner does not want to rent or sell it; it is being used for storage; the elderly homeowners are living in a nursing home; it’s in an estate settlement; it is being repaired or renovated or it is in foreclosure. According to the data at the County level, St. Clair County had the highest percentage of “other” vacant properties (as described above) at 88 percent, followed by Wayne County at 79 percent. Macomb County had the lowest percentage at 60 percent. This data was only available at the county level.

While the breakdown of vacancy rates is only available at the County level it does shed some light on why certain communities may have some of the highest vacancy rates. For example, we know that communities such as Highland Park and Detroit have higher vacancy rates due houses being abandoned and people leaving those cities for outer-ring suburbs. Furthermore, according to Next Gen City, the highest vacancy rates are in areas that have the highest population of black residents; Detroit and Highland Park have the highest black populations in the State of Michigan. As the COVID-19 pandemic continues to affect the economy it will interesting to see how vacancy rates change in the future.

Marriage Rates Declining in Southeastern Michigan

The day of love just passed, and data shows the tradition of marriage may be becoming a thing of the past too. According to the 2019 American Community Survey fewer people were married in 2019 in Southeastern Michigan than in 2010. 

As shown in the first map below, compared to the second map, each of the seven counties in the region had a lower percentage of married individuals in 2019, with Wayne County having the lowest percentage of married individuals. In Wayne County, 39 percent of the population was married in 2010, and by 2019 that percentage had dropped to 36 percent.  Livingston County had the highest percentage of married individuals. In 2019 61 percent of the population in Livingston County was married, and in 2010 64 percent of the county was married. Monroe County experienced the largest decline between 2010 and 2019; in 2010 58 percent of the population was married, and in 2019 that decreased to 53 percent.

Declining marriage rates have been a trend for nearly two decades now, and this is likely due to economic and social trends. According to the Brookings Institute, as marriage rates decline, non-marital births, cohabitation and single parenthood have all been increasing. Furthermore, education and income levels also play a role in current marriage trends. For example, those with at least a bachelor’s degree are more likely to get married than those without such a degree, according to the Brookings Institute. Additionally, marriage rates are declining the most in the middle class. Potential reasons for such declines include economic instability for both men and women, wage inequalities and the concern over the cost of children.

In addition to the percentage of people getting married declining, so is the percentage of married individuals with children. Between 2010 and 2019 each county in Southeastern Michigan experienced a decline in the percentage of married couples with children under the age of 18 in the house. In both 2010 and 2019 Livingston County had the highest percentage of married individuals with a child; in 2010 that percentage was 30 percent, and in 2019 that percentage was 24 percent. Wayne County had the lowest percentage of married individuals in 2010 and 2019 at 18 percent and 15 percent, respectively. Monroe County experienced the largest decline of individuals married with children; in 2010 25 percent of individuals were married with at least one child under the age of 18, and by 2019 that declined 15 percent.

Overall, the data shows that we as a society are moving away from the traditional idea of love, marriage and a baby. As mindsets have shifted, so have economic conditions. What is in store for the tradition of marriage and a family remains unknown post-pandemic. 

Black Population in Southeastern Michigan has Lowest Life Expectancy

Life expectancy is a key metric in measuring public health and the chart below shows the life expectancy for everyone and then the white, black and Hispanic populations by race in Southeastern Michigan in 2019. The blue column shows what the average life expectancy was for all races in Southeastern Michigan, with Washtenaw County having the highest overall life expectancy at 84 years of age and Wayne County having the lowest at 75 years of age. The life expectancy for those in Michigan is 78 years of age.

When comparing life expectancy at the racial level in Southeastern Michigan we see that the black population had the lowest life expectancy across all counties while the Hispanic population typically had a higher life expectancy. Furthermore, Washtenaw County had the highest life expectancy for all of the populations examined, with the exception of the black population. In Washtenaw County, the life expectancy for the Hispanic population was 86; it was 76 for the black population and 82 for the white population.

Wayne County had the lowest life expectancy across all populations examined. In Wayne County, the life expectancy for the Hispanic population was 80, it was 72 for the black population and 77 for the white population.

For Livingston County, data was not available for the black population. Oakland County had the highest life expectancy for the black population at 77. This data is from the Centers for Disease Control 2019 Health Survey.

This data further highlights facts we all know; race and ethnicity do impact one’s life expectancy, as does where an individual lives, their education levels, income and genetic pre-dispositions. Of course, race often plays a factor into these factors as well. As we continue to explore health disparities it is vital to understand how underlying factors play a role in them and for us to determine how to create further equity in those too.

Such policies are certainly a tangled web, but their impacts are vast and have a direct impact on an individual’s life. Looking at the impact COVID-19 had on the black population in Michigan is an example of this. In April of 2020, it was found that 40 percent of COVID deaths at the time occurred in the black population, despite it only making up 14 percent of the State’s population. This staggering discovery brought on the creation of a statewide task force to investigate and address the disparity. According to the report the task force released in December, increased and strategic testing, primary care provider and telehealth access, public health campaigns and improved data quality on cases and deaths helped decrease the number of cases per capita in the black population. The number of cases between March and February dropped from 176 cases per million people per day to 44 cases per million people per day, according to the Michigan Department of Health and Human Services. This decrease is a target result of targeted investigation, analysis and policy implementations. Now it is time to further the scope of such targeted efforts.

Affordable Care Act Making an Impact in Southeastern Michigan

The Affordable Care Act was signed into legislation nearly 11 years ago (March, 2010) and while it has faced hurdles and scrutiny from the public and the public policy world, data shows it has expanded healthcare coverage to Americans. As we continue to battle the COVID-19 pandemic, access to healthcare arguably grows more and more important.

As shown in the first graph below, Wayne County had the highest percentage of individuals without health insurance in 2019 at 6.8, according to the U.S. Census Bureau. Washtenaw County had the lowest percentage at 3.7 percent. The second graph shows that Wayne County, despite continuously having the highest percentage of uninsured individuals, experienced the greatest decline in the percentage of those without insurance between 2010 and 2019 at 8.8 percentage points. In 2010 15.6 percent of the Wayne County population did not have health insurance, and by 2019 that decreased to 6.8 percent.

Overall, all seven counties in Southeastern Michigan experienced a decline in the percentage of individuals without insurance. It should be noted that it was 2014 when the marketplace for health insurance opened, and Medicaid eligibility was expanded. In this time frame Wayne County had the largest decrease in the percentage of individuals uninsured at 7.1 percent, followed by St. Clair County at 6.3. percent. While access to the marketplace has certainly helped in providing individuals with access to health insurance, the expansion of Medicaid has been key, particularly for lower income individuals.

While the percentage of individuals without health insurance remains concerning, we must also be aware of how those with health insurance obtain it. In Southeastern Michigan, majority of the population obtained health insurance from their employers in 2019. In Livingston County, 59.3 percent of the population had employer-based health insurance, which was the highest percentage in the region.  Conversely, Livingston County had lowest percentage of individuals with public health insurance at 10.9 percent (Medicaid or Medicare). Additionally, 6.8 percent of the population in Livingston County purchased their insurance directly in 2019.

In Wayne County, 29.2 percent of the population utilized public health insurance, while 41.6 percent of the population received health insurance from an employer and 3.3 percent purchased it directly (6.8 percent of the Wayne County population was uninsured, bringing the total to 100 percent). Wayne County had the lowest percentage of individuals with employer provided health insurance and direct purchase health insurance but the highest percentage of individuals with public health insurance. Additionally, Wayne County had the highest percentage of individuals without health insurance. This sheds light on the fact that many individuals working in Wayne County have jobs where health insurance is not offered or affordable and may not have the means or access to obtain it through other outlets.

Overall, the data shows that the Affordable Care Act has had an impact on individuals in Southeastern Michigan, with fewer individuals going without health insurance. There is still room for improvement though in ensuring the uninsured gap is filled.

Back to the Basics: Reviewing Southeastern Michigan’s Core Data

Drawing Detroit provides weekly updates on socioeconomic data related to Southeastern Michigan and beyond. By taking publicly available data, presenting it in easy digestible formats such as maps and charts and analyzing that data we are providing a deep understanding of the structure of our region. Understanding how the population of our region changes on an annual basis is vital in shaping public policy, determining long-term infrastructure investment and how a person and community can be successful. For example, population migration data on where people are moving to and from sheds light on where jobs are and where taxpayer dollars will be going. Educational attainment data highlights where greater investment is needed to ensure student success and access to educational opportunities; educational attainment also plays a role in a family’s median income. As we as a society work to improve, knowing and understanding the data that shows what short and long-term paths we are on will only help us in reaching our goals. This is why Drawing Detroit will provide annual updates on select data sets, to show where we as a region sit  

Topics that we will provide updates and dates into annually include: 

Population

Population data is essential for planning purposes. Knowing how many people live in an area, whether the population is on an upward or downward trajectory and what age and sex ratios makeup the population help determine infrastructure, school, housing and other community needs. It also determines representation from the government. 

Race and Ethnicity 

Data on a population’s race and ethnicity guides equal and equitable public policy and access to everyday needs. We know we live in a society where racism exists, access to jobs, educational opportunities, housing and so much more is often made more difficult because of the color of a person’s skin. By knowing where those gaps of inequities are we can work to remedy them, but we must first acknowledge they exist. 

Income and Poverty

Income data is a reflection of an area’s economic well-being, which ties directly to job and job training availabilities, educational attainment and access to housing, food and healthcare. Income data is also directly related to determining poverty levels. 

Education and Educational Attainment

Education and educational attainment data helps create opportunities for students by providing greater insight into what subject matters may need more attention in the curriculum to allow for student success. It also highlights where the gaps and barriers may be for students to reach certain levels of education, which plays a role in the type of careers they may have, what their average income may be and the overall economic well-being of the area they live in. 

Other areas of importance that we will update annually are:

  • Percent of vacant housing stock
  • Gun violence/deaths 
  • Traffic deaths 
  • Deaths caused by major health factors (heart disease, cancer, etc.)
  • State revenue sharing amounts and communities’ tax bases 

All of this data, and much more, is invaluable in understanding where we as a society, a community, a region stand and how we can move forward. The graphs displayed above show where the seven counties in Southeastern Michigan are in relation to these key data points as of 2019, according to Census data. For example, the data shows that Wayne County has the highest percentage of black residents in the region but the lowest levels of educational attainment, the lowest median age and the lowest median income. Wayne County also has the highest percentage of individuals living in poverty. We know all of these factors play into one another, and by keeping track of this data we can work toward better standards of living through education on the subject matter, changes in public policy and programming.

Have other topics you feel should be updated and discussed at least annually? Let us know by emailing drawingdetroit@gmail.com

Local Journalism Plays Important Role in Local Government

The COVID-19 pandemic has affected hundreds of thousands of small businesses, and news organizations have not been exempt. When the pandemic first hit CandG News halted publication for several weeks, the Troy-Somerset Gazette and the Detroit Metro Times made layoffs, employees were furloughed at the Detroit Free Press and the Macomb Daily no longer operates out of a newsroom. These are just some local examples of how the pandemic impacted the local news market. And, while these cuts will certainly affect the communities in which they operate, local newspapers began suffering long before COVID.

In Michigan, there have been more than 30 newspaper closures, several mergers of smaller papers into larger organizations and a loss of more than 40 percent of journalists since 2004, according to the Pew Research Center. The Pew Research Center also found there were about 114,000 newsroom employees in 2008 in the US and by 2019 that number decreased to about 88,000. The brunt of that decrease occurred at print news organizations, with about 72,000 people being employed at a newspaper in 2008 and only about 35,000 being employed in 2019. While digital and broadcast newsrooms experienced increases in employment and serve as sources of delivering the news, that doesn’t mean the impact of a local newspaper on a community was maintained. There is just as much news today, and arguably more, to be reported on but fewer and fewer resources to do so.

According to the New York Times, 65 million Americans live in a county with only one local news source. In the Midwest there are 27 counties without a newspaper, according to Poynter. This means there is zero or maybe one local news source to report on city council and school board meetings, police and fire operations, business and a host of human interest stories in dozens of counties across the region and country. Certainly not everything can be followed and reported on in a county by one newspaper. When a story is reported on relating to any one local government it is more often than not that readers lack the full understanding of the story and its impact due to prolonged periods of disengagement by both the news organization and the community itself.

Disengagement in local news directly affects voter turnout, the number of candidates who run for local office and an increase in the potential for corruption. For example, a Governing.com study found that for every additional staffer hire a 6 percent increase in local voter turnout was expected. The study also found that for each additional staffer a newspaper were to hire per 1,000-person circulation the number of candidates who would run for local office would likely increase by a factor or 1.2. As for corruption, when local newspapers are thriving, or least not clawing themselves out of a hole, more time and resources can be spent to follow local policy and spending decisions and truly get to know a community so even small discrepancies or irregularities can be recognized and investigated. Additionally, the Brookings Institute “Local Journalism in Crisis” report found that borrowing costs significantly increased for counties where a newspaper closed. While this doesn’t directly point to wrongdoing it does leave many question as to why.

The necessity for strong local journalism is clear and as this pandemic dredges on and government budgets dwindle their importance only grows greater. One of the beauties of newspapers/journalism is supposed to be how it acts as the fourth estate, the watchdog of government. But, continued decline in newspaper advertising revenues, circulation and staffing levels current approaches to local journalism and its funding are not proving to be successful. This leaves a question as to how these local news organizations can diversify their revenue sources and if government subsidies for the organizations or the readers could help keep them afloat. Creative means to maintain local journalism are vital. To ensure this country has an educated and engaged electorate and sources to unveil wrongdoing and encourage civic participation we must support the local news organizations we currently have and also vocalize their importance and demand more coverage.

What’s the Future of School Vaccines in Michigan?

Healthcare workers and the elderly will be among the first to receive the COVID-19 vaccine once it is widely distributed. And, in the months following their vaccinations, the general public will become eligible too. While there are still many questions to be answered regarding the adult population being vaccinated against COVID, there are also questions regarding children being vaccinated. 

When will the vaccine be ready for children? Is it safe for them? Will children be required to be vaccinated to attend school?

According to a recent Washington Post article, trials for a COVID vaccine geared toward children have either just begun or have yet to start, depending on the company. This information alone means that a vaccine for children is farther out, however more than 1.1 million children have tested positive for the virus thus far. A child’s immune system responds differently than an adult’s does which is just one reason why child-oriented trials are necessary; ensuring the vaccine is safe and effective for this sector of the population is critical.  

Certainly when a vaccine will be available for children will impact when students can safely return to school and partake in school-oriented activities. However, even when one becomes available, the question of whether they will be required to obtain take the vaccine to attend school remains. States determine vaccine laws and in Michigan the Public Health Code requires children to be immunized against polio, diphtheria, tetanus and whooping cough. There are exceptions though, such as if vaccinating a child violates the religious beliefs of the family or is medically advised against because it could cause more harm than good to the child. 

Below are the overall vaccination and waiver rates for the diseases mentioned above by county in Southeastern Michigan. This highlights how the majority of the K-12 students in Southeastern Michigan are vaccinated as required by Michigan law.  According to the Michigan Department of Health and Human Services, Detroit (which was included in the regional maps due to its size) had the highest percentage of students vaccinated as of February 2020 at 94.1 percent, followed by Washtenaw County with 93.9 percent of its student population being vaccinated. Livingston County had the lowest percentage of students vaccinated at 90 percent. Conversely, Livingston County had the highest vaccine waiver rate at 7.7 percent while Detroit had the lowest at 1.9 percent. 

The data displayed above is reflective of vaccines required by the Michigan Public Health Code and as of yet there is no word as to whether or not the COVID vaccine will be required for school attendance in Michigan. In theory, we can only hope that vaccination rates for school-aged children will be as high as they are for the required vaccines in Michigan. But, until a vaccine for that population becomes available, and likely for sometime after, schools will have to continue to enforce social distancing, mask-wearing and regular sanitization, if they are meeting in person. 

Flu Vaccination Rates Increase as COVID Vaccine Authorization Pends

The flu vaccine has been increasingly stressed this year to thwart a winter where COVID-19 and the flu run rampant. In Michigan, 350,021 people had already tested positive for COVID as of Nov. 28 and while a vaccine is expected to be available soon, it is not here yet. Currently, the best chance to avoid contracting COVID is to remain at home whenever possible and wear masks and maintain a distance from others when needing to leave the house. With the flu though, a vaccine is available, and has been available prior to every flu season for decades.

For the 2020-21 flu season, 198 million flu shots have been made available to the public, an increase from 175 million last year, according to the Centers for Disease Control and Prevention (CDC). According to the Washington Post, national pharmacies such as CVS and Walgreens have reported demand for the flu vaccine is higher this year than in years past, even double in same cases. However, according to the data from the Michigan Department of Health and Services there was no county in Southeastern Michigan where even half of the adult population had received the flu vaccine for the 2019-20 flu season.

Washtenaw County had the highest percentage of adults who received the flu vaccine at 42 percent last year, followed by Oakland County where 41 percent of the adult population received the flu vaccine. St. Clair County had among the lowest percentage of adult residents who received the flu vaccine last year at 25 percent. The City of Detroit had the lowest percentage though at 13 percent.

The CDC recommends everyone above the age of 6 months receive a flu vaccine, with rare exceptions. While the flu vaccine is widely recommended for nearly all ages, those with compromised immune systems and above the age of 65 tend to be the most targeted populations for vaccination. According to the CDC, between 70 and 85 percent of seasonal flu-related deaths have occurred in people 65 years and older, and between 50 percent and 70 percent of seasonal flu-related hospitalizations have occurred among people in this age group. With such data, it would make sense that the counties with the highest population of older adults would also have among the highest flu vaccination rates. However, that is not that case.

In Southeastern Michigan, St. Clair County has the highest population of adults 65 years of age or older at 19.5 percent and a 25 percent flu vaccination rate for adults, the lowest in the region. In Washtenaw County 14.5 percent of the population is made up of older adults, among the lowest percentage in the region (Detroit’s older adult population makes up 13 percent of its population and 13 percent of the adult population received the flu vaccine last year) yet it has the highest flu vaccination rate.

The flu vaccine for the current flu season is still available, but attention has certainly shifted in recent weeks to the availability of a COVID vaccine. According to media reports, Moderna applied to the US Food and Drug Administration for authorization of its COVID vaccine Monday and Pfizer applied for emergency authorization of its COVID vaccine last Friday. According to CNN, the FDA is scheduled to meet with its Vaccines and Related Biological Products Advisory Committee on Dec.10 to review Pfizer’s application and on Dec. 17 to review Moderna’s application. If approved, millions of doses of the vaccines could be shipped around the US by mid-December. According to media reports, about 6.4 million Pfizer vaccines will be distributed throughout the US by mid-December and about 20 million doses of the Moderna vaccine will be available by the end of 2020. The CDC will make the recommendation on who should get the shots first; it is likely healthcare workers and nursing home residents will be recommended to get vaccinated first.

For Michigan, Henry Ford Hospital estimate that as early as Dec. 12 vaccines can begin to be distributed. Detroit Mayor Mike Duggan expects that 5,000 residents will need to be vaccinated a day for 3-4 months to ensure the City’s population is vaccinated.

While we wait for a COVID vaccine to be approved and distributed, it is imperative we take additional steps to maintain our health, such as receiving a flu vaccine. The data from the State shows that not even half of the adult population in Michigan received one last year (the State average is 32 percent); we must do better at becoming vaccinated against COVID once vaccines are widely available. The flu is deadly; up to 62,000 people died from it last year, according to the CDC. However, 267,000 people have already been killed by COVID in the US and it hasn’t even been an active virus in the US for a year.