USPS Reports Decreased Vacancy Rates in Detroit

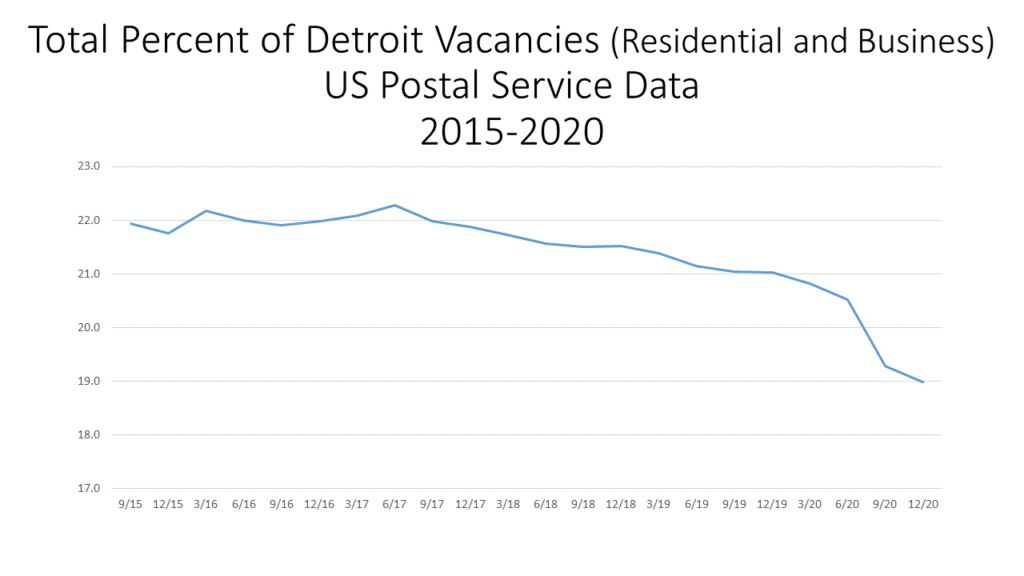
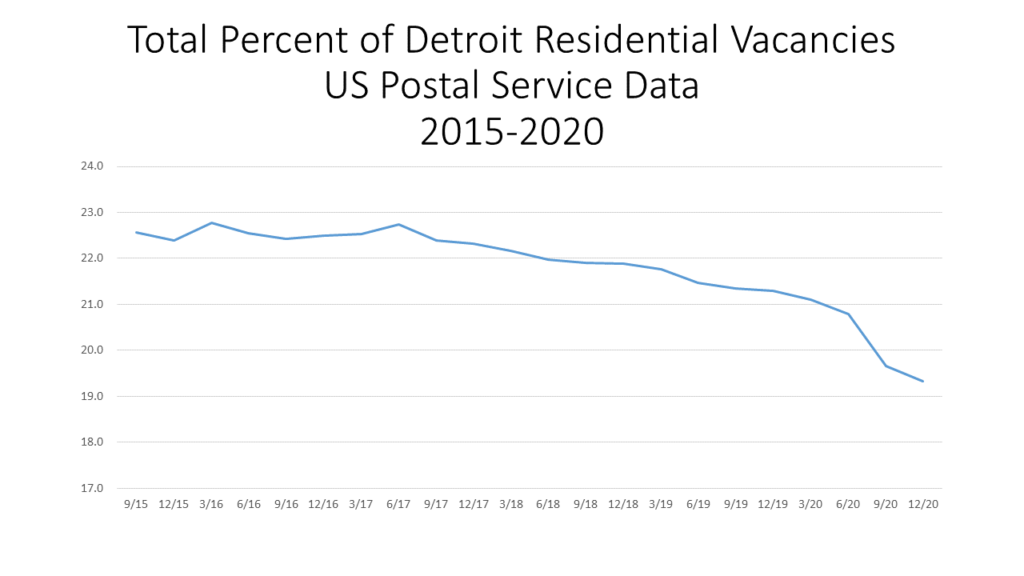
In December of 2020 the US Postal Service reported 74,313 total vacant properties in the City of Detroit, equivalent to a 19 percent vacancy rate. This rate is the lowest report rated since 2015, as can be seen in the first chart below. Additionally in 2020 the Postal Service reported 317,272 occupied addresses.

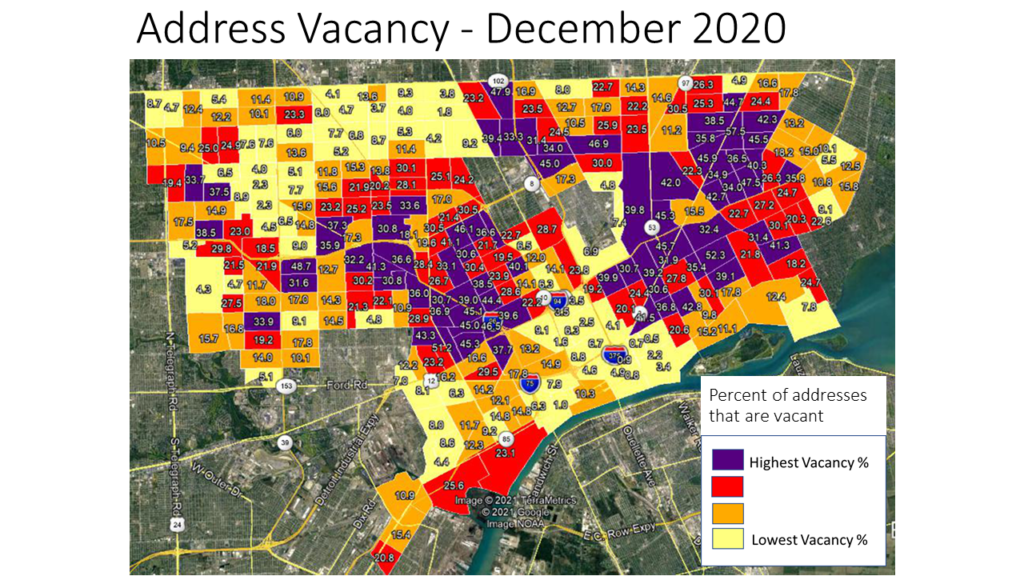
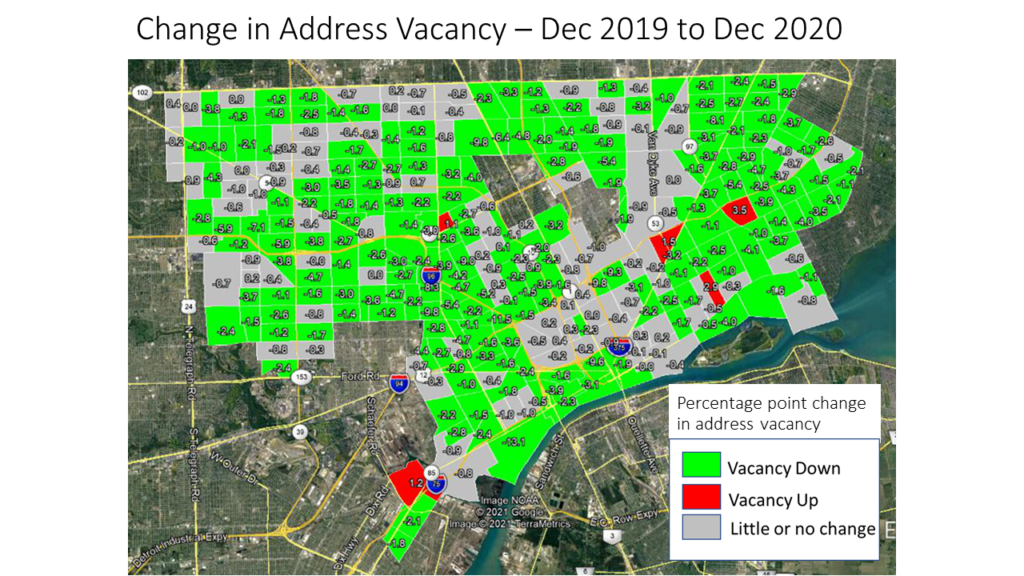
According to the first map below, while the overall vacancy rate in December of 2020 was 19 percent, there were several areas in the City with much higher rates. The highest rates stemmed off of I-96 and Gratiot Avenue in the City of Detroit, with the highest overall rate for a Census Tract being 52.3 percent in the Morningside/Chandler Park area. Conversely, vacancies remained the lowest in the Downtown Detroit area and Green Acres/Pembroke/Bagley areas. High vacancy rates in the City ranged from 31-52.3 percent and low vacancy rates ranged from 1.9 to 9.3 percent. Between September and December of 2020 the vacancy rate decreased by 0.3 percent. Additionally, the vacancy rate had an annual 2 percent decrease plus a 2.8 percent decrease over a five year time period. The second map below shows the long-term trends; all but seven Census Tracts experienced a decrease in vacancy or little to no change between 2019 and 2020. The Chandler Park area had the highest increase in vacancy rates between December 2019 and 2020 at 3.5 percent.

The USPS provides aggregate vacancy and no-stat counts of residential and business addresses that are collected by postal workers and submitted to on a quarterly basis the Department of Housing and Urban Development. While occupancy status is recorded, USPS does not capture any information about the nature of the vacancy or the address itself, other than whether it is a residential or business address. To the USPS, the address is either occupied and requires mail service or is vacant and does not. An address is deemed vacant if it did not collect mail for 90 days or longer. In addition to occupied and vacant addresses there are also “no stat” addresses. A “no stat” address is deemed that if it is under construction and not yet occupied or is in an urban area and identified by a carrier as not likely to be active for some time.

As noted, overall vacancy rates in the City of Detroit have been declining, and this also true at both the residential and business levels. Residential vacancy rates in September of 2015 were 22.6 percent, which was equivalent to 81,666 residential vacancies. By December of 2020 that number of vacancies decreased to 19.3 percent, or 67,442 total vacancies.

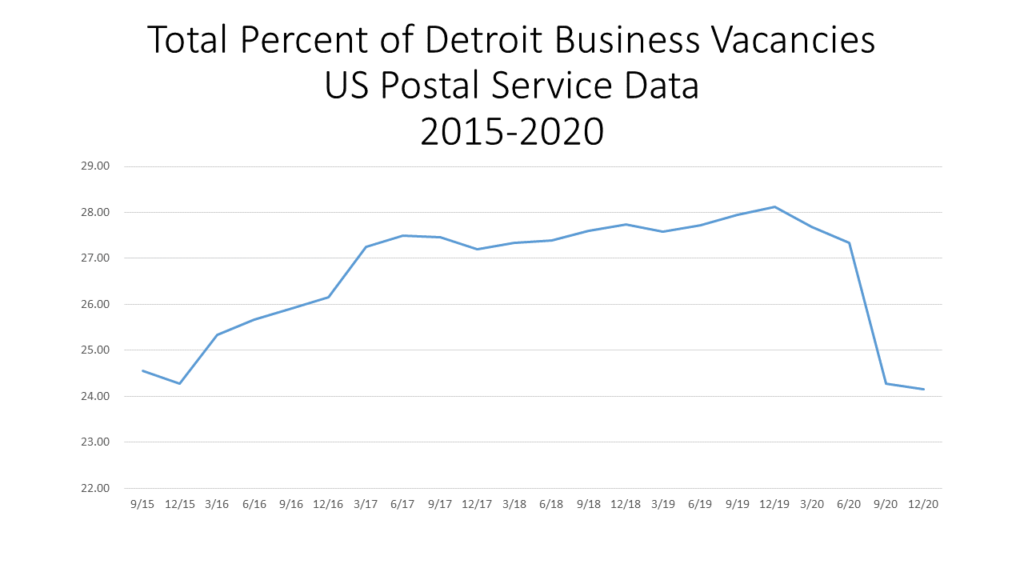
For business vacancies there was a total of  6,871 vacant businesses out of 28,438 total businesses in the City, this was equivalent to 24.2 percent. In September of 2015 the vacancy rate was 24.6 percent for a total of 7,337 vacant businesses out of 29,885.

Examining both charts below we see that there has been a steadier decline in residential vacancy rates than business vacancy rates. Between 2015 and 2019 business vacancies were actually climbing, and reached a high of 28 percent in December of 2018. Then, through the Pandemic declined substantially, though it is not clear why.

According to the USPS there was 27,878 “no stat” addresses reported in Detroit in December of 2020, an increase of 3,884 from the year prior.

Access to Michigan Child Care Needs Re-evaluation

Child care has long been a critical need for parents, and as the COVID-19 pandemic drags on that need continues to grow. When the virus first arrived in Michigan child care centers shutdown as many unknowns loomed. Over a year later, some centers have reopened, while others have not, and capacity has been reduced at many of them. Additionally, the work environment for many parents has shifted as well–essential workers are tasked to the brim, and those working from home have had to juggle a new reality of work and children in the same space in some cases. Not only has the child care landscape shifted in the COVID era, but its financial accessibility has long been an issue. This shift means decreased enrollment, leaving some providers to ask if they should close their doors. But, even more doors closing means the families that still need child care have fewer options, and likely even more expensive options, due to higher demand because of a tighter market. Since COVID first hit Michigan 5.8 percent of women in the workforce have left, many of whom have cited childcare as the reason. Costs are and accessibility are certainly behind that.

According to the Michigan League for Public Policy, the average cost of child care in the State of Michigan was $708 a month for infant care and $726 for toddler care in 2020. In Southeastern Michigan the cost of infant and child care was equal to or higher than the state average in five of the seven counties. In Oakland County, the cost was the highest for both types of care. The average cost of infant care in Oakland County was $929 and the average cost of toddler care was $894. Monroe County had the lowest average monthly cost of infant and toddler care, regionally, at $627 and $615, respectively.

There are some programs that provide financial assistance to families for child care, however, very few are eligible for such subsidies. According to the Michigan League of Public Policy, 5.3 percent of Michigan children 5 years of age or younger were approved for child care subsidies in 2020. In Southeastern Michigan, Wayne County had the highest percentage of children 5 years of age or under who were approved for subsidies at 8.3 percent. These subsidy percentages are among the lowest they have been in decades, according to the Michigan League of Public Policy. The percent of children receiving a child care subsidy has declined 65 percent over the past two decades.

Just as the cost of child care often makes it difficult for families to utilize the service, so does its accessibility. According to the Michigan League of Public Policy, St. Clair County had the highest percentage of open child care centers as of January 2021 at 71 percent, followed by Washtenaw County at 68 percent. Oakland County had the lowest percentage of open child care centers at 60 percent. Furthermore, areas with higher median incomes and housing values tend to have more child care centers, as residents of such areas tend to be able to afford child care more easily. The numbers in the chart above do not necessarily reflect the long-term data that shows areas of higher incomes have greater access to child care as many child care centers closed currently are based on personal business decision related to COVID. An item to consider on this as well are that areas such as Oakland County, where the median incomes tend to be high, have amongst the lowest percentage of open child care centers because they have more income to afford in-home care or for a parent to remain with the children at home, leaving less need for child care centers at this time.

Income clearly plays a role in a parent’s ability to utilize child care services. Although we noted that some subsidies are available, a higher percentage needs to be allocated, which means the state and federal government needs to allocate additional dollars. Also, Gov. Gretchen Whitmer recently launched the MI Tri-Share Child Care Pilot Program, which splits the cost of child care equally between the employee, the employer and the state. Those eligible to participate in the Tri-Share pilot must be employed by a participating employer, have an income above 150% of the Federal Poverty Line (FPL) and below 250% FPL, and not otherwise be eligible for the Child Development and Care Program. The three regional facilitator hubs chosen for the Tri-Share pilot are: Goodwill Industries of West Michigan, serving Muskegon County; Saginaw Intermediate School District, serving the Great Lakes Bay Region; and the United Way of Northwest Michigan, serving a five-county rural region in Northwest Lower Michigan. This program is a step in the right direction but additional actions need to be taken to ensure child care is affordable and accessible to all.

14 Percent of Michigan’s Population Lives With a Disability

Prior to the COVID vaccine distribution efforts opening to all Michigan residents 16 years of age and older, there was a strong push to move up the distribution date of the community of people with disabilities and its caretakers. According to advocates, the need for access to COVID vaccines for the community of people with disabilities was imperative because of the close physical contact this community has with their caretakers and often the barriers these individuals have with strictly adhering to COVID guidelines.

According to the 2019 American Community Survey about 13 percent of the US population lives with a disability. In Michigan, that percentage is 14 percent. The Census categorizes disabilities by vision, hearing, cognitive, ambulatory and/or self-care. In Southeastern Michigan there are two counties with a higher percentage of residents with disabilities than the state average. In Wayne County, 15.5 percent of the population is considered disabled; in St. Clair County 16.7 percent of the population is considered disabled.

Of the community of people with disabilities in Southeastern Michigan, the 75 years of age and older community has the highest percentage of individuals considered disabled. Furthermore, of the community in the region, those with ambulatory disabilities have the highest percentage. St. Clair County not only has the highest percentage of those with disabilities but also the highest percentage of those with ambulatory disabilities at 25 percent.

While several counties and communities opened their COVID distribution efforts early to people with disabilities–such as Detroit and Macomb County–this may not have happened without the advocacy that occurred. Raising awareness of disabilities and the barriers that may be incurred because of them is vital in ensuring equality and equity.

A Closer Look at Barriers for Detroit’s Workforce

To understand Detroit’s workforce you must also understand the barriers people have in obtaining employment and business ownership. Of the respondents to the 2021 Detroit Citizen Survey, 42 percent (240 respondents) reported being fully employed, 11 percent reported being employed part-time (64 respondents) and about 35 percent (200 respondents) reported not being employed or looking for work. Furthermore, of the 11 percent who were unemployed but looking for work (62 respondents) only 41 percent were receiving unemployment. This Detroit unemployment level is over twice the statewide rate.

Of the people looking for unemployment, 60 said they were facing barriers. These barriers included available jobs, transportation, education/training and child care.

While there are barriers to jobs, there are also barriers to wealth. Of the 525 respondents who reported barriers to building wealth, 2,025 barriers were collectively checked off. The most common barrier reported was auto insurance that was too high, selected by over 77 percent of respondents (406 people). Additionally, 48 percent of respondents (251) reported a low paying job or little access to better paying jobs, and about two-fifths indicated not being well-informed about personal financing. Furthermore, about two-fifths indicated paying off credit cards as a barrier, and over one-third each cited bad credit, health care costs and student loans.

Finally, business ownership is one means of building wealth and maintaining employment. Of the respondents, about 27 percent own their own business (84) and less than 38 percent of those respondents (32) reported having access to capital to run/build their business.

Building a strong economy and stable workforce is dependent on several factors, such as equal education opportunities, support of the potential workforce–which includes access to capital funding and childcare and everything in between–reliable transportation, and the availability of jobs, especially ones with a living wage. In order to build a stronger community we must first understand the barriers that exist in getting there. The 2021 Detroit Citizen Survey has provided vital insight into understanding the needs and concerns of the community and what issues must be addressed to ensure future success.

Majority of Detroit Home Problems Involve Water Inside

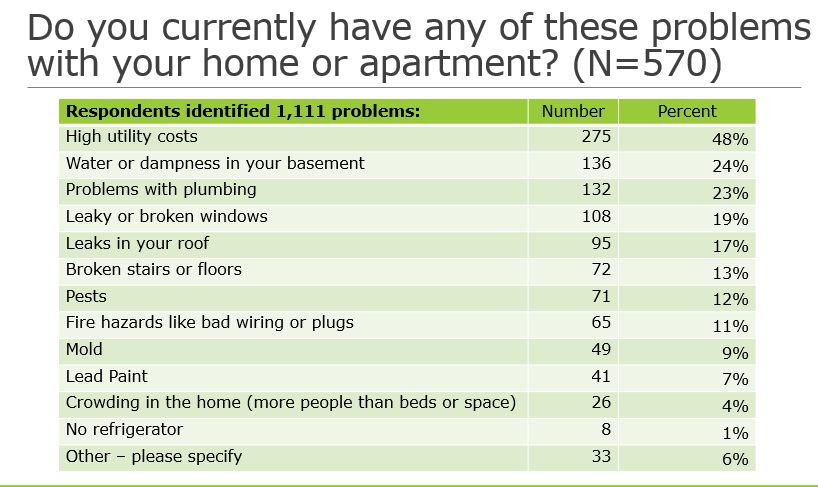
There are household problems, and then there are home problems. Home problems range from lead paint to inadequate infrastructure to high utility costs. The respondents of the 2021 Detroit Citizen Survey were provided a list of home problems and asked to identify which ones apply to their house or apartment. There were 570 respondents to this question and of those a total of 1,111 problems were identified.

High utility costs was the most common problem, which was identified by 275 people or 48 percent of the respondents. Water or dampness in the basement was the second most identified problem and plumbing issues was the third. Four of the five top problems (mentioned by 83% of householders) concern water in the home, and mold is later mentioned by another 9 percent. Water and dampness in homes is highly correlated with asthma, which is one of the most frequently occurring problems for children and adults in Detroit.

The University of Michigan recently produced a study titled “A Decent Home: The Status of Home Repair in Detroit,” which found that more than 24,000 housing units in Detroit are “severely or moderately inadequate,” but only about 3,000 residents were able to access funds to fix the problems. These funds are aimed at low income residents and provided through grants or loans.

A little background about Detroit’s housing stock, according to the US Census Bureau, 78 percent of Detroit’s housing stock was built before 1960. Of the occupied housing units in the City, 75 percent are worth less than $100,000. Additionally, 67 percent of the occupied rental units have rental prices of less than $1,000. The age of housing and its cost plays a role in ongoing home problems, as does the average income of a household. According to a Bridge Detroit article, 73 percent of Detroit renters earned less than $35,000 in 2019, and about half of those households spent at least 50 percent of their monthly income on rent in. This means either less money for home repairs or having to live in housing units that are less than desirable.

The City of Detroit does have a 0% Home Repair Loans Program that offers zero percent interest loans from $5,000 to $25,000 to help Detroit homeowners invest in and repair their homes. Projects that are eligible for funding through this program include correcting health and safety hazards, electrical repairs, furnace replacement, roof replacement and plumbing. Jefferson East Inc. and Rocket Community Foundations are two other organizations in the City that offer funding for home repairs

COVID Ranks High Among Detroit Community, Household Concerns

When respondents to the 2021 Detroit Community Survey were asked to rate top problems for their community and household, COVID-19 again found its way to the top of the list. Respondents were presented with a list of 15 concerns and asked to rate each one on a scale of 1-10, with 10 being the most serious, on how much of a problem it was their community and their household. For each item, the average response was greater on the rating as a community problem than as a household problem.

According to the respondents, COVID ranked as an 8.02 on the scale as a community problem and a 4.6 as a household problem. The average difference between the two ratings ranged from 1.59 to 3.92, and averaged 2.97.

The respondents ranked COVID, having money to survive and job loss as the top three community problems. The top three household problems were having money to survive, COVID and housing costs or quality.

As noted in the Monday post, COVID remains a problem locally, across the state and nationwide. Although the vaccination numbers continue to climb, so do confirmed COVID cases. On March 30 there 5,177 new confirmed cases, bringing the State total to 665,948 confirmed COVID cases. As noted in the Monday post, COVID remains a problem locally, across the state and nationwide. Although the vaccination numbers continue to climb, so do confirmed COVID cases. On March 30 there 5,177 new confirmed cases, bringing the State total to 665,948 confirmed COVID cases. Additionally, statewide unemployment rate was 5.2 percent in February and in Detroit the unemployment rate was 11.4 percent in January of 2021. So, the data on objective reality is entirely consistent with the issues that are at the top of residents’ list of concerns.

Where are the Irish at in Southeastern Michigan?

Everyone acts as if they have the luck of the Irish on St. Patrick’s Day, but according to Census data those with that ancestral luck are in the minority. According to 2019 ancestral data, Livingston County had the highest percentage of residents with Irish ancestry at 14 percent, followed by St. Clair County with 13 percent of the population claiming Irish ancestry. Wayne County had the lowest percentage at 7 percent. A closer look at the region through Census Tract data shows that an area in Grosse Pointe had the highest percentage of those with Irish ancestry at 30 percent; other pockets with some of the highest percentages were near Ann Arbor, Port Huron, White Lake and Farmington Hills. Statewide, 11 percent of Michiganders reported Irish ancestry.

Understanding our ancestry is important, and the Census data not only shows breakdowns of origins from specific countries and regions, but also the percentages of those with single or multiple ancestral roots. Ancestry refers to one’s ethnic origin or heritage, or the place of birth of the person or the person’s parents or ancestors before their arrival in the United States. Throughout Southeastern Michigan each county had more than a third of its population report single ancestry data. Oakland County had the highest percentage of residents with a single ancestry at 53 percent, followed by Macomb County where 52 percent of the population reported a single ancestry of origin. Livingston County had the lowest percentage of residents with a single ancestry origin at 40 percent, conversely it had the highest percentage of multiple ancestry residents at 42 percent. Note that the percentages reported for multiple and single ancestry in the maps below do not add up to 100 percent, that is because the Census also accounts for those who do not report ancestry.

While the Irish are at the top of everyone’s minds this week, much of Michigan’s ancestry is comprised of those with German decent at 19 percent. Additionally, in Southeastern Michigan we have an enclave of those of Arab descent. While those with Arab roots make up 2 percent of Michigan’s population, in Wayne County they make up 6 percent of the population and in Macomb and Oakland counties they make up 3 percent of the populations.  When examining the data at the Census Tract level we see that the Dearborn-Dearborn Heights area has between 14-80 percent of the population (depending on the tract) with Arab roots. Other areas with high Arab ancestral roots are Hamtramck (up to 39 percent) and West Bloomfield (up to 25 percent), Bloomfield (up to 13 percent) and Sterling Heights (up to 15 percent).

Understanding a region’s ancestry helps bring historical knowledge on who helped grow the region, a community and even a neighborhood and its culture. As we continue to evolve as a society many of us still try to cling to our ancestral roots, showcasing positive traditions of the past. With migration amongst cities, states and countries being fluid we must also make way for new traditions and take time to understand the cultures of all those around us.

Economic Indicators: Unemployment Rates, Housing Costs Remain Higher than Pre-COVID

We are a year into the COVID pandemic, unemployment rates have peaked and then declined, but they are still substantially higher than a year ago. Average home prices have increased as demand for homes has increased. Broader consumption trends though, while they are faring better than nearly a year ago, have yet to fully recover to pre-pandemic levels. Below we show just how these various indicators have changed over the last year.

In December of 2020 the unemployment rates for the State of Michigan and for the City of Detroit continued to increase after declines following the initial unemployment spikes due to COVID-19. The State of Michigan reported an unemployment rate of 7.3 in December, a higher rate than what was reported in November, which was 6.3. For the City of Detroit, the unemployment rate for December of 2020 was 20.3, which is higher than the November rate of 18.7. The December unemployment data further highlights how the unemployment gap between the State and Detroit continues to grow wider as the COVID case numbers increased rapidly over the holidays.

In line with what was reported above, COVID impacted unemployment rates at the county level in Michigan as well. In December of 2020 each county in Southeastern Michigan had a significantly higher unemployment rate than the year prior. According to data from the Michigan Department of Technology, Management and Budget, Wayne County experienced the largest increase at about 8 points. In December of 2020 Wayne County had an unemployment rate of 12.4 and in December of 2019 it was 4.5. Washtenaw County experienced the smallest increase at 1.5 points. In December of 2020 Washtenaw County had an unemployment rate of 3.6 and in December of 2019 it was 2.1. While there were overall unemployment increases, the differences in the unemployment percentages between each county is, at least in part, dependent on the type of jobs available in each county and the occupations of residents. For example, in Wayne County the top occupations are office and administrative support, production and sales and food service. In Washtenaw County the top occupations are office and administrative support, education instruction, health care practitioners and food service workers. Throughout much of the year some positions related to office and administrative support and food service have been considered non-essential or experienced higher layoff rates while those in health care and education have been at less risk of being unemployed.

The Bureau of Economic Analysis recently released data on the per capita personal income by county for 2019, showing that overall incomes in Southeastern Michigan did grow between 2018 and 2019. In 2019 Oakland County had the highest per capita personal income at $72,271 but it had the lowest percent change between 2018 and 2019 at 2.7 percent.  Wayne County had the lowest per capital personal income at $44,512 with the percent change from the year prior being 3.3 percent. St. Clair County had the lowest percent change in per capita income between 2018 and 2019 and 2.7 percent; its per capita personal income in 2019 was $45,662.

When examining personal income growth between 2017-18 and 2018-19 the percent change was lowest for the most recent year of data, as opposed to the growth from between 2017-18.

We have yet to know what the impact COVID will have on personal income for 2020, but the data below does show that growth was already beginning to slow down prior to the pandemic. That coupled with higher rates of unemployment, business closures and decreases in spending on goods and services may very well mean lower personal incomes for 2020.

The automobile industry continues to be a driving force in Michigan’s economy and the latest data on vehicle sales show that the number of auto sales for lightweight vehicles has been steadily increasing in recent months while light truck and car sales slightly declined in February of 2021. However, compared to a year ago, sales still remain below what they were. In February of 2021 auto sales for: sales of light weight vehicles were 16.5 million, compared to 16.8 million the year prior; light truck sales were 12.3 million compared to 12.5 million in February of 2020; car sales were 3.4 million, compared to 4.2 million the year prior.

Below shows the consumption expenditures of goods in the U.S. between 2019 and 2021. According to the U.S. Bureau of Economic Analysis, durable goods have an average useful life of at least 3 years (e.g. motor vehicles) while nondurable goods have an average useful life of less than 3 years (e.g. food) and services are commodities that cannot be stored or inventoried and are consumed at the time of purchase (e.g., dining out). The chart below shows how services have yet to make it back to the pre-COVID consumption levels, but the consumption of durable and non-durable goods have risen. In January of 2021 $8,016 billion in services was consumed, $2,148 billion in goods was consumed and $3,206 billion in nondurable goods was consumed.

According to the Case-Shiller Home Price Index, the average price of single-family dwellings sold in Metro Detroit was $139,240 in November of 2020; this was $145 higher than the average family dwelling price in October. The November 2020 price was an increase of $11,770 from November of 2019 and $15,200 from November of 2018. So, just as unemployment rates remain higher than what they were a year ago so do average home prices. This is interesting though because with higher unemployment rates traditionally comes lower incomes and hesitation around the housing market. However, during the COVID-19 pandemic, as shown, the average price for a home has been increasing despite higher unemployment rates. Demand for existing homes has been up substantially across the nation over the last year

Commute Times, Mobility Decline in COVID Times

In 2019, before COVID, the average American spent 28 minutes commuting to, or from, their job; in Michigan that average was 25 minutes. However, once the pandemic hit many of us began working from home, which directly impacted mobility to and from workplaces and commute times, presumably. According to a Feb. 23, 2021 report from Google, mobility to places of work in the State of Michigan have declined by 29 percent. At a regional level in Southeastern Michigan mobility has declined even more than the state average since last March. According to the data, mobility declined by the following percentages for the seven counties in Southeastern Michigan from the pre-pandemic baseline:

  • Livingston County: 31 percent
  • Macomb County: 33 percent
  • Monroe County: 22 percent
  • Oakland: 41 percent
  • St Clair County: 15 percent
  • Washtenaw County: 49 percent
  • Wayne County: 35 percent

While mobility data differs from commute data, the fact that people are going to work less means commute times will also decline. Below are two maps showing the average work commute times in 2019 at the municipal and county levels. 

In 2019, the City of Ann Arbor had the lowest average commute time at 20 minutes, according to the American Community Survey, and Clay Township had the highest average commute time at 37 minutes. At the county level, Washtenaw County (where Ann Arbor is located) had the lowest average commute time at 24 minutes and Livingston County had the highest average commute time at 33 minutes. 

When the 2020 commute data is available it will be interesting to see just how many minutes the average commute time declined in Southeastern Michigan, and if that trend lasts for the long-term. Declined commute times and mobility to and from places of work means several things, including less automobile pollution and more time for individuals to participate in leisure activities, perform additional work, do chores or anything else that may be of interest to them. 

Inner-Ring Detroit Suburbs Have Highest Vacancy Rates in 2019

In 2019, Highland Park had the highest vacancy rate in Southeastern Michigan at 34 percent, according to the American Community Survey; the vacancy rate is the percentage of all available units in a rental property, such as a hotel or apartment complex, that are vacant or unoccupied. Clay Township (St. Clair County) had the second highest vacancy rate at 30 percent and Detroit had the third highest rate at 27percent. There were only seven communities in the region with vacancy rates at or above 20 percent; of those communities four were Detroit or an inner-ring suburb (Highland Park, River Rouge and Eastpointe) and the remaining three were outer-ring suburbs (Clay, Burtchville and Lyndon townships). While there were a handful of outer-ring suburbs with high vacancy rates, those with the lowest vacancy rates were all outer-ring suburbs. Orchard Lake Village had the lowest vacancy rate in 2019 at 1.4 percent, followed by Clarkston at 1.6 percent and Plymouth and Augusta townships at 1.8 percent. The inner-ring suburb with the lowest vacancy rate was Southfield Township at 4.1 percent, followed by Allen Park at 4.9 percent. 

In knowing that the Detroit inner-ring suburbs had among the highest vacancy rates in the region, it is not surprising that Wayne County had the highest vacancy rate at the county-level at 15.5 percent. However, St. Clair County had the second highest vacancy rate at 12 percent; St. Clair County is home to the community with the highest vacancy rate (Clay Township). When breaking down the type of vacancies that makeup each county’s overall percentage though Wayne County did not rank the highest amongst any of the categories. The breakdown of vacancy types-housings units for sale, housings units for rent and “other” (described below)-is only available at the county level. So, while we cannot fully understand the specifics of vacancy rates at the municipal level, the county data does give us some insight.

According to the data, Livingston County had the highest percentage of vacant homes for sale at 18 percent, followed by Macomb County at 14 percent and then Wayne County at 10 percent. For rental vacancies, Oakland County had the highest percentage at 31 percent and Macomb County at 26 percent; Wayne County had an 11 percent vacancy rate for rentals. Overall we see that rental units tend to have higher vacancy rates than homes for sale; the rental vacancy rate may grow even higher in areas such as Detroit where demand for rentals is down just as new apartment buildings are opening, according to the Detroit Free Press.

A property is labeled as “other” vacant by the U.S. Census Bureau when it does not fit into one of the categories discussed above. According to the U.S. Census Bureau “other” properties are typically vacant because the owner does not want to rent or sell it; it is being used for storage; the elderly homeowners are living in a nursing home; it’s in an estate settlement; it is being repaired or renovated or it is in foreclosure. According to the data at the County level, St. Clair County had the highest percentage of “other” vacant properties (as described above) at 88 percent, followed by Wayne County at 79 percent. Macomb County had the lowest percentage at 60 percent. This data was only available at the county level.

While the breakdown of vacancy rates is only available at the County level it does shed some light on why certain communities may have some of the highest vacancy rates. For example, we know that communities such as Highland Park and Detroit have higher vacancy rates due houses being abandoned and people leaving those cities for outer-ring suburbs. Furthermore, according to Next Gen City, the highest vacancy rates are in areas that have the highest population of black residents; Detroit and Highland Park have the highest black populations in the State of Michigan. As the COVID-19 pandemic continues to affect the economy it will interesting to see how vacancy rates change in the future.