Proposed Michigan Water Affordability Bill Meets Opposition

Access to clean water and the ability to afford it is boiling over to a new proposal to help households with their water bills. Recently, Democratic lawmakers in the Michigan House of Representatives and the State Senate introduced bills that, if passed, would create a statewide affordability fund for low-income residents to access. The fund would be created by charging a $2 monthly fee to water customers across the state.

This proposal, discussed in detail below, is now drawing fire from Macomb County leaders and Republicans who say it will primarily benefit Detroiters.

 According to a bill analysis by the Senate Fiscal Agency (SFA), the estimated amount collected in the proposed water affordability fund, assuming  all 2.5 million retail water meters in Michigan were subject to the $2 per month funding factor fee would be $90 million. When the fund reaches $90 million, 3 percent of the monies, or $2.7 million, could be allocated for administrative costs associated with the program. The remainder of that assumed initial balance, $87.3 million, would be available for:

  • Actual administrative costs of the water providers, which would be limited to 15 percent of the balance in the Fund which after 18 months could be estimated at $13.1 million;
  • Payment or advancement to providers for income-based bill discounts; income-based bill caps, or income-based rates;
  • Arrearage payments;
  • Water loss mitigation programs.

Those eligible to benefit from this program would be customers who had a household income of up to 200 percent of the Federal Poverty Guidelines or who was eligible for certain assistance programs. Eligible customers for this program, which would be housed under the Michigan Department of Health and Human Services, would not pay more than 3 percent of their household income on a water bill.

This program has been lauded by some and opposed by others. In recent weeks, Detroit Mayor Mike Duggan, the Oakland County Board of Commissioners, Oakland County Executive David Coulter, Royal Oak, Harper Woods and Warren officials, Oakland County Water Resource Commissioner Jim Nash and Wayne County Deputy County Executive Assad I. Turfe have come out in support of the bills to create this fund. Area organizations, such as the United Way of Southeastern Michigan, Clean Water Action, the Sierra Club Michigan Chapter and American Waterworks Association, have also come out in support of the proposed bills. Supporters of these bills have discussed how water affordability is a human right, and these programs will allow that human right to continue for thousands of households.

Macomb County Public Works Commissioner Candice Miller is the most vocal official against the bills, stating it would only increase water bills for customers and that there already is access to water affordability programs. She says it will primarily benefit Detroiters. Seventeen Macomb County communities agree with Miller and have passed resolutions opposing the bills that could create the statewide water affordability programs. Those 17 communities are:

  • Armada (Village)
  • Bruce Township
  • Center Line
  • Chesterfield Township
  • Clinton Township
  • Fraser
  • Harrison Township
  • Memphis
  • Mount Clemens
  • Lenox Township
  • Macomb Township
  • New Haven
  • Roseville
  • Shelby Township
  • St. Clair Shores
  • Sterling Heights
  • Washington Township

The Macomb County Board of Commissioners also voted to take a stance against the bills, and ultimately the proposed fund.

According to Miller, water affordability programs, such as the Water Residential Assistance Program (WRAP) administered by the Great Lakes Water Authority (GLWA) are not fully used as is. The counter argument to this is that programs such as WRAP offer short-term support for those in need of assistance and other programs, such as the Detroit Water and Sewerage Department’s Lifeline Plan, have a one-off funding mechanism (ARPA) funds, and more sustainable funding mechanisms are needed. Additionally, there is no statewide assistance program, rather there are various affordability programs depending on the water provider and the location of the ratepayer. There are worries though that the proposed state affordable water fund would primarily support Detroit residents, according to a January, 2024 C&G News article.

According to the proposed bills, eligible customers are households whose income does not exceed 200 percent of the Federal poverty guidelines or who meets any of the following requirements:

  • Has received assistance from a State Emergency Relief Program within the past year.
  • Receives food assistance under the Federal Supplemental Nutrition Assistance Program (SNAP) administered by State.
  • Receives medical assistance administered under the Act. Receives assistance under the Michigan Energy Assistance Program.
  • Receives assistance under the Special Supplemental Nutrition Program for Women, Infants, And Children (WIC). Receives supplemental security income
  • Receives assistance under the Weatherization Assistance Program.

According to the Michigan Department of Health and Human Services, in 2020 more than 317,000 Michigan households were behind on their water bills and facing shutoffs. Furthermore, if looking at eligibility requirements as set out by the proposed bills, there were 309,101 families in Southeastern Michigan who were living at least 200 percent of the poverty level and 190,113 households with Supplemental Security Income (SSI), cash public assistance income, or Food Stamps/SNAP benefits in 2022, according to the US Census Bureau.

According to the Census data, Wayne County had the highest number of families living at least 200 percent below the poverty level at 133,492, followed by Macomb County at 44,218 and Oakland County at 41,037. Looking at the total number of families in Southeastern Michigan who live at least 200 percent below the poverty level, minus Wayne County, there are 124,568. In total, there are 258,060 families living 200 percent below the poverty line in Southeastern Michigan and 48 percent of those families live in either Livingston, Macomb, Monroe, Oakland, St. Clair or Washtenaw counties. Furthermore, with there being 309,101 total families in Michigan that live 200 percent below the poverty line, Wayne County families account for less than half that total.

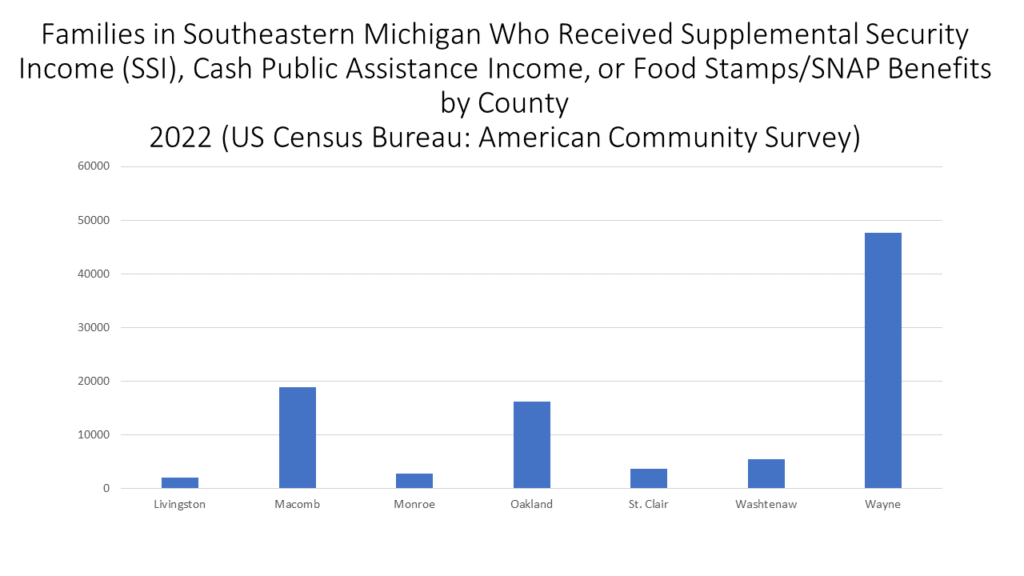
When looking at the number of families who received Supplemental Security Income (SSI), cash public assistance income, or Food Stamps/SNAP benefits in 2022 it was Wayne County that had the highest number of households, by far, at 47,646. Macomb County had the second highest number of households at 18,792 and Oakland County had the third highest number of households at 16,100. In Michigan in 2022 there were 190,113 families who received some type of assistance and Southeastern Michigan families make up 50 percent of that number.

So, while those who oppose the proposed bills claim the funds from the statewide water bill support program would primarily be filtered to Detroiters, the data shown above tells a different story.

The numbers certainly show there are families who are likely in need of utility bill support and $24 a year per household could go a long way for many. However, annually that number can increase by up to 10 percent to a maximum of $3 per retail water meter per month, according to the Senate Fiscal Agency bill analysis. If these bills are to become law and the program is created there needs to be strong program support, ensuring those in need and eligible for the program are aware of the benefit and have assistance in applying for the benefits. The monies, if charged to ratepayers, need to be used to support those in need throughout the state and ensure access to clean and fresh water.

Michigan Recycling Trends Upward, More Efforts Needed to Offset Waste Disposal

With a re-ignited commitment to sustainability, the State of Michigan has experienced an increase in the amount of materials being recycled. According to a 2023 report  (2023 Michigan Recycling: State of the State) by the Michigan Department of Energy, Great Lakes and Environment (EGLE), Michigan’s recycling rate increased 35 percent since prior to 2019 to 2022. This report states that Michigan now has a 19 percent recycling rate, in part because of greater access to and greater funding for this key element in sustainability. According to the report, more than $460 million has been invested in recycling for everything from new technology to equipment upgrades to hiring new employees since 2019.

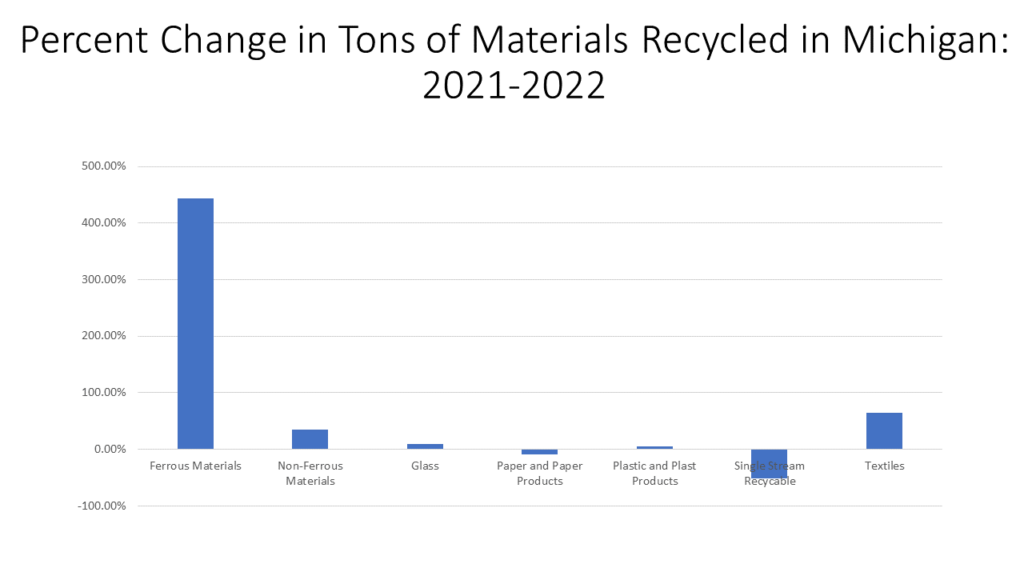
As Michigan continues to up its commitment to recycling efforts, it is important to understand just what is being recycled in the state and how much. According to the 2023 EGLE Recycling Report, 620,494 tons of materials were recycled in Michigan last year, with paper and paper products making up majority of those materials being recycled. According to the breakdown in the report, there was about 339,000 tons of paper and paper materials recycled in 2022. Ferrous materials, which are metals that contain iron, were the second most recycled items in 2022 with there being about 110,000 tons.  Ferrous materials also had the largest percent change increase in the number of tons recycled between 2021 and 2022 at 443 percent. Single stream recycling materials (which are all recyclables, including newspaper, cardboard, plastic, aluminum and junk mail that are eventually sorted into various commodity streams for sale to markets) had the largest year-to-year percent change decrease at 51 percent. There was also a year-to-year percent change decrease for paper and paper products at 9 percent.

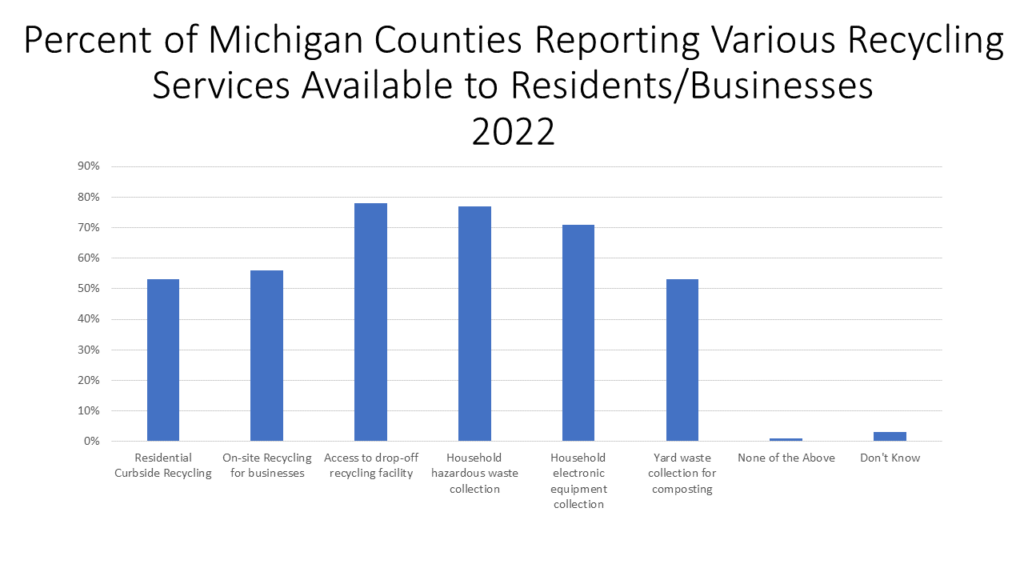
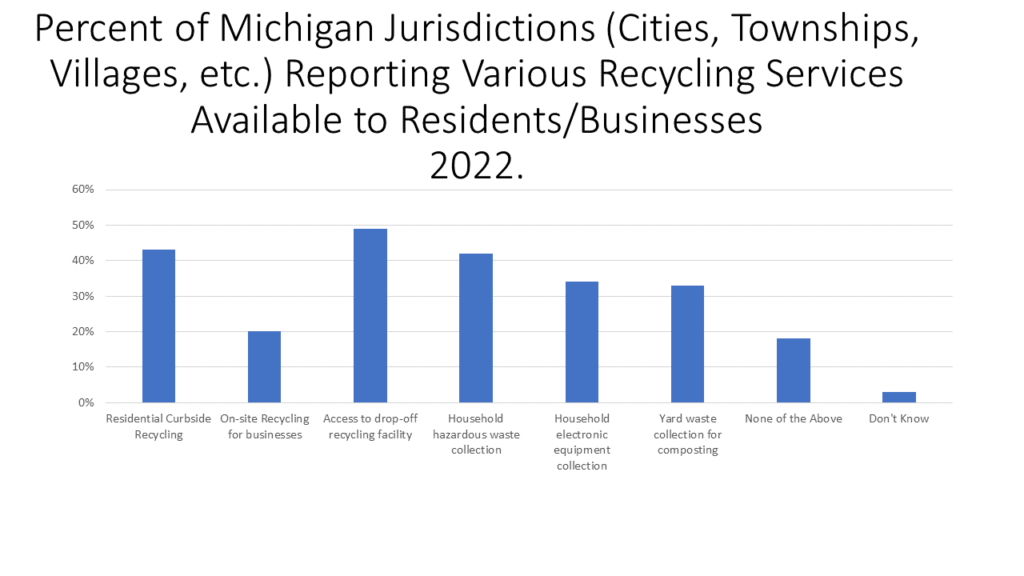
While understanding what is being recycled is important, understanding the resources available for residents and businesses to recycle may be even more important. According to the 2023 EGLE Recycling Report, 75 percent of Michigan households, or about 2.9 million households, have access to curbside recycling or drop-off locations. Digging deeper into this statistic, according to a University of Michigan March 2022 Michigan Public Policy Survey on Recycling, the majority of counties (which are viewed as different than local jurisdictions such as cities, townships and villages) provide access to a drop-off recycling facility (78%) household hazard waste collection (77%) and household electronic equipment collection (71%). Fifty-three percent of counties provide curbside recycling services (shown in Chart 4), and 41 percent of local jurisdictions provide those services (Chart 5).

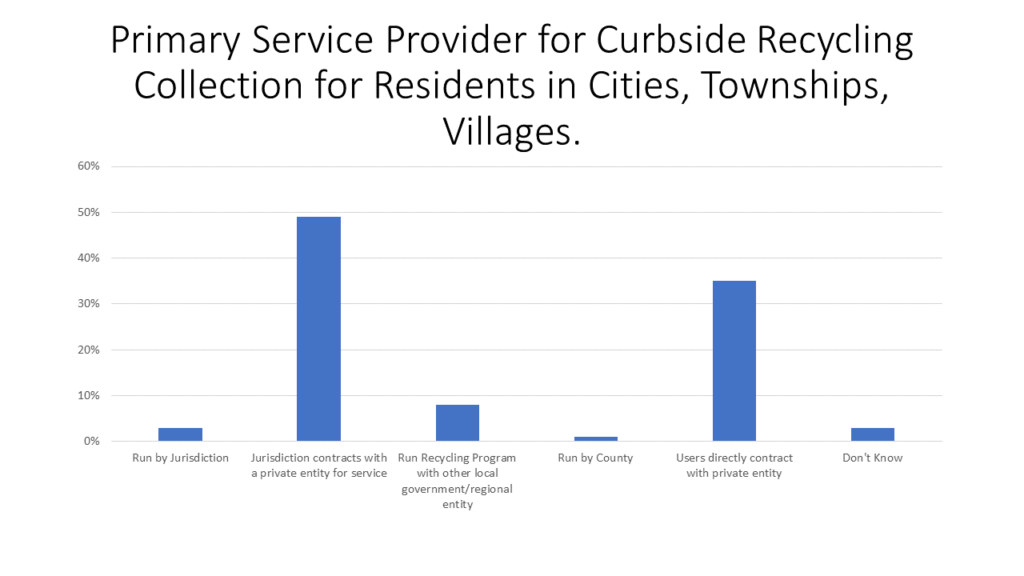
Chart 6 digs deeper into how those curbside recycling services are provided, as described in the survey. According to the survey, 49 percent of Michigan local government jurisdictions contract with a private entity to provide curbside recycling services, and 35 percent of those jurisdictions have their residents directly contract with a private entity for such services. It is important to remember that these jurisdictions range from populations of 1,000 or less to 30,000 or more. Seventy-eight percent of jurisdictions with populations of 30,000 or more contract with a private entity to provide curbside recycling services to their residents while 47 percent of jurisdictions with populations between 5,000 and 10,000 have their residents directly contract with a private entity, and 40 percent of jurisdictions with populations between 1,500 and 5,000 also have their residents directly contract with a private entity.

Through the data highlighted we know that there are various levels of recycling services provided to residents and businesses to make this sustainability effort easier. We also know that it is not just the state’s priority to increase recycling rates, but also local jurisdictions’. For example, of the $460 million invested in recycling over the last several years,  about 80 percent of it has come from local government, nonprofits, and businesses across the state. But, while  our efforts are increasing, the amount of waste Michigan accepted into its landfills increased between 2021 ( 50,918,462 tons) and 2022 (51,990,037 tons). It is important to note that the amount of waste Michigan dumped into its landfills decreased between 2021 and 2022, but the amount it accepted from Canada and other U.S. states increased. Overall, 76 percent of the waste in Michigan’s landfills is from Michigan, 18.6 percent is from Canada and 5.3 percent is from other states.

The State of Michigan has made great strides in its commitment to recycling, with greater transparency, more data and more resources available. But the other key piece of addressing Michigan’s (and the country’s) climate change issue is reducing the amount of waste that goes into landfills through reduction of consumption. Additionally, the practice of accepting solid waste from other states and countries must also be halted.

Municipalities Embracing Programs to Combat Climate Change

The impacts of climate change are growing every year, and while those impacts vary by location, they are evident and growing. As individuals we directly impact climate change through our behaviors, for better or worse, and while personal actions can bring great change, governmental policies and programs can have lasting effects. We often hear about the climate action policies and programs set forth by the federal and state government, but local governments are stepping forward to combat climate change as well. Through the creation of sustainability offices and positions, the implementation of climate action plans, the building of climate resiliency hubs, and more, local governments throughout Michigan are stepping up to improve their residents’ quality of life.

Some noteworthy examples of local government sustainability practices and programs include:

Ann Arbor: In 2022 a 20-year, 1 mill climate-action tax proposal was approved by voters to provide funds for the city to investment in renewable energy and other initiatives that will allow Ann Arbor to reach carbon-neutrality, or the A2Zero goal, by 2030. The millage revenue will fund programs and services that will include rebates for households and businesses to use solar or geothermal energy and make energy-efficiency upgrades, the growth of accessibility of electric vehicle chargers, the creation of rain gardens, more tree plantings and increases in recycling, composting, pedestrian/cycling infrastructure and more. In addition to having community support for climate action programs, Ann Arbor also has a Sustainability Office dedicated to the sense of urgency required to combat and alleviate the impacts of climate change. The work of this office is guided by the Ann Arbor Carbon Neutrality Plan: A2ZERO. Ann Arbor’s commitment to carbon neutrality is clear, not only through its adopted policies but also through its funding allocations. From staffing to a contract selection process that prioritizes outside organizations with sustainability practices, Ann Arbor’s commitment to improving the environment, and lives, through sustainable practices is clear.

Detroit: The state’s largest city has a Sustainability Office with the mission of leading initiatives that reduce emissions, increase resiliency and improve residents’ quality of life. This office carries out items from the City’s Climate Action Agenda and Strategy, administrates Detroit’s Solar Neighborhood Initiative and aims to reduce waste and accelerate energy efficiency in Detroit. The Solar Neighborhood Initiative is one of the many programs being implemented to combat climate change. This program aims to turn 250 acres of vacant land in the city into solar energy centers that will generate enough clean energy to offset the electricity used currently by 127 city buildings. The locations will be selected in early 2024.

Additionally, Detroit just opened its first Resilience Hub at AB Ford Park called the Lenox Center, which is located on the city’s east side near the Detroit River. The Lenox Center is one of three resilience centers being brought to the eastside of Detroit through the Resilient Eastside Initiative. The other two are the Eastside Community Network’s headquarters at Stoudamire Wellness Hub near Conner and Warren, and Brilliant Detroit’s literacy center in the Chandler Park neighborhood. The Resilient Eastside Initiative is a collaborative effort between the Eastside Community Network (ECN), the City of Detroit, Brilliant Detroit, and Elevate, a nonprofit based in Chicago. Resilience hubs were built to be able withstand many of the impacts of climate change, serve as centers for emergency management, reduce carbon pollution and bring a community together regularly.

Macomb County: Through the Resilient Macomb project, a land use and community development project focused on the natural resources in Harrison and Chesterfield townships, New Baltimore and St. Clair Shores (all along Lake St. Clair), management of the areas climate variability and its impacts were studied. This project focused on the coastal issues of the area (flooding, water quality) and how they can be addressed while improving the economic opportunities in the area. This study/report was developed by the Land Information Access Association (LIAA), a nonprofit community service and planning organization headquartered in Traverse City, Michigan, and is now in the process of being implemented.

Monroe County: The Resilient Monroe was sponsored by the City of Monroe, Frenchtown Charter Township and Monroe Charter Township and resulted in a Resilient Monroe Resource Atlas. This atlas provides several recommendations focused on increasing use of multi-modal transportation, supporting local agriculture and buying from such producers, and protecting water systems. The document also focuses on growing the area’s economy while understanding the changing environment. 

While these are some notable programs and policies in place by local government entities to combat climate change and promote sustainability, many others are also doing what they can. For example, the City of Ferndale has a sustainability coordinator and office that focuses on programs such as their Waste Reduction and Recycling Master Plan and their Greenhouse Gas Inventory Report. Cities throughout the state are installing rain gardens to help prevent flooding and promote natural landscaping. Sustainability citizen groups administrated by municipalities, all with the goal of bringing buy-in to sustainable practices, also occur throughout the state. Regional organizations, such as the Southeastern Michigan Council of Governments and the Michigan Municipal League host seminars, pull together municipal leaders for greater thought power and create programs all aimed reducing the impacts of climate change and increasing resiliency.

To witness such steps occurring beyond the state and federal levels is inspiring, but remaining committed to the implementation is key, as is weaving the principles of sustainability into all goals, policies and programs. As has already been shown, climate change is impacting Southeast Michigan through more heat waves, flooding and extreme precipitation events. To combat these impacts, and the impacts of our actions at a global scale, both large and small changes in how we conduct our lives-from grocery shopping to the work we perform to how obtain our energy and beyond-must be altered, with the goals being centered around carbon neutrality and sustainability. The programs and policies discussed in this post can serve as guide posts for all municipalities to explore and tailor to their communities’ makeup and needs.

Michigan’s Minimum Wage Increases, Changes Could Still Be Coming

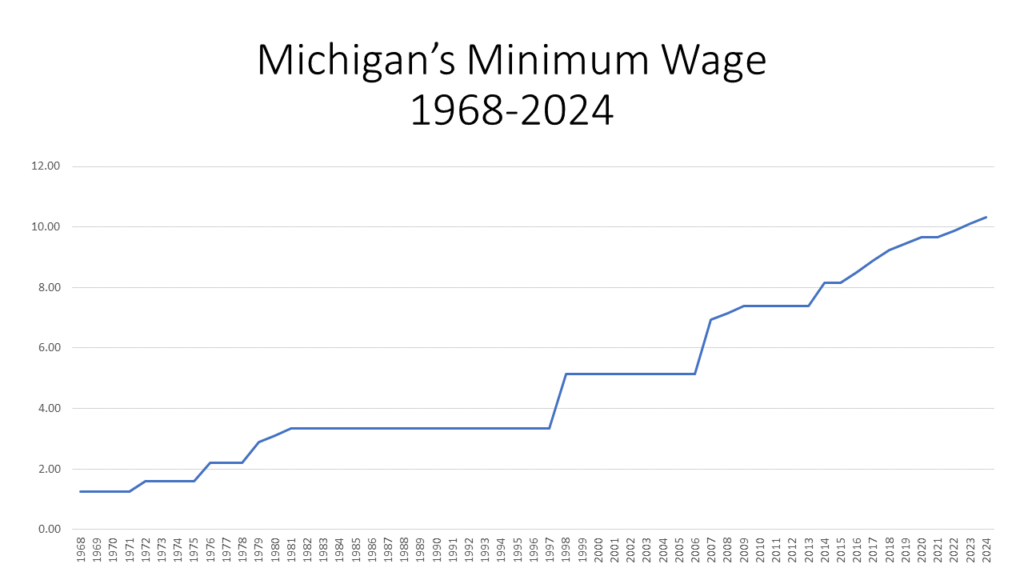
Michigan’s minimum wage increased to $10.33 on Jan. 1, 2024, in accordance with the Improved Workforce Opportunity Wage Act of 2018. Under the law as it currently stands, the minimum wage is set to increase to $12.05 an hour by 2030, depending on the state’s unemployment rate. Furthermore, the tipped wage rate will increase to $3.93 an hour. Depending on a Michigan State Supreme Court ruling though, the hourly rate improvements could shift.

In 2018 a petition to increase Michigan’s minimum wage to $12 by 2022, while also accounting for inflation, received 280,000 signatures from voters. The Republican-led Michigan Legislature at the time adopted the language of the petition but then amended the language. These amendments slowed plans to increase Michigan’s minimum wage and also eliminated the plan to eventually eliminate the lower tipped wage in restaurants, instead maintaining the wage rate at 38 percent of the full minimum wage. This issue has been in Michigan Courts, with the focus specifically being on the legality of the legislature adopting petition language and then amending it. The Michigan Court of Appeals issued an opinion ruling that found the Michigan Legislature did not act unconstitutionally when it adopted petition language and amended in the same session in 2018. This opinion has been appealed and the issue is now being taken up by the Michigan Supreme Court.

As is shown in the chart below, Michigan’s minimum wage has been steadily increasing since 2015 when it was $8.15 an hour. Prior to that it plateaued at $7.40 an hour between 2009 to 2013. Michigan’s minimum wage also remained stagnant between 1998 and 2006, 1981 to  1997, 1976 to 1978, 1972 to 1975 and 1968 to 1971, according to the Federal Reserve Bank of St. Louis.

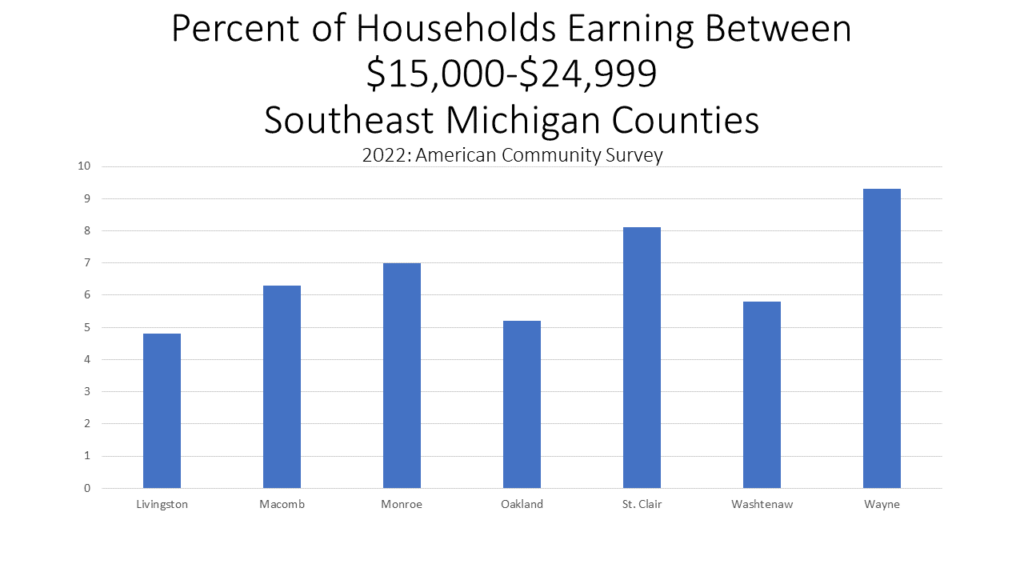
In theory, increasing the minimum wage will also increase the earnings of most low-wage workers. With a minimum wage of $10.33 an hour in 2024, a full-time worker earning that wage could make about $21,400 a year, assuming they worked 40 hours a week for a full year. This would be an increase, if making the same assumptions, from an annual salary of about $20,500 a year with an hourly rate of $10.10 (2023 minimum wage).  According to the US Census Bureau, less than 10 percent of households in each county in Southeast Michigan made between $15,000 and $24,999 a year in 2022. So, even with a minimum wage increase, many of those households earning below $25,000 a year will remain under that threshold. This is a threshold that is below the poverty level for a family of four.

According to Healthcare.gov, an individual earning $13,590 or below in 2022 was considered to be living at or below the poverty level, this number increased to $14,580 in 2023. For a family of four the poverty level was $27,750 in 2022 and $30,000 in 2023.

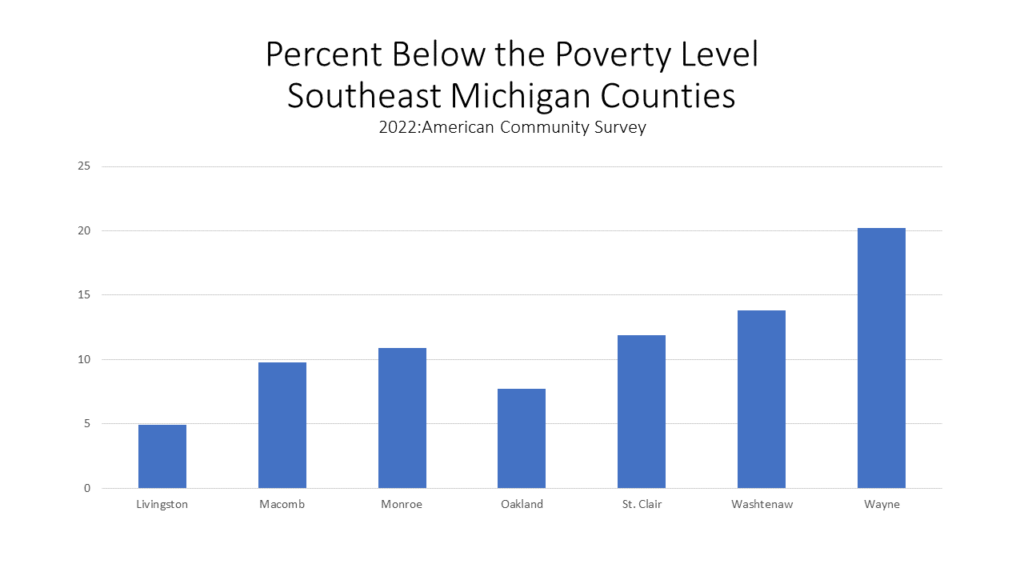
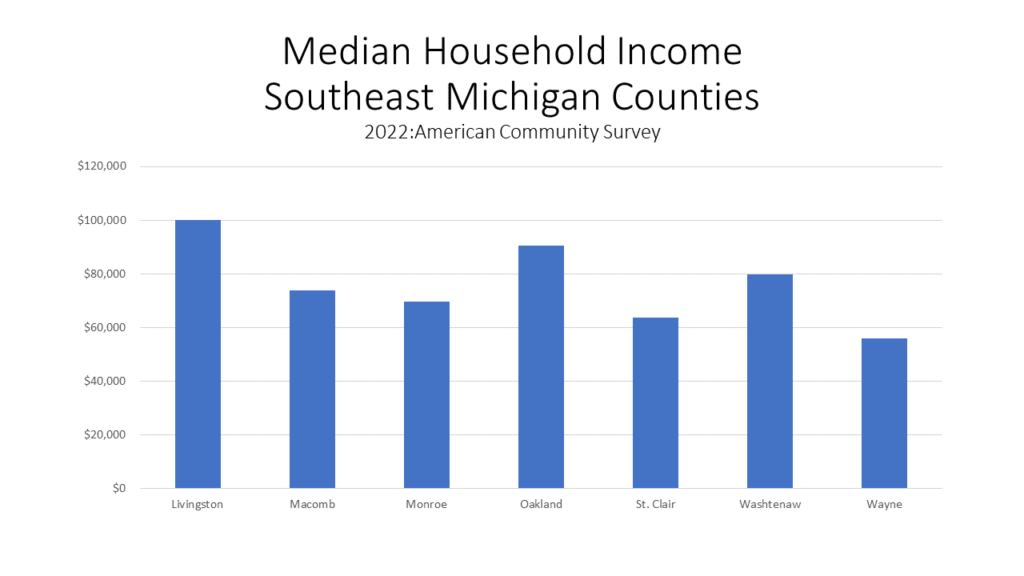
In 2022, the year for which the most recent data is available, Wayne County had the highest percentage of households living at or below the poverty level in the seven-county region at 20.2 percent. Monroe, St. Clair and Washtenaw counties were the only other ones in the region with more than 10 percent of households living at or below the poverty level. Wayne County also had the highest percentage of households earning between $15,000 and $24,999 a year at 9.3 percent. Furthermore, Wayne County had the lowest median household income in the region at $55,867. Livingston County had the lowest percentage of households living at or below the poverty level in 2022 at 4.9 percent and had the highest median income at $100,139.

So, while the minimum wage increased in Michigan, and helping those with among the lowest earnings in the state, the gap between the minimum wage and a living wage still exists. A living wage is the hourly rate that an individual in a household must earn to support his or herself and their family. According to the Massachusetts Institute of Technology, $16.27 an hour is the amount an individual needs to earn to make a living wage.

An increased minimum wage not only increases the earnings of some of Michigan’s lowest earning workers, but it also has been shown to have positive impacts on physical and mental health, well-being and educational outcomes.

Signs Show Evidence of an Economic Slow Down in Michigan

Michigan is not experiencing a deep recession but there are signs that the economy is beginning to slow down. From unemployment rates to the cost of housing, the signs of a recession are evident, and according to presentations given at the Detroit Economic Club on April 13, a recession will likely start this summer.

One telltale sign of a slowing economy is an increased jobless rate. In Michigan, the unemployment rate has remained steady, and amongst recent lows, since June of 2022 though. In February of 2023 the state unemployment rate was reported at 4.3 percent. According to the Michigan Department of Technology, Management and Budget, layoffs are occurring though. In through March of 2023, 14 companies sent notices of layoffs or closure notices, or Worker Adjustment and Retraining Notifications (WARN). These 14 companies sent a total of 2,112 notices, with Prospect Airport Services in Detroit sending the most at 516. Comparatively, by the same time in 2022 six companies sent layoff notices and in 2021 three companies had sent layoff notices. Also, according to news reports, General Motors is offering buyouts to up to 3,500 salaried workers, and Stellantis is cutting and consolidating at least 408 positions at the Detroit assembly plants.

While the recent Stellantis layoff notices are not reflected in the most recent Detroit unemployment data, how large companies are restructuring should be kept in mind with a possible recession looming. According to the Michigan Department of Michigan Technology, Management and Budget unemployment in Detroit declined to 7.7 percent in February of 2023; in February of 2022 the unemployment rate was at 12.1 percent.

The chart below provides a more detailed look at unemployment rates throughout Southeast Michigan, both currently and a year ago. According to the data, unemployment rates for all seven counties in Southeastern Michigan were less in February of 2023 than they were in February of 2022. Monroe County had the highest unemployment rates in both February of 2023 and 2022 at 5.1 and 6.2, respectively.  Wayne County had the largest decrease in its unemployment rate between February of 2022 and 2023 at 1.8 percent. In February of 2022 Wayne County’s unemployment rate was 6.2 percent, and in 2023 it was 4.4 percent.

Livingston County continued to have the lowest unemployment rate in the region at 3 percent in February of 2023, followed by Washtenaw County with an unemployment rate of 3.5 percent.

Home prices in Metro-Detroit again decreased in January of 2023, according to the Case Shiller Index. In January of 2023, the average price of single-family dwellings sold was $168,300 , a decrease of $1,190 from the average price of a home in December of 2022. This was the largest decrease in the average home prices in Metro-Detroit since December of 2020.

While the month-to-month trend of prices increasing is easing up a look at data from year’s prior shows just how much prices have increased overall. Between January of 2023 and 2022 the average price increased $4,960; between January of 2022 and 2020 the price increased $39,020 and between January of 2023 and 2014 the average price has increased $74,380.

Opioid Harm Reduction Programs in Michigan as Overdoses Continue to Rise

The fact that Michigan is experiencing an opioid epidemic has been well-established. With fatal overdoses on the rise, particularly in Washtenaw and Wayne counties it is vital to not only acknowledge that the epidemic is in fact in full swing, but that there is hope by way of harm reduction practices. According to the US Centers for Disease Control, “harm reduction is a public health approach that focuses on mitigating the harmful consequences of drug use, including transmission of infectious disease and prevention of overdose, through provision of care that is intended to be free of stigma and centered on the needs of people who use drugs.” Harm reduction activities include naloxone distribution, provision of sterile syringes, education and prevention regarding overdoses and safer drugs and other activities that can lessen the risk of adverse outcomes associated with using drugs. 

Several harm reduction activities are offered throughout Michigan, and administered through various organizations. For example, in Michigan various places have naloxone portal kits that have been distributed through the Michigan Department of Health and Human Services (MDHSS). A naloxone portal kit typically contains two doses of naloxone, two nasal misters and directions on use. Naloxone is a medicine that reverses the effects of opioid overdoses, restoring normal breathing and consciousness of a person experiencing overdose symptoms (Narcan is the nasal spray version of this).

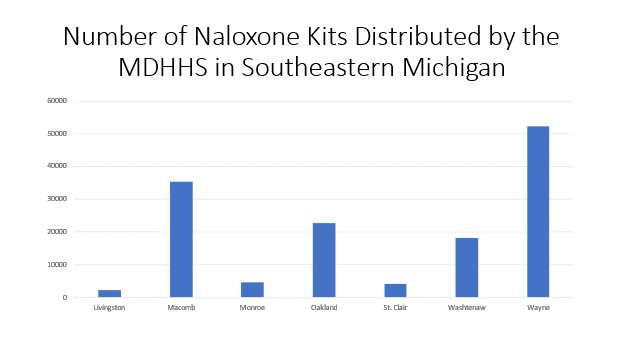
According to MDHHS, Wayne County had the highest number of naloxone kits distributed to various organizations by the end of 2022 at 52,464. Macomb County had the second highest number of kits at 35,328 and Livingston County had the lowest number of kits distributed to various organizations by the MDHHS by the end of 2022 at 2,148. The type of organizations these kits were distributed to include first responders, courts, treatment and recovery centers, correctional facilities, health departments, academic institutions and community organizations and non-profit organizations. Throughout Michigan, community organizations and non-profit organizations received the highest number of kits. Of the 334,152 kits distributed throughout Michigan by the end of 2022, 198,780 (or 59%) of the kits were distributed to community organizations and non-profit organizations, according to the MDHHS.

Academic institutions were also included in the list of organizations that receive and distribute naloxone kits. Through Wayne State University’s Center for Urban Studies, the AmeriCorps Community Training for Overdose Rescue (ACT) administers free training for Southeast Michigan community members to prepare people to provide aid during an overdose emergency while waiting for help to arrive. All training participants receive a free Overdose Preparedness Kit containing Narcan. Such training is part of the Strategies and Tools for Overdose Prevention (STOP) program, which is a harm reduction initiative conducting research, delivering training and distributing naloxone in Southeast Michigan. Since October 2019, the ACT/STOP program through the Center for Urban Studies has hosted 235 overdose rescue training sessions and equipped 3,501 people with the skills and knowledge to provide first aid during opioid overdose emergencies.

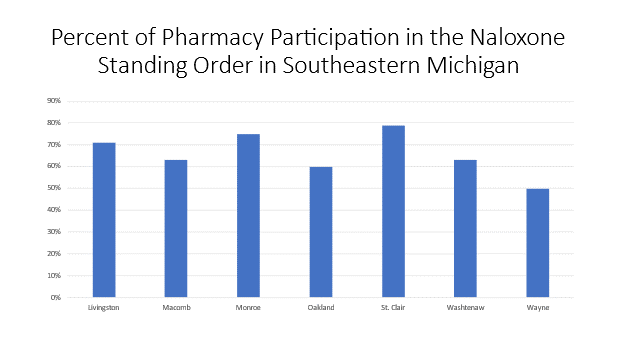
Another harm reduction tool for opioid use in Michigan is the standing order issued the by the MDHHS that allows licensed pharmacies to dispense naloxone to the public. Of the percent of registered pharmacies in each of the seven counties in Southeast Michigan, St. Clair County had the highest percentage of pharmacies participating the in the standing naloxone order at 79 percent (26 pharmacies). Wayne County had the lowest participating at 50 percent (319 pharmacies).

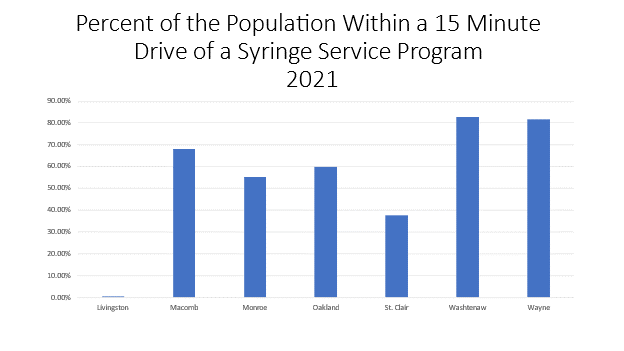
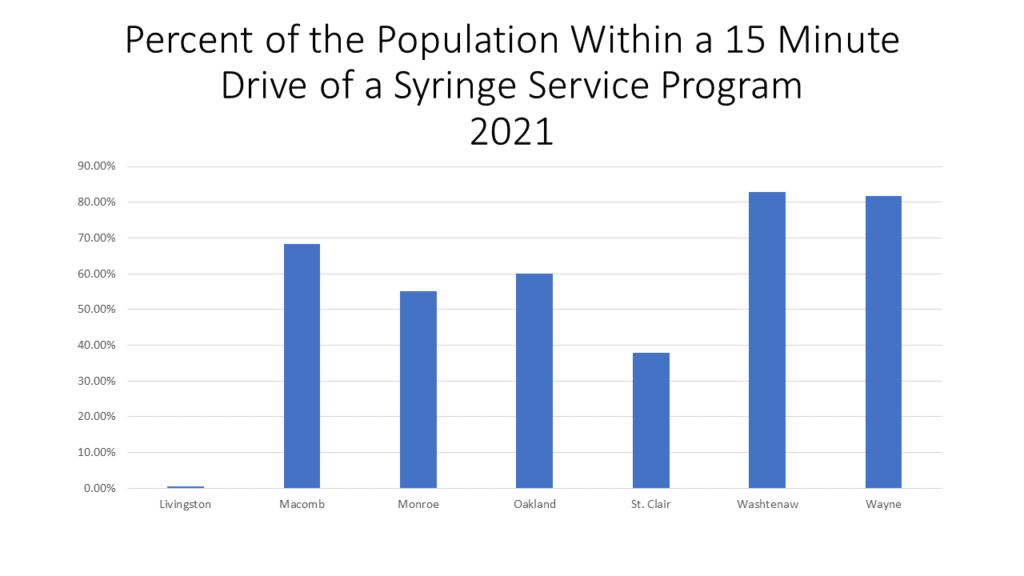
An additional harm reduction practice is the existence of Syringe Service Programs. These data below shows the percent of the population within a 15-minute drive of a Syringe Service Program funded by the MDHHS. These programs are considered a form of harm reduction because they offer sterile injection equipment and provide a linkage to substance use disorder treatment.

Washtenaw County had the highest percentage of the population that lived within a 15-minute drive of a Syringe Service Program in Michigan at 82.9 percent. Wayne County had the second highest percentage of the population within a 15-minute drive of a Syringe Service Program at 81.7 percent.

Livingston County had the lowest percentage regionally with 0.5 percent of the population being with a 15-minute drive to a Syringe Service Program. While this percentage was much lower than the other counties’, Livingston County had the 53rd highest percentage of the population within a 15-minute drive to a program.

The use of Buprenorphine is harm reduction to meant to treat opioid disorder.  Buprenorphine is a medication approved by the Food and Drug Administration to treat opioid use disorder.

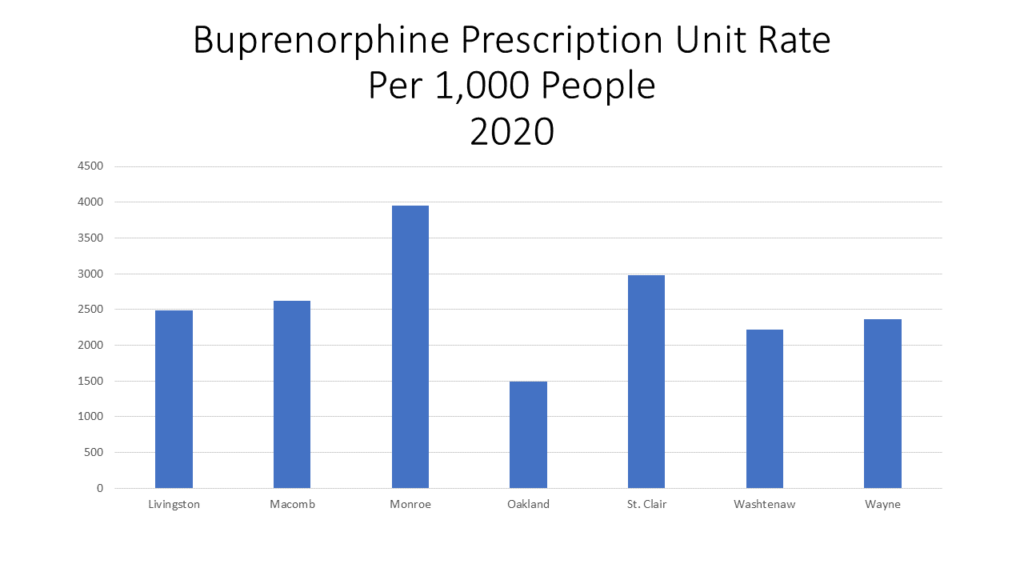
In Southeast Michigan, Monroe County had the highest Buprenorphine prescription unit rate per 1,000 people in 2020 at 3,950.5, followed by St. Clair County with a rate of 2,978.5. Higher rates of Buprenorphine are viewed as favorable in the calculating the MI-SUVI rate because the drug aims to treat addiction. Oakland County had the lowest Buprenorphine prescription rate at 1,485.6 per 1,000 people.

The Buprenorphine rate is based on the prescription units.

As shown, harm reduction programs and policies are in motion in Michigan. And while opioid use still continues, these approaches, according to the CDC, have been proven to prevent death, injury, disease, overdose, and substance misuse.

Even with such programs in place, overdoses do still occur. It is important to be aware of the signs and to know what to do in the event someone has overdosed. According to the ACT/STOP training, signs of an opioid overdose are:

  • Pinpoint pupils
    • Not breathing normally (infrequent or no breathing at all, deep snoring or gurgling)
    • Pale – lips and fingertips may be blue/gray
    • Not responsive to touch or sound
    • Signs of substance use around: syringes, pill bottles, other substances.

Should someone be experiencing an overdose, you should decide to help. Michigan’s Good Samaritan Laws protect you from legal action and lawsuits if unintended consequences result from your assistance.

Ways to help include, if someone is not breathing normally, begin hands-only CPR right away and call 911 immediately. If someone is unconscious but breathing normally, administer Narcan then place them in the recovery position.

For more information on Wayne State University Center for Urban Studies’ ACT program click here. You can also find information on Syringe Service Programs and how to receive naloxone here.

Young Females, Black Community Impacted by Opioid Use, Overdose

We know, according to the new Michigan Substance Use Vulnerability Index (MI-SUVI), that St. Clair and Wayne counties are the most vulnerable when it comes to substance use in Southeastern Michigan. Additional data shows that it isn’t just residents of those counties who are vulnerable to opioid use, and related harm, though. Rather the black community and the young female population appear to be amongst the most vulnerable populations when it comes to opioid use, death and related Emergency Department visits.

In general, we know that the number of opioid related deaths are increasing across the State of Michigan.  When examining just the number of opioid related deaths in Southeastern Michigan we also know that Wayne County has the highest number of such deaths, in part due to it having the highest population in the state. However, the chart below shows that in recent years only Wayne and Macomb counties have been experiencing noticeable increases in the number of opioid related deaths. In 2020, Wayne County recorded 706 opioid related deaths and Macomb County reported 269; these are increases from the 660 opioid related deaths Wayne County recorded in 2019 and the 215 Macomb County recorded.  Monroe County also experienced an increase in the number of opioid related deaths between 2019 and 2020.

It should be noted that while the state has some data for opioid related deaths in 2021 it was not accessible at the county level. Additionally, data for opioid related deaths in Oakland County was not available for the year 2018 and beyond; this data was suppressed according to the Michigan Department of Health and Human Services.

As the data below shows, males in Michigan have regularly had a higher number of opioid related deaths as compared to women. In 2021 there were 1,528 opioid related deaths amongst Michigan males and 672 amongst Michigan females. (See the chart below.) In 2000, when the data started to be tracked, there were 98 and 25 opioid deaths, respectively. While the number of opioid related overdose deaths for both males and females has been growing, officials are also zeroing on data related to a specific age group of females.

According to the State of Michigan, in 2021, most overdose Emergency Departments visits among young women and girls were intentional and related to self-harm. According to the State, there were 602 more intentional overdose Emergency Department visits among females between the ages of 11-24 years old than in 2020. This was a 30 percent increase. These data further indicate that only 2 percent of that overdose Emergency Departments visits were related to opioids (40% Non-opioid analgesics, antirheumatics, and antipyretics, 25% were related to anti-depressants and 3% were related to psycho-stimulants).

These data indicate how important mental health is in substance use and addiction. That are many factors that impact a person’s mental health, but this recent study by the State highlights how young women are just one group with an increased risk of substance use and its impacts.

The data below shows the number of opioid related deaths for Black males and females and White males and females to further show the details of opioid death trends. While the raw numbers highlight that White Males have always had the highest number of opioid related deaths (1,199 in 2021), followed by White females (542 in 2021), the number of opioid related deaths in the Black male community are rapidly increasing.

In 2000 there were 32 opioid related deaths in the Black male community and by 2021 that increased to 492. The Black female community had 19 reported opioid related deaths in 2000 and by 2021 that increased to 216. The data clearly shows an increase, but we must also be considered that much of this may be related to measurement or aggregation of the data.

According to the Michigan Overdose Data to Action Dashboard, between August 2021 to July 2022 759 Black Michiganders died from an opioid overdose. According to the National Institute on Drug Abuse, the trend we are seeing in Michigan of increased opioid related deaths is also a national trend. According to the institute, Black individuals in four U.S. states(New York, Massachusetts, Kentucky, Ohio) experienced a 38 percent increase in the rate of opioid overdose deaths between 2018 to 2019. Many of these overdoses were driven by heroin and fentanyl, according to the National Institute on Drug Abuse.
While these numbers continue to increase, the focus on the addressing the forces behind these overdose deaths, including the harm reduction from the drugs themselves and the breakdown of societal structures that contribute to them, are increasing. According to NIDA Director Nora D. Volkow, M.D.,  ”systemic racism fuels the opioid crisis, just as it contributes mightily to other areas of health disparities and inequity, especially for Black people.”
As we have briefly touched on, the way to tackle the opioid epidemic in our state, and our country, is to create multi-faceted policies and programs that directly address specific communities. There is no blanket approach to tackling the opioid epidemic, but as we will show in our next post, several programs in Michigan are making headway.

Michigan’s Substance Use Vulnerability Index Highlights Wayne County as one of State’s Most Vulnerable

In Southeast Michigan, St. Clair and Wayne counties are the most vulnerable when it comes to substance use, according to the Michigan Substance Use Vulnerability Index (MI-SUVI). This index provides a score, balancing the eight factors listed below:

  • Overdose death rate
  • Nonfatal overdose emergency department visit rate
  • Opioid prescribing rate
  • Drug-related arrest rate
  • Percent of the population within a 30-minute drive to a treatment center
  • Percent of the population within a 15-drive drive to a syringe service program
  • Buprenorphine prescribing rate
  • And the Social Vulnerability Index (This is the Centers for Disease Control’s own measure that looks at social detriments to health, like technology access and healthcare access. We explored this in a previous post.)

The scores above are separated into three categories (Burden Rank, Resource Rank and Social Vulnerability Rank), each receiving a score in and of itself. Once the factors and rankings are determined, a final score is then provided to determine the vulnerability of an area to substance use. The factors listed below all use data from 2020, 2021 or an average of 2016-2020.

The information described above is part of the State of Michigan’s new Overdose data to Action Dashboard, which digs deep into the data above, serving as resource to stakeholders across the state who are working to address substance use disorders.

In this post we not only show the percentile rank of MI-SUVI scores for each of the seven counties in the region, highlighting which ones have higher or low index scores, but also dig deeper into the factors behind each score.

As noted, Wayne and St. Clair counties had the highest MI-SUVI index percentile ranks in the region at 97.6 percent and 59 percent, respectively. Wayne County not only had the highest index in the region, but the second-highest in the state (Oscoda County had the highest index in the state at 98.8 percent). In other words, Oscoda County was the most vulnerable county when it came to substance use and Wayne County was the second most vulnerable county.

What contributed to such a high score? Well, as shown through several data points below, Wayne County had the highest fatal and nonfatal overdose rates in the region in 2020 and is in the middle-third of opioid prescriptions issued in a county statewide. Wayne County does provide a greater amount of access to resources that some counties throughout the state and region, but even so, its burden rank weighs heavily on the county’s scoring.

Livingston County had the lowest Michigan Substance Use Vulnerability Index percentile rank at 1.2 percent. Overall, Livingston County ranked 83rd on the MI-SUVI index—there are 83 counties in Michigan. This ranking is because of its low burden and social vulnerability index rankings and its average resource ranking.

Between 2016 and 2020 the five-year average for the number of all fatal overdoses in Wayne County was 42.1 per 100,000 people, according to the Michigan Opioid Data to Action Dashboard.  Wayne County had the second highest fatal overdose rate in the state; Genesee County had the highest rate at 42.9. Regionally, Macomb County had the second highest fatal overdose rate at 37.3 per 100,000.

Oakland County had the lowest five-year average fatal overdose rate per 100,000 people at 13.4.

Regionally, Wayne County also had the highest non-fatal overdose emergency room visit rate per 100,000 people at 427.8. This rate ranked fourth in the state. The drug overdoses counted for this emergency room visit category represents all drug overdoses—not just opioid overdoses. St. Clair County had the second highest non-fatal overdose emergency room visit rate per 100,000 people at 365.8. Livingston County had the lowest rate at 170.3.

The rates for this data set are based on a three-year average between 2016-2020.

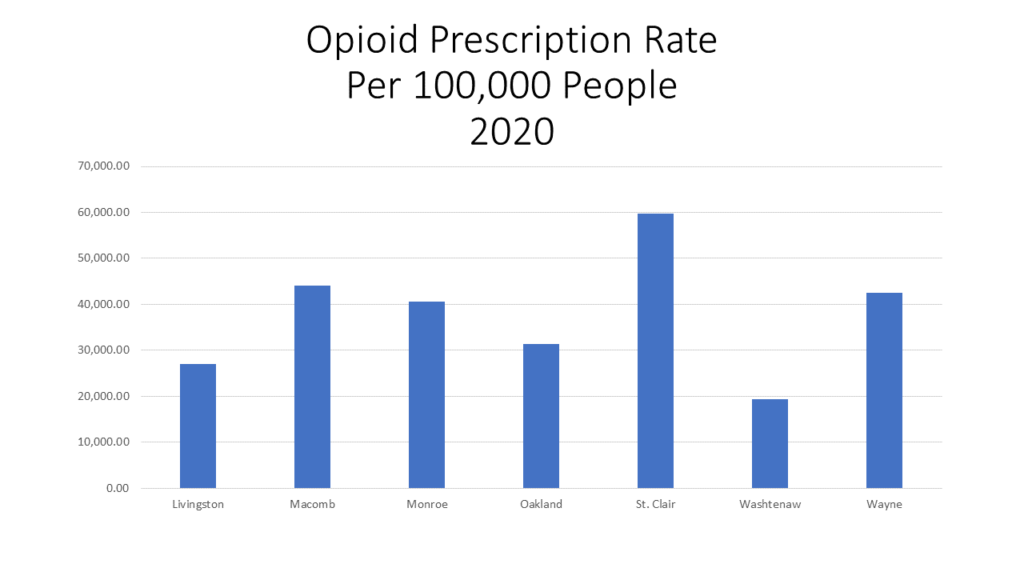
For the opioid prescription rate per 100,000 people, it was not Wayne County that had the highest rate regionally, but rather St. Clair County. In 2020, according to data from the Michigan Overdose Data to Action Dashboard, St. Clair County had an opioid prescription rate of 59,685.5. St. Clair County had the 15th highest opioid prescription rate in the state. Wayne County had an opioid prescription rate of 42,580.2 per 100,000 people, which was the 52nd highest rate in the state.

Regionally and statewide, Washtenaw County had the lowest opioid prescribing rate of 19,420.8.

The opioid prescription rate is based on the number of prescription opioid units dispensed to treat pain.

The percent of the population within a 15-minute drive of a Syringe Service Program measure is one of the factors in the MI-SUVI rate because it is a harm reduction indicator. This indicator represents the number of Syringe Service Programs funded by the Michigan Department of Health and Human Services. These programs are considered a form of harm reduction because they offer sterile injection equipment and provide a linkage to substance use disorder treatment.

Washtenaw County had the highest percentage of the population that lived within a 15-minute drive of a Syringe Service Program in Michigan at 82.9 percent. Wayne County had the second highest percentage of the population within a 15-minute drive of a Syringe Service Program  at 81.7 percent.

Livingston County had the lowest percentage regionally with 0.5 percent of the population being with a 15-minute drive to a Syringe Service Program. While this percentage was much lower than the other counties’, Livingston County had the 53rd highest percentage of the population within a 15-minute drive to a program.

Buprenorphine is a medication, approved by the Food and Drug Administration, to treat opioid use disorder. Access to this prescription is also viewed as a harm reduction indicator, which is why it is one of the factors in determining the MI-SUVI rate of a county.

In Southeast Michigan, Monroe County had the highest Buprenorphine prescription unit rate per 1,000 people in 2020 at 3,950.5, followed by St. Clair County with a rate of 2,978.5. Higher rates of Buprenorphine are viewed as favorable in the calculating the MI-SUVI rate because the drug aims to treat addiction. Oakland County had the lowest Buprenorphine prescription rate at 1,485.6 per 1,000 people.

As with the opioid prescription rate, the Buprenorphine rate is based on the prescription units.

The data discussed above provides a fair amount of insight into the ever-growing concerns and consequences of opioid addiction across Southeast Michigan and the state. And while we have a better understanding of what counties are more vulnerable to the impacts of this disease than others, there is still much more to be known. Over the next several weeks we will further examine the hard reduction programs in place—what services they offer, what their impacts are and how they are growing in numbers. We will also dig deeper into who is most impacted by opioid addiction and what factors impact that. And finally, we will discuss the National Opioid Lawsuit and its impact on Michigan and its communities.

Just as with addiction itself, understanding the intricacies of the data presented by the State is vital in establishing a comprehensive and effective plan to reduce the harm, and existence itself, of opioid addiction.

Climate Change in Michigan–Now and in the Future

Climate change is multi-faceted in both its causes and effects. In Michigan, and more specifically Metro-Detroit, many of the causes of these drastic shifts in weather patterns are the same across the globe— the continued use and overuse of fossil fuels, increased carbon emissions, desecration of natural resources. What are the effects?

Increased Average Temperature

Temperatures have already risen 2.5 degrees in Michigan. Summers are hotter, and heatwaves are stronger and last longer. Fast forward to 2100, summers in Isle Royale National Park are expected to 11 degrees hotter, according to statesatrisk.org.

The chart below shows just how Michigan’s annual daily temperatures have changed since 1900 and how they are expected to change up to 2100, depending on the amount of emissions we continue to pump into the environment. The observed data is through 2020 and shows that Michigan’s average temperature has increased by nearly 3 degrees (Fahrenheit) over time. According to the data set from The Cooperative Institute for Satellite Earth System Studies and the National Oceanic and Atmospheric Administration (NOAA), even with lower emissions temperatures are expected to increase in Michigan by a minimum of 3 degrees through 2100. That number could increase to at least 12 degrees though if the emissions we produce increase.

Increased Flooding

With increasing temperatures that means hotter air, which holds more water. More water means storms produce heavier rainstorms that are slower to move on, meaning greater accumulations of rain.

In 2020 30,000 residents of Southeast Michigan found their homes flooded. Six years earlier, in 2014, there was another great flood—these 100 year events happened within six years of each other.

According to the June 2021 report “Household Flooding in Detroit” by Healthy Urban Waters, in partnership with the Wayne State Center for Urban Studies and others, 43 percent of 4,667 Detroit households surveyed between 2012-2020 reported household flooding. Furthermore, in an online Detroit Office of Sustainability survey published in 2018, 13 percent of those survey reported they experienced flooding very often; 23 percent reported they experienced flooding somewhat often and 32 percent reported they experienced it occasionally. Additionally, a cross-sectional study published in 2016 of 164 homes in Detroit’s Warrendale neighborhood indicated that 64 percent of homes experienced at least one flooding event in during that, with many experiencing three or four events, according to the report.

The map below is a projection map developed by the Great Lakes Integrated Sciences and Assessments group that shows how precipitation is expected to increase in Southeastern Michigan and the middle of the state to about 2.25 inches between 2040 and 2059 with increased emissions. While Southeastern Michigan will face continued potential flooding events, the data prediction also shows that the western side of the state will have a decrease in precipitation.

An Increased Number of Heat Islands

A heat island, according to the US Environmental Protection Agency (EPA), is an area where heat is intensified due to structures, such as buildings and roads, that absorb and re-emit the sun’s heat far more than natural landscapes, such as forests and bodies of water. Urban areas, where these structures are highly concentrated and greenery is limited, become “islands” of higher temperatures relative to the outlying areas. Temperatures in such heat islands can be 1 to 7 degrees higher than neighboring areas. The Detroit metropolitan area contains heat islands.

Heat islands can be problematic, according to the EPA, because they can lead to increased energy consumption, increase the emissions of air pollutants and greenhouse gases and compromise water quality—all of which just further perpetuate climate change. Additionally, heat islands can have negative effects on human health. 

The map below was developed by the CAPA Heat Watch program, through a partnership with the National Integrated Heat Health Information System, NOAA Climate Program Office and the National Weather Service. This map was created from 2020 data and highlights how afternoon temperatures varied depending on the land coverage. For example, on the east side of the City, closer to the river, those areas have greater tree coverage so therefore tend to have cooler temperatures. However, areas with fewer trees, denser residential areas and wider streets have higher temperatures. As noted, this is how heat islands are created and these exist, for example, across the river from Belle Isle and several pockets on the City’s west side.

 Less, or More, Ice Coverage

According to the GLISA, the depth of a lake impacts how rapidly ice can form. So with a shallower lake, there is a greater chance of ice coverage. While depth impacts the ability for a lake to freezer over so does temperature, and with temperatures above freezing there is less to no ice coverage.  Less ice means moisture evaporates into the atmosphere easier, leading way to increased amounts of snow and rain in Michigan.

Also, according to the GLISA,  water temperatures in the fall determine the amount of evaporation from the lake surface because the temperature difference between the air and lake surface temperatures can accelerate evaporation, with warmer water temperatures resulting in greater evaporation. According to the GLISA, “the evaporation removes latent heat from the surface, resulting in a cooling of the surface, and the potential for greater ice cover. For example, if the previous winter experienced low amounts of ice cover (more solar warming), higher evaporation rates (strong cooling effect) during the fall would lead to increased ice cover the next winter. Conversely, cooler water temperatures during fall leads to lower evaporation rates (less cooling) thereby decreased ice cover.”

The effects of climate change on Michigan and Metro-Detroit are apparent with impacts on the daily lives of many. Over the next year we will dig into some of the major contributors to climate change in the region, what policies are being developed to combat the impacts climate change (and how they will work) and what the future of Metro-Detroit may be with a new climate to adapt do.


Revisiting the November Election as we Enter the 2023 Legislative Term

First the first time in about 40 years, Democrats will control the upcoming legislative session with Gov. Gretchen Whitmer winning re-election with 54.5 percent of the vote, Democrats winning 20 of the 38 seats in the State Senate and also winning 56 of the 110 seats in the State House of Representatives, according to official Michigan election results.

Prior to the election there was a buzz that Republicans may not only keep control of the legislature but also take control of the Governor seat (and the Secretary of State and Attorney General seats as well). But, that was not the case.

Some facts about the 2022 Gubernatorial Election as it pertains to Michigan, and Southeast Michigan?

Gov. Whitmer won 54.5 percent of the statewide vote and Republican opponent Tudor Dixon won 43.9 percent of the vote, according to official election results. In Southeastern Michigan four of the seven counties in the region voted in favor of Whitmer; those same counties also had a majority percent of voters vote straight party ticket for Democrats over Republicans. The voter counties in the region that voted in favor of Whitmer, and Democrats in general, were Macomb, Oakland, Washtenaw and Wayne counties.

Gov. Whitmer took the highest percentage of votes in Washtenaw County at 75.1 percent; 75.3 percent of Washtenaw County also voted straight party ticket for the Democrat party.

In Macomb County, which Gov. Whitmer also won in 2018 but where former President Donald Trump (R) won in 2016, Gov. Whitmer increased the percentage by which she won from the last time. In 2022 Gov. Whitmer took 51.8 percent of the vote in Macomb County. And, while this county did go blue, it had the lowest percentage of Democrat votes as compared to the other three counties in the region that also went blue. In Wayne County Gov. Whitmer garnered 70.8 percent of the vote and in Oakland County she garnered 61 percent of the vote.

Reports indicate that garnering majority of the votes from Macomb and Oakland counties played key roles in Gov. Whitmer’s win. According to MLive, the last time a candidate won the governor’s election while losing Oakland County was in 1982.

On the other side, of the seven counties in the region it was Livingston County where Dixon garnered the highest percentage of votes at 65.5 percent. In St. Clair County she had 57.8 percent of the vote and in Monroe County she had 55.5 percent of the vote.

St. Clair County had the highest percentage of straight party ticket Republican votes at 64.4 percent.
When examining the results for the State legislature we know that nearly a majority of those who returning to the State legislature are incumbents ( 53 incumbents in the 110 person House of Representatives and 22 incumbents in the 38 person State Senate). Furthermore, of the 53 House of Representatives incumbents, 20 are Democrats and 18 are Republicans. The make up of the 22 State Senate incumbent roster is 11 of whom are Republicans and 11 who are Democrats. Overall though, according to Bridge Michigan, 10 percent of incumbents who ran for re-election this year lost in either the primary or general election. One such incumbent at the Senate level was Mike MacDonald (R-Macomb Township). With the redistricting of legislative seats, MacDonald faced (state legislator) newcomer Veronica Klinefelt (D); Klinefelt garnered 53 percent of the vote and MacDonald garnered 42 percent.
As noted, Macomb County went blue for several state related races, but at the local level the Macomb County Board of Commissioners remains controlled by the Republicans and at the Congressional level a Republican won the race for the new 10th Michigan Congressional District.  

In Macomb County, Congressman-elect John James (R) won 48.6 percent of the vote and his opponent Carl Marlinga (D) took 48.4 percent of the vote in Macomb County. For the entire district, which spans into the Rochester area as well, Marlinga won 48.8 percent of the vote.

With the next legislative term ready to begin, agendas and priorities are already being discussed at the national, state and local levels. Key priorities Drawing Detroit will be giving keen attention to in the coming year include climate change topics such as heat islands, flooding, changing water, carbon and temperature levels, electric vehicle fleets and more.