Locals Push Ahead as Michigan Takes Steps Backward for LGBT Inclusivity

Just over a year ago love won nationwide when the Supreme Court ruled in favor of same-sex marriage. County courthouses across Michigan began issuing marriage licenses to those who wanted a legally recognized union, despite their sexual orientation and gender identity. However, even such a monumental move toward equality didn’t serve as a catalyst for the State of Michigan to make strides to secure other basic human rights for the Lesbian, Gay, Bisexual and Transgender (LGBT) community. In fact, state level statutes have failed to recognize equality for the LGBT community, whereas at the local level various officials are working to ensure comprehensive civil rights policies exist in the areas they have jurisdiction over.

Currently, there are 46 Michigan cities and counties, combined, which provide some type of employment and/or housing discrimination protection to the LGBT community. Fourteen of these local government entities, including three counties, are located in Southeastern Michigan. Just in Southeastern Michigan, those 11 communities with inclusive non-discrimination policies make up 23 percent of the region’s population. The three counties with such policies-Macomb, Washtenaw and Wayne-make up 64 percent of the population. But, while these efforts deserve to be applauded, many of the policies are by no means comprehensive. At the municipal level expanded civil rights policies are to be adhered to by all employers and/or housing providers. This isn’t necessarily the case at the county level though. Macomb County’s human rights policy is only extended to the county’s 2,200 current and potential employees; its contracting policy doesn’t even reflect the changes.

Both historical and recent policies, and lack thereof, at the state level have created a culture that lacks inclusion and basic human rights protections. Currently the Elliott Larsen Civil Rights Act (the state’s non-discrimination policy) does not include sexual orientation or gender identity and expression. Attempts to amend this statewide civil rights act have occurred since 1973 (a year after East Lansing and Ann Arbor adopted their policies), the most recent being 2014. The proposed 2014 amendments aimed to add exactly what is missing, however those amendments were never approved in the legislature. This lack of action and support for basic human rights continues to leave Michigan without a blanket discrimination protection for the LGBT community and a political gesture toward inclusivity.

Although the legislature failed take action on the Elliott Larsen Act, in the summer of 2015 three Religious Freedom Adoption bills became law, allowing religious organizations to deny placement of a child in a home based on religious grounds. These bills did not have direct language against the LGBT community but it can be argued they are, at least in part, targeted at by these bills. State Rep. Andrea LaFontaine said the bills were meant to protect the public-private partnership that allows Michigan to have an 80 percent adoption rate. She said,  by making the then proposed bills law, no agency would have to choose “between their faith and helping children.” The Human Rights Campaign said these laws make it even more difficult for LGBT couples to adopt, particularly as the Michigan Catholic Conference and Bethany Christian Services make up 25-30 percent of adoptions that occur in Michigan, according to information provided by Gov. Snyder’s office to the Washington Blade (link). These laws may have protected those public-private partnerships, but they also opened up another avenue for discrimination based on sexual orientation and gender identity.

Not even a year later it seems another door toward discriminatory practices could open. Proposed House Bill 5717 and Senate Bill 993, which were introduced to the Legislature a few months ago, aim to keep the use of public school restrooms restricted to those with the same biological sex; SB 993 goes as far as relying on chromosomes). Anatomy and gender are not one in the same, and while the supporters of these bills claim they are trying to protect the children, the effect is likely to be discrimination against them.

Michigan citizens do not have access to fair employment, housing and family planning options because of their sexual orientation or gender identification, and that soon may be extended to the use of the restroom. Yes, there have been concentrated attempts at the local level to broaden access to these basic human rights for over 30 years. However, some of the State’s elected leaders continue to build walls, including between children, even as local government entities and the nation tirelessly work toward acceptance and inclusivity.

Below is a timeline and a map showing the most recent years in which a Michigan municipality implemented a more comprehensive non-discrimination policy that addresses equal employment and/or housing rights based on gender identity and/or sexual orientation.

Items to note:

  • East Lansing was the first local government entity in the nation to enact to include sexual orientation in its civil rights protections. East Lansing expanded its original 1972 policy that provided employment protections based on sexual orientation to include housing protections in 1986 and to include gender identity in 2005. Since 2005 was the most recent policy amendment East Lansing is listed under 2005 in the timeline and on the map.
  • Ann Arbor adopted policies that provided residents employment and housing protections in 1972; in 1999 it expanded those protections to include gender identity. Ann Arbor is listed as amending its policies in 1999, not 1972, because that was the most recent change.
  • Detroit updated its initial 1979 employment and housing protections beyond sexual orientation to include gender identity in 2008. Detroit is listed as adopting comprehensive non-discrimination policies in 2008 because, again, that was the most recent year they were updated.

Slide14 LGBT

Zippia: Michigan’s Living Wage is $49K

Using MIT’s living wage index, the website Zippia created a website showing what the living wage in every U.S. state is. According to the website, to support two adults and one child in the state of Michigan it costs $49,000. This put Michigan in the third quintile. Illinois and Wisconsin both had higher living wage costs, $51,000 and $52,000 respectively, while Indiana and Ohio had lower living wage costs, $47,000 and $46,000, respectively.

To read the article and view the map click here.

Southeastern Michigan’s average income above nation’s; Detroit’s income continues to lag

Southeastern Michigan has a median household income of about $57,000, $4,000 above the national average (about $53,000), but there are multiple communities in the region with median household incomes far below the local average. Communities within the region with the lowest median household incomes included Highland Park, Detroit and Hamtramck.

Metro-Detroit median household income

SEMichigan Median Household income 2014

In 2014 Highland Park had the lowest household median income in the region at $19,391; this is a decrease from a median household income of $21,469 in 2009. This neighbor to the City of Detroit also had 49 percent of residents living below the Federal Poverty Level ($23,850 for a family of four) in 2014. Similar to the decreased median household income for Highland Park in recent years, there has been an increase percentage of residents living below the Federal Poverty Level.

In 2014 Hamtramck had roughly the same percentage of residents as Highland Park living below the Federal Poverty Level at 49 percent, this too being an increase from 2009. It also had one of the lowest median household incomes in the region in 2014 at $25,183. The city’s 2014 median household income is about a $5,000 decrease from $30,346 in 2009. Detroit, which will be discussed further later, had a household median income above both of these cities in 2014 at $26,095. However, this median household income is still far below the average for the region, state and nation.

In 2014 the median household income for Lake Angelus was $167,083. Between Highland Park, which had the lowest median household income in the region in 2014, and Lake Angelus, which had the highest median household income, there was more than a $130,000 difference; according to our previous post, in 2009 Lake Angelus’ median household income was about $131,000. Bloomfield Township, also located in Oakland County, was another suburban community that experienced an increase in its median household income between 2009 and 2014. In 2014 Bloomfield Township’s median household income was $108,235, in 2009 it was $104,988. Other communities in the region that had a median household income above $120,000 in 2014 were Novi Township ($125,000), Bloomfield Hills ($163,462) and Orchard Lake Village ($152,625).

Despite such high median household incomes it wasn’t Oakland County with the highest median household income of the seven counties in the region, rather it was Livingston County. In 2014, Livingston County had a median household income of $73,994; Oakland County’s median household income was $66,436. Conversely, Wayne County had the lowest median household income $41,421.

Although Livingston County did not have any communities with a median household income above $120,000, 10 of 18 communities (data was not available for Fenton) had median household incomes above $70,000. Brighton Township had the highest median household income in Livingston County at $94,611 and the Howell had the lowest at $43,482. In Oakland County median household incomes ranged, by community, from $27,632 (Pontiac) to $167,083.

Detroit Median Income

Detroit’s median household income in 2014 was $26,905, a decrease from $33,754 in 2009. With incomes decreasing, the percentage of individuals living below the poverty line increased from 33.2 percent in 2009 to 39.4 percent in 2014 in Detroit.

Despite there being a median income of $26,905 in Detroit there are neighborhoods in the city where the median household income ranges up to about $103,000. The neighborhoods with the highest median household incomes in Detroit are Palmer Park, Rosedale Park and Indian Village. On the opposite end of the spectrum, there are several Census Tracts where the median household income in 2014 ranged between $8,733 and $15,000. The majority of these Census Tracts were located in the eastern part of the city, around lower/middle Woodward and Rosa Parks. There were also a few near Brightmoor and Chandler Park.

Overall, we see that while regionally Southeastern Michigan had a median household income above the state and national average in 2014 there are several impoverished communities in the region where the median income not only continues to decline, but the poverty rate continues to rise. Although there are pockets of wealth and poverty both located within the region, the majority of the region has a median household income between $30,000 and $90,000.

Poverty in Metro-Detroit spreading through the suburbs

Between 2009 and 2014, poverty levels in the region’s urban communities, such as Detroit, Pontiac and Highland Park, increased, just as they did for some of their suburban neighbors. One might assume that the city of Detroit had the region’s highest percentage of residents living below the poverty level in 2014 due to the amount of press coverage it receives regarding poverty, crime, and various economic indicators. However, the city of Hamtramck, an immediate neighbor to Detroit, actually had the highest percentage of residents living below the federal poverty level in 2014.

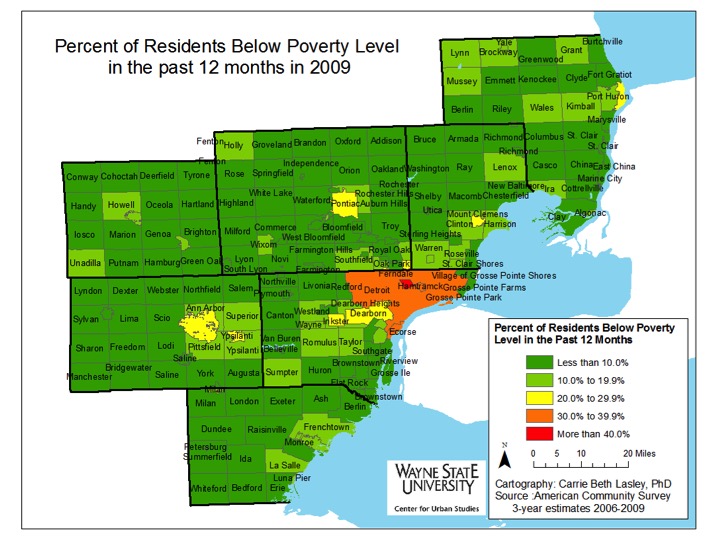
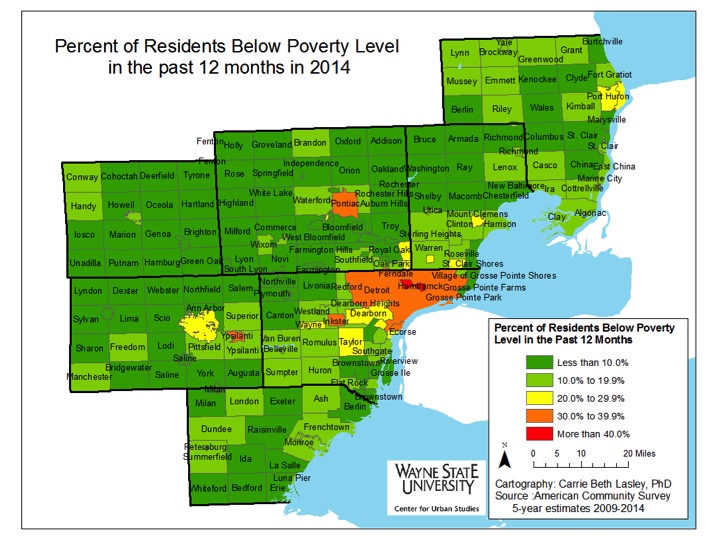
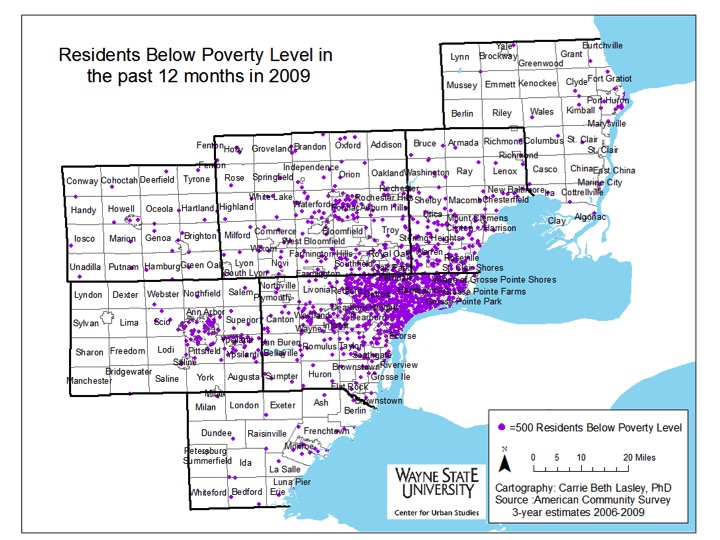
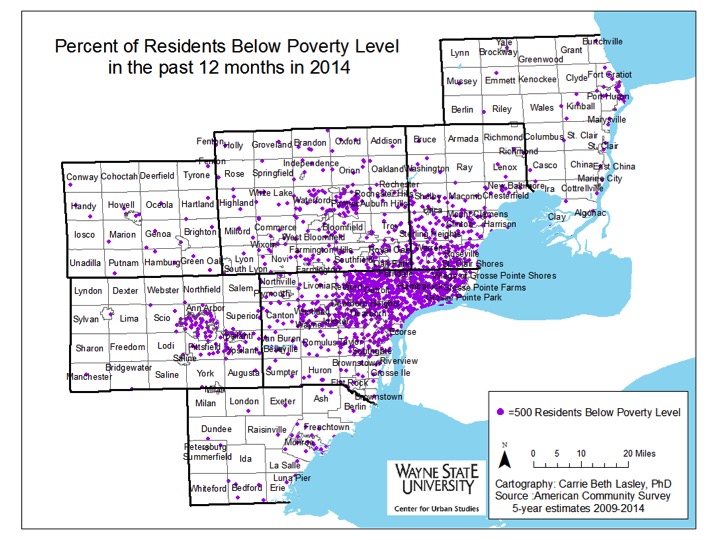
This post will examine the percent of residents throughout the region below the poverty level in 2009 and 2014. Both the change in percent and concentration will be shown with various maps. For reference, according to the U.S. government, the Federal Poverty Level (FPL) in 2014 for a family of four was $23,850; in 2009 the FPL was $22,050 for a family of four.

DetroitPoverty2009


DetroitPoverty2014

In 2014, the cities with 30 percent or more of residents living below the poverty line were:

  • Ypsilanti: 30.6%
  • Inkster: 37 %
  • Pontiac: 37.8%
  • Detroit: 39.4%
  • Highland Park: 47.6%
  • Hamtramck: 48.5%


As mentioned above, in 2014, the city of Hamtramck had the highest percentage of individuals living below the poverty line at 48.5 percent; in 2009, that number was 38.4 percent. In the city of Detroit, the percentage of individuals living below the poverty line increased from 33.2 percent in 2009 to 39.4 percent in 2014.


Each county within the Southeastern Michigan region, with the exception of Livingston County, experienced an increase in the number of communities with a higher percentage of residents living below the poverty line between 2009 and 2014. For example, in 2009, a majority of St. Clair County had less than 10 percent of its residents living below the poverty level, but by 2014 that shifted to between 10-19 percent of residents. There were some communities within that county, though, such as Fort Gratiot and Port Huron Township, which experienced a decrease in the percentage of people living below the poverty level. The higher poverty levels in St. Clair County shifted to the more rural area (the northern part of the county) and to the waterfront communities. Overall, the percentage of individuals living below the poverty line in St. Clair County in 2014 was 15.2 percent.


Another visible increase in the percentage of residents living below the poverty level was in the southern portion of Macomb County. Here, cities such as Eastpointe, Sterling Heights, Center Line and Utica all went from having less than 10 percent of their populations living below the poverty level to between 10 to 19 percent of the populations living below the poverty level. For Eastpointe, just under 10 percent of the population lived below the poverty level in 2009 and in 2014 that percentage increased to 23.5 percent. In Sterling Heights, 7.9 percent of the population lived below the poverty level in 2009, and in 2014 that number increased to 13 percent. Macomb County’s overall poverty rate was 12.2 percent in 2014.

The increase in the percentage of individuals living below the poverty line took place in Wayne County as well, with Redford, Flat Rock, Inkster, Wayne, and the southwest portion of the county all experiencing visible changes. Overall, Wayne County had a poverty rate of 24 percent in 2014.

While several communities throughout the region did experience an increase in the percentage of residents living below the poverty line there were, as noted above, some that experienced a decrease. For example, in 2009, 10.5 percent of the population in Howell Township in Livingston County lived below the poverty line and in 2014 that number was 4.6 percent.

Among the counties in Southeastern Michigan, Livingston County had the lowest percentage of individuals living below the poverty level in 2014 at 5.4 percent. The percentage of individuals living below the poverty level in Oakland County in 2014 was 9.9 percent and in Monroe County it was 11.8 percent.

SEMichiganPoverty2009

SEMichiganPoverty2014

Poverty, while being largely concentrated in the city of Detroit, has shifted outward toward the suburbs between 2009 and 2014, as illustrated above. In Wayne County, areas of Detroit, such as downtown, have experienced decreases in the percentage of individuals living below the poverty line while places such as Westland, Romulus and the western portion of the county have experienced an increase. To the north of Detroit, communities in southern Macomb County, such as Eastpointe, and in southeastern Oakland County, such as Hazel Park and Oak Park, have also experienced an increased percentage in the number of residents living below the poverty line.


Ann Arbor, while not experiencing a shift the magnitude of Detroit’s, has also seen its populations living below the poverty levels shift to nearby areas like Pittsfield and Scio. Additionally, in Ann Arbor, poverty concentration has decreased in the northeastern portion of the city and dispersed throughout the entire city.


While the region has experienced a slight shift and a clear growth in concentrated poverty, this isn’t an uncommon trend for other metropolitan areas throughout the Midwest region. According to “Architecture of Segregation: Civil Unrest, the Concentration of Poverty, and Public Policy,” a new study by the Century Foundation, concentrated poverty has spread from within the boundaries of metropolitan cities and into the inner ring suburbs. This has been attributed, in part, to the gentrification and increased taxes of urban communities, which has resulted in the movement of residents who are living below the poverty level to inner ring suburbs with aging infrastructure.

DetroitPovertyChange

DetroitPoverty2009

DetroitPoverty2014


DetroitPovertyConcentration2010

PovertyDetroitDD2014


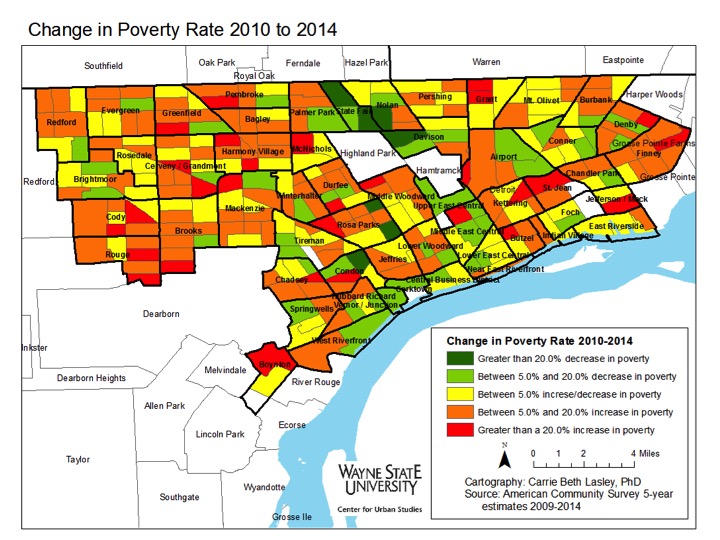
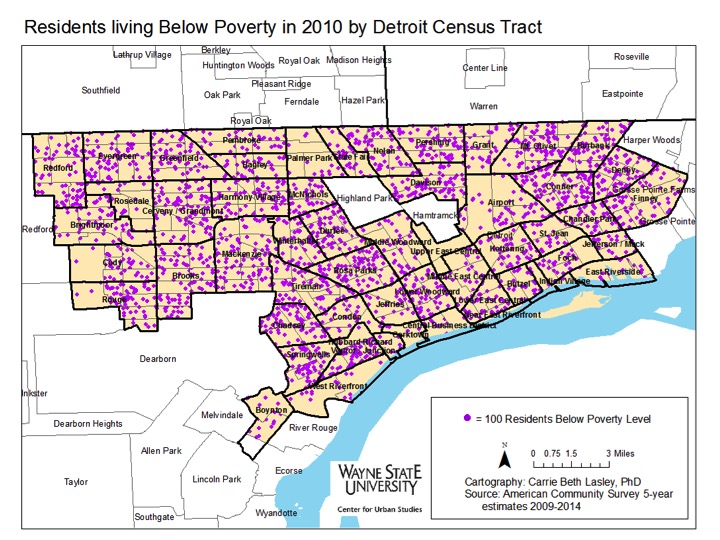
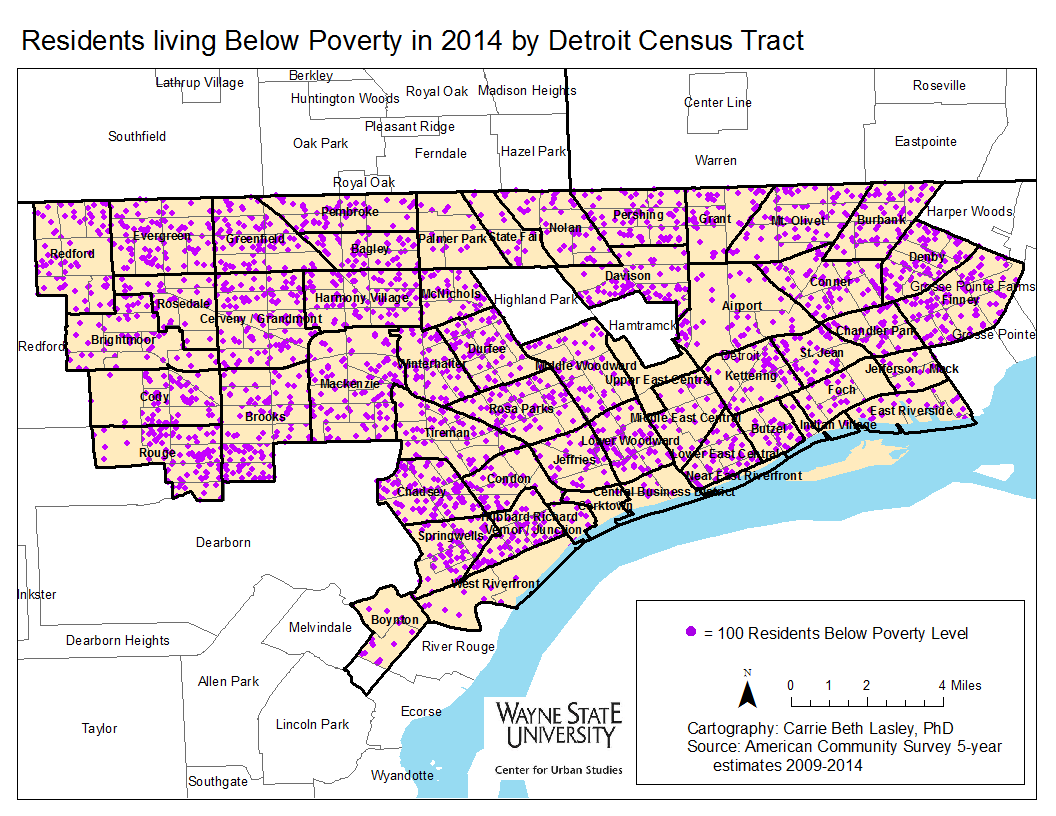
Between 2010 and 2014, pockets of Detroit neighborhoods experienced a decline in the percentage of individuals living below the poverty line while others experienced increases upwards of 20 percent. Concentrations of poverty in Detroit increased in areas such as Cody/Rouge, the neighborhoods bordering Grosse Pointe Farms, along the borders of Hamtramck, and the Southwest neighborhoods of the city.

Only about a dozen census tracts had less than 20 percent of individuals living below the poverty line in 2010. A majority of these census tracts were located on the city’s west side, west of Palmer Park and near Rosedale Park, along with about four bordering the Grosse Pointes on the east side. By 2014, a majority of those census tracts experienced at least a 5 percent increase in the percentage of residents living below the poverty level.


The neighborhoods along Woodward Avenue north of Highland Park, such as Palmer Park and Green Acres, experienced some of the largest decreases in the percentage of individuals living below the poverty level in the city of Detroit between 2010 and 2014. The Midtown, East Riverside, and Corktown areas also experienced decreases in the percentage of residents living below the poverty level.


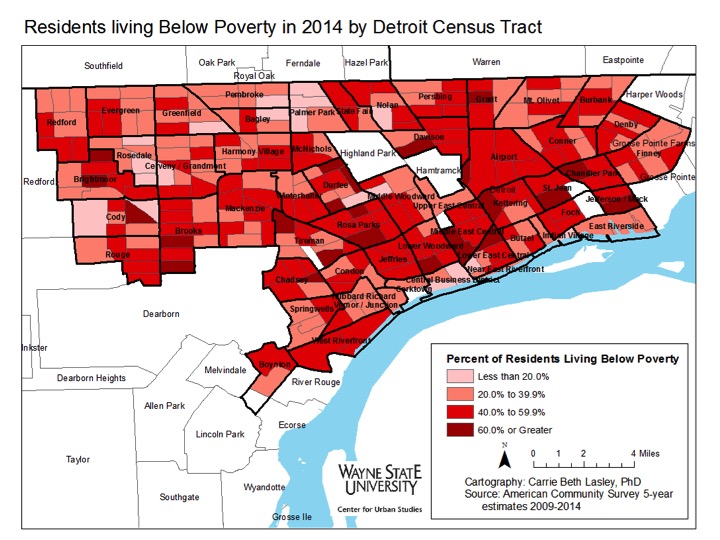
In spite of the positive trends in these neighborhoods, however, high poverty census tracts have dramatically increased in the city of Detroit since 2000, according to the Century Foundation study cited earlier. By 2014, the majority of the census tracts in the city of Detroit had between 40 and 59.9 percent of residents living below the poverty level. As such, even with the improvements made, poverty concentration continues to be a challenge in the city of Detroit.

It is policies, both new and recent, that have helped contribute to the increase in concentrated poverty. From the investment into new infrastructure, rather than fixing what already stands, to urban sprawl and the disproportionate building of homes for the middle class and wealthy to the income increases being felt by the rich, but maintaining stagnant for the poor, there are policies in place that allow the growth of poverty and concentrated poverty to occur.


Veterans in SE Michigan tend to fare better with income and employment

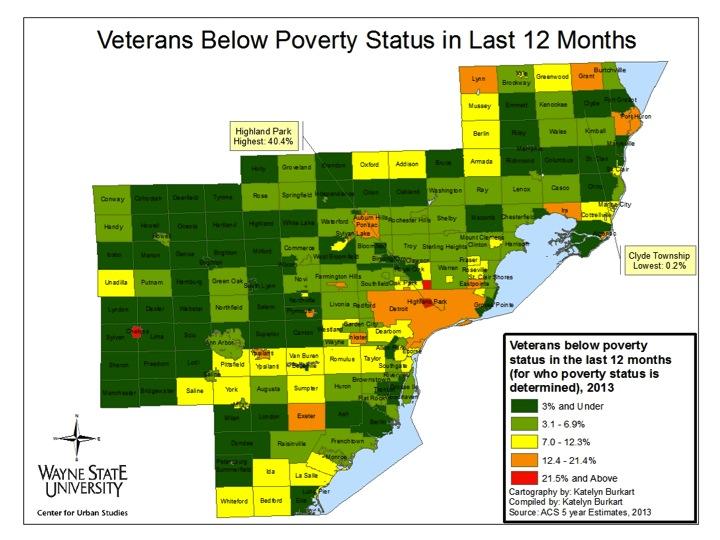
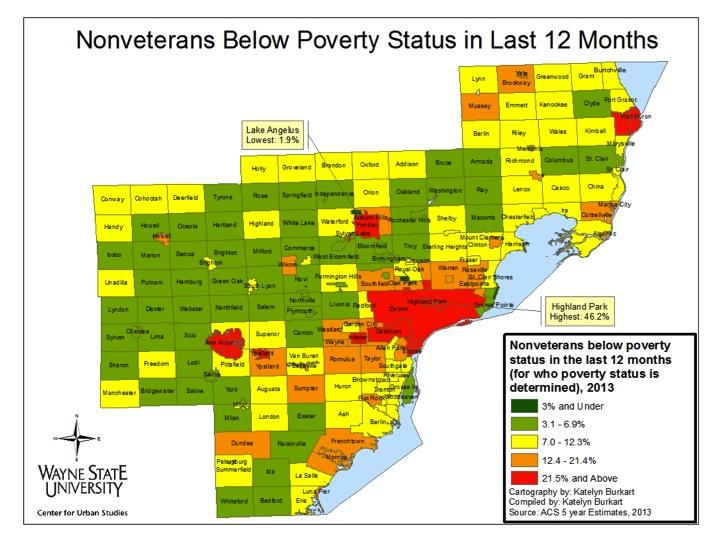
Last week we examined where veterans live throughout the seven-county region of Southeastern Michigan and this week we take a deeper look into the socioeconomic picture for the region’s veterans. Overall, we see that veterans in the region in 2013 tended to have a higher median income level than non-veterans. Also we see that a lower percentage of veterans in the area fell under the poverty line in 2013 than non-veterans. Unemployment status for veterans throughout the region, however, varied.

This data presented in the maps below is from the 2013 American Community Survey.

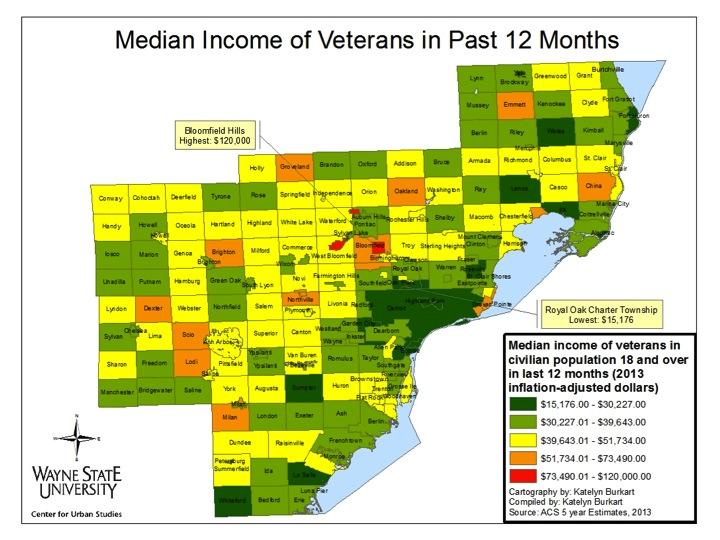
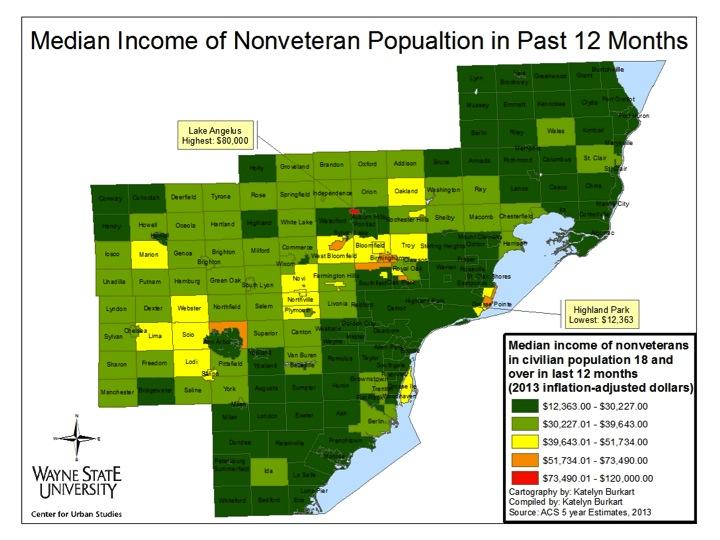
When looking at median income in Southeastern Michigan at the municipal level, we see that it tended to be higher for veterans than it was for non-veterans. Municipalities such as Bloomfield Hills, Orchard Lake, and Lake Angelus – all of which have higher median income levels than the region as a whole (link to post) – also had higher veteran median income levels than a city such as Highland Park, for example, which has low median income levels.

It should be noted, however, that veterans make up a smaller portion of the population than non-veterans, and as a result, sample size may have had an influence on these numbers.

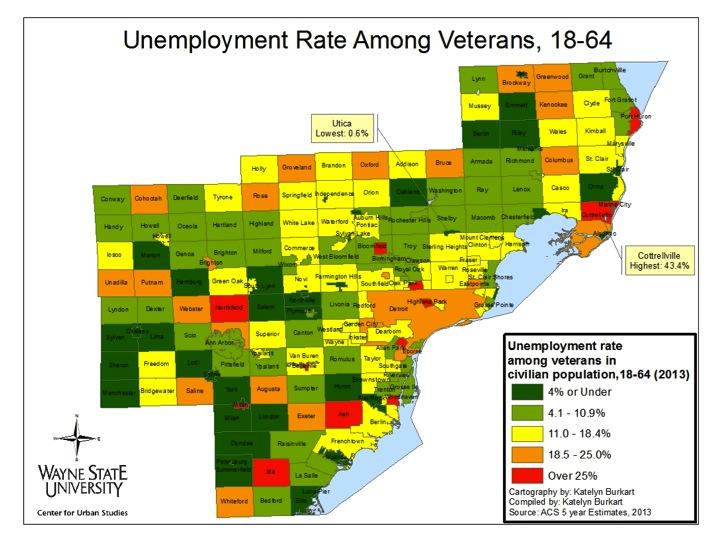
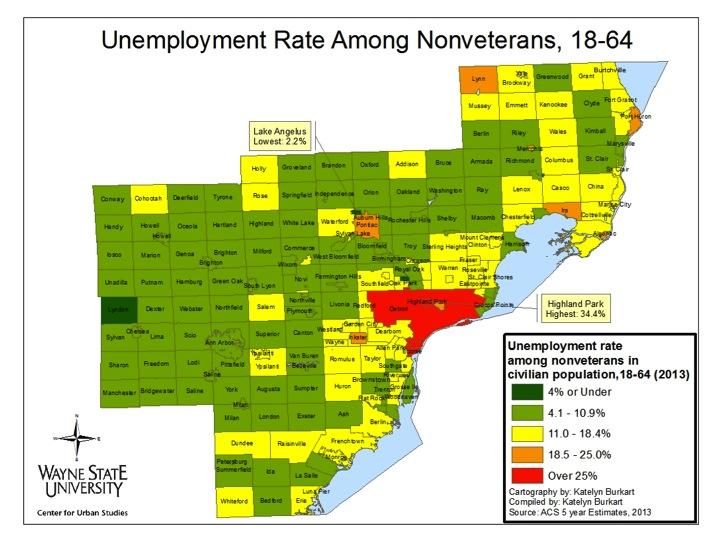
The unemployment rate among veterans varied much more than it does among non-veterans. The rate among veterans varied from 0.6 percent to 43.4 percent For non-veterans, it ranges from 2.2 percent to in 34.4 percent The locations with high unemployment also varied significantly between veterans and non-veterans, with 12 locations across five counties having over 25 percent unemployment among veterans – rates that were only seen in Detroit and Highland Park among non-veterans.

A lower percentage of veterans were below poverty status, compared to non-veterans throughout Southeastern Michigan. For both veterans and non-veterans, Highland Park had the highest percentage of residents below the poverty line: 46.2 percent of non-veterans and 25.2 percent of veterans. Only two other municipalities had more than 21.5 percent of veterans living below the poverty line: Chelsea (37.9%) and Hazel Park (27.7%). Clyde Township (0.2%) had the lowest percentage of veterans living below the poverty line.

While there were only three municipalities with 21.5 percent or more of veterans living below the poverty line, there were nine municipalities throughout the region where 21.5 percent or more of the non-veteran population was living below the poverty line. Such municipalities included Ecorse, Detroit, Pontiac, Ypsilanti and Port Huron.

Overall we see that while veterans appeared to fare better than non-veterans in terms of income and poverty status, and in some cases employment.

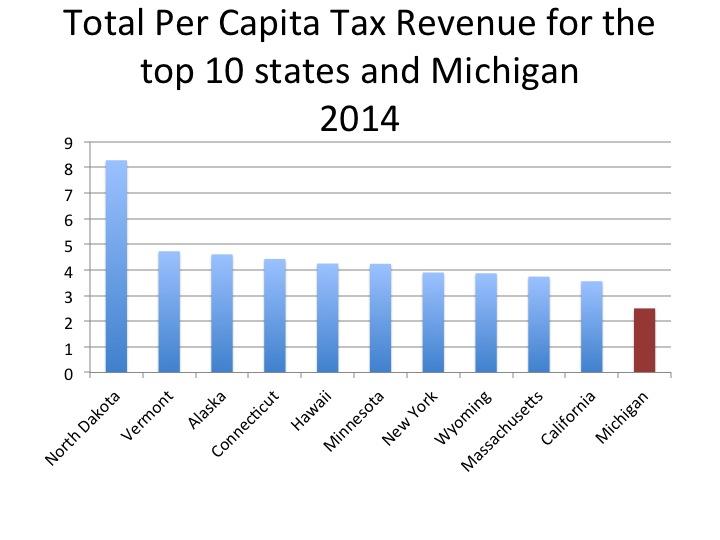
Michigan ranked 31 nationwide for amount of taxes per capita

The chart above compares the taxes per capita in Michigan, which is $2.50, to the 10 states with the highest taxes per capita. Michigan ranked 31 out of 50 and North Dakota came in at number 1 with its taxes per capita at $8.28.

Other states in the Great Lakes region with higher taxes per capita than Michigan were: Minnesota ($4.24), New York ($3.90), Illinois ($3.04), Wisconsin ($2.85) and Indiana ($2.55).

Nationwide, New Hampshire had the lowest taxes per capita in 2014 at $1.72.

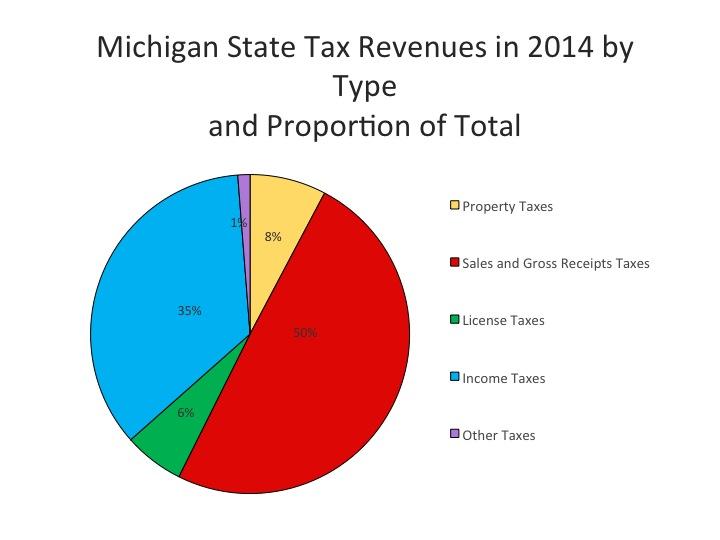
As seen in the graph below, the State of Michigan’s tax revenues come from four primary categories: Sales and Gross Receipt Taxes, Income Taxes, Property Taxes, and License Taxes. All other taxes, which include death and Gift Taxes, Documentary and Stock Transfer Taxes, and Severance Taxes, fall into the “Other” category. This category accounted for only 1 percent of the state’s tax revenue in 2014 while sales and gross receipt taxes accounted for 50 percent, or about $12 billion, of the state’s tax revenue.

The information for this post was taken from the 2014 Annual Survey of State Government Tax Collections.

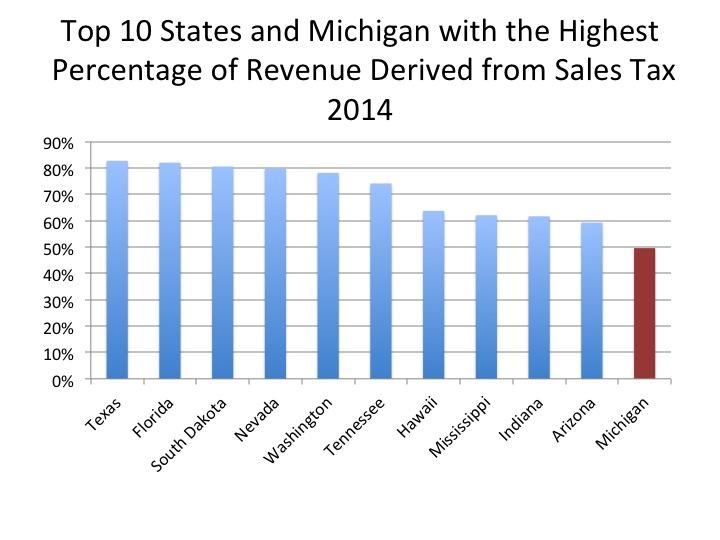
As noted, half of Michigan’s tax revenue generated in 2014 was from sales and gross receipt taxes, a category that is made up of more than just general sales and gross receipt taxes. General sales and gross receipt taxes accounted for 68 percent of the overall sales and gross receipts of $12 billion brought in 2014 while about 8 percent of those monies were earned through the motor fuel tax.

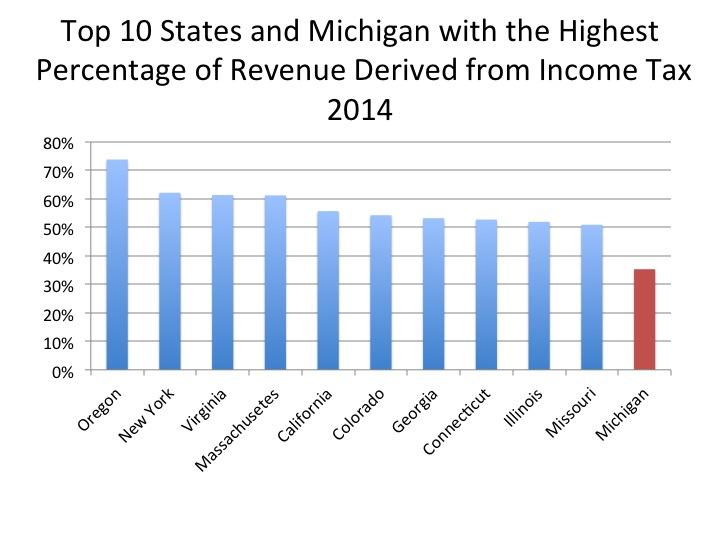
Michigan also relies on income tax monies to fund state operations; 35 percent of Michigan’s tax revenue generated in 2014 (about $8.7 billion) came from income taxes. Of that, 89 percent came from personal income taxes and the remainder was generated from corporation net income taxes.

Overall, according to the National Conference of State Legislatures, states earn about a third of their tax base through income taxes. Though this varies substantially as discussed below.

The majority of Oregon’s tax base (74%) was earned through its income tax in 2014, while Michigan only derived 35 percent of its tax base from income tax. Oregon’s income tax is divided into four brackets depending on a person/family’s earning. In addition, Oregonians are able to subtract what they pay in federal taxes from their state taxable income results, according to an article from The Oregonian.

Michigan has a flat income tax. In Michigan the income tax rate is 4.25 percent, however Republicans in the State Legislature have been working to reduce it to 3.9 percent, according to the Michigan League for Public Policy (MLPP). Such action, according to the MLPP, would reduce revenue flow to areas such as education and infrastructure. Michigan also has an Earned Income Tax Credit that allows lower income workers to retain more of their income. The State Legislature intends to eliminate this credit and instead push those funds into Michigan’s roads.

In addition to the Earned Income Tax Credit that exists in Michigan, and 23 other states (including Oregon), there is also a federal one, according to the National Center for Children in Poverty.

The importance of income taxes has grown since reliance on property tax values has declined in recent years, according to the National Conference of State Legislatures.

With Michigan’s sales and gross receipt taxes making up 50 percent of the state’s tax generated revenue in 2014, it ranked 19th for percent of sales tax making up a state’s tax base. Texas ranked first with 83 percent of its tax base being made up of sales taxes. Texas is one of the 17 states in the U.S. that does not levy property taxes at the state level, though it does have property taxes at the municipal and county level. Other states that do not levy property taxes (at the state level) and are among the 10 states with the highest percentage of revenue derived from sales taxes include: Florida (2), South Dakota (3), Tennessee (6) and Hawaii (7). Indiana was the only Midwestern state of the 10 states with the largest portion of their tax base being made up of sales taxes. In 2014, 62 percent of Indiana’s tax revenue was earned through sales taxes.

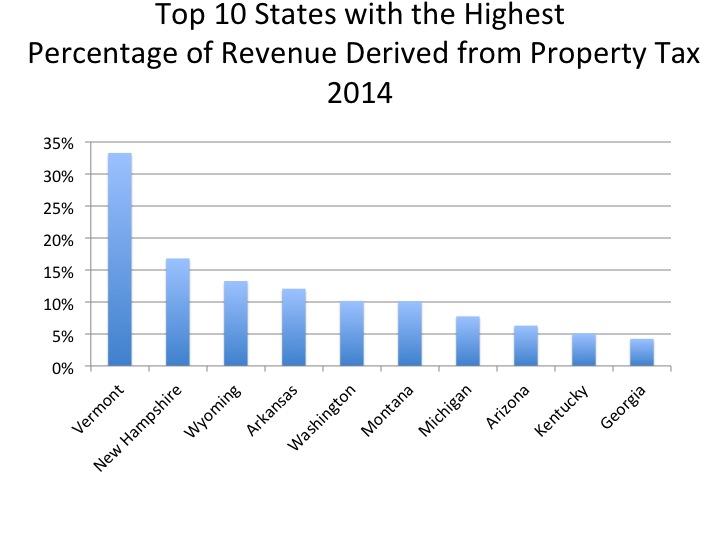
Out of the 33 states in the U.S. that levy property taxes, Michigan ranked seventh for the percent of tax revenues derived from property taxes. In total, about 8 percent of the state of Michigan’s tax revenues, or $1.8 billion, came from property taxes. Vermont ranked at the top, with 33 percent of its state tax revenues comprised of property taxes.

Detroit, St. Clair County have highest confirmed rate of child abuse/neglect victims in the region

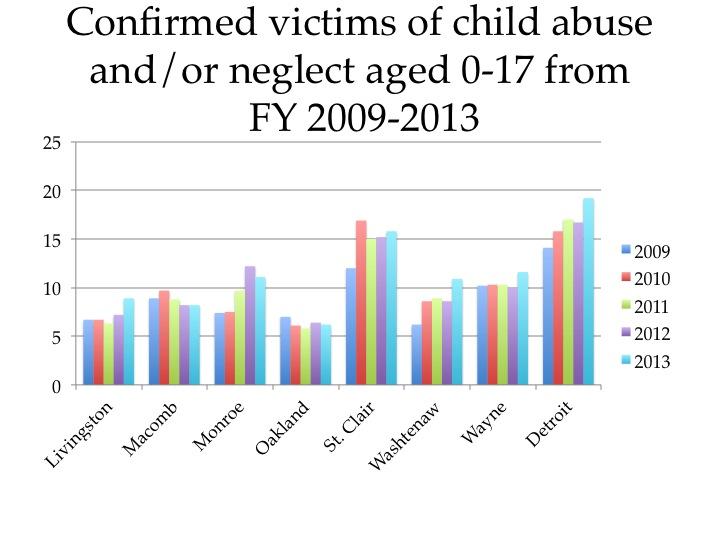
From 2009 to 2013, St. Clair County consistently had the highest rate of confirmed victims of child abuse and/or neglect in the seven county region, according to the Michigan League for Public Policy and Kids Count (these organizations obtained their data from the Michigan Department of Human Services). However, for four of those five years, Detroit’s rate of confirmed child abuse/neglect victims far exceeded that of St. Clair County.

All rates discussed in this post are per 1,000 children ages 0-17, unless otherwise noted. These numbers reflect an unduplicated count of children in a given fiscal year where the alleged abuse or neglect was confirmed after an investigation, according to the Michigan Department of Human Services.
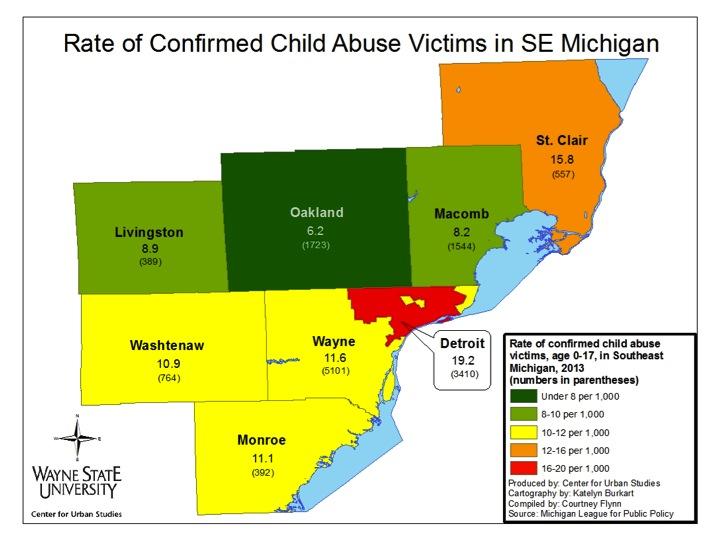
The map above shows the rate and number of confirmed victims of child abuse/neglect for the region in fiscal year 2013. Detroit, which is the only Michigan city with such information available through the data source, had a higher rate than the counties (19.2) in 2013. This rate of 19.2 confirmed victims of abuse and/or neglect per 1,000 children ages 0-17 was equivalent to 3,410 total cases.

As already noted, St. Clair County had the highest child abuse/neglect victim rate of the counties in the region in 2013 at 15.8; this was 557 confirmed victims.

In 2013, Oakland County had the lowest child abuse/neglect victim rate in the region. The rate was 6.2, which equaled 1,723 confirmed victims.

The rate of confirmed child abuse/neglect victims for the State of Michigan in 2013 was 14.9 per 1,000 children.

With the exception of 2010, from 2009 to 2013, Detroit had higher rates of confirmed child abuse/neglect victims than the counties in the region. In 2010, St. Clair County had the highest rate at 16.9 per 1,000 children; Detroit’s rate was 15.8 per 1,000 children at that time. Additionally, Detroit experienced its largest rate increase between 2012 and 2013; the rate increased from 16.7 to 19.2 per 1,000 children. Between 2012 and 2013, Macomb, Oakland, and Monroe counties were the only ones that did not experience a rate increase. Between 2012 and 2013, Macomb County’s rate remained the same at 8.2, while Monroe County’s rate decreased from 12.2 to 11.1 and Oakland County’s rate decreased from 6.4 to 6.2.

Macomb and Oakland counties were the only counties in the region that experienced rate decreases between 2009 and 2013.

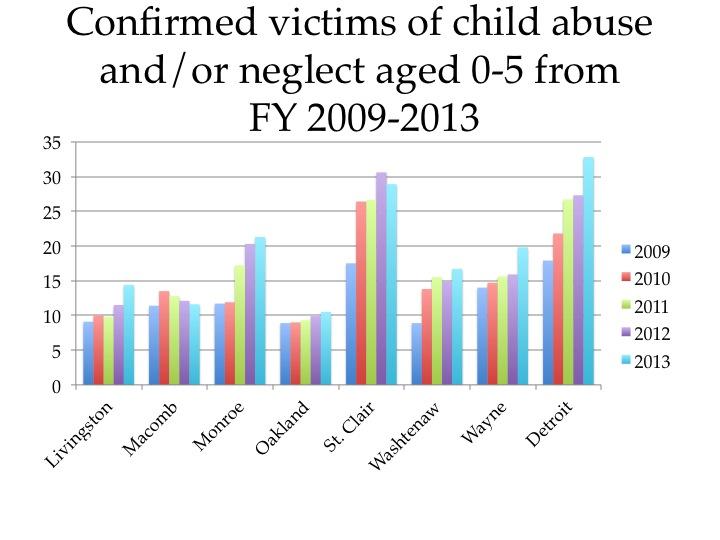
In the above chart, we look at the rate of confirmed child abuse/neglect victims for children between the ages of 0-5 in the region. Again, we see that Detroit and St. Clair County had the highest rates. In 2013, Detroit’s rate was 32.8, while St. Clair County’s was 28.9 per 1,000 children. In 2009, 2010, and 2012, St. Clair’s rates (17.5, 26.4, 30.6, respectively) were higher than Detroit’s (17, 21.8, 27.3, respectively).

For all the years examined, Oakland County had the lowest confirmed child abuse/neglect rates in the region for children ages 0-5. In 2009, its rate was 8.9 and by 2013, its rate had increased to 10.5. Overall, there was a general trend of rate increases across the region. Detroit had the largest rate increase between 2009 and 2013; its rate increased by 15.8 in that five-year time frame.

Although Macomb County’s rate increased by 2.1 between 2009 and 2010, it is the only county in the region that experienced a consistent downward trend in the confirmed child abuse/neglect victim rate between 2010 and 2013, leaving it only .2 points higher than its 2009 rate. Of the counties examined, this was the closest any county in 2013 was to its rate in 2009.per 1,000 children in 2010. But since 2010 the rate has decreased each year.

Detroit among several communities where more than 50 percent of children live below the poverty line

The message from the maps below is clear: the percentage of children living below the poverty line in 2013 in the city of Detroit was far greater than the majority of the other communities in the seven county region. At 55.1 percent, Detroit’s poverty rate was double that of the national rate (19.9 percent) and double or more of the rates of each county within the region.

The Census Bureau, which produced this data for the American Community Survey, uses a set of money income thresholds, as set by the Office of Management and Budget, which vary by family size and composition to determine what the poverty line is. The poverty line does not vary by geographic location but is respondent to inflation. Generally speaking, according to the U.S. Census Bureau, the annual poverty rate is “calculated using the sum of family income over the year divided by the sum of poverty thresholds that can change from month to month if one’s family composition changes.”

According to the Office of Management and Budget, the weighted poverty level in 2013 for a family of four was $23,834.

With Detroit having 55.1 percent of its children living below the poverty level in 2013, we also see that at the county level, Wayne County had the highest child poverty rate at 22.5 percent. While cities like Livonia, Canton, Plymouth and Woodhaven all had child poverty rates below 10 percent, there were some communities in Wayne County where levels were above Detroit’s. For example, Highland Park had the highest percentage of children living below the poverty line at 68 percent. Hamtramck’s percentage was also above Detroit’s at 62.1 percent, as was Inkster’s at 56.3 percent. The percentage of children living below the poverty level in River Rouge was just below Detroit at 50.1 percent.

Pontiac, which is in Oakland County, was the only other community within the region where more than 50 percent of its children were living below the poverty line. In 2013 in Pontiac, 54.3 percent of the children lived below the poverty line.

On the opposite end of the spectrum in Wayne County, there were communities such as Grosse Pointe (1%), Grosse Pointe Farms (1.8%), Grosse Ile (4.7 %), and Plymouth (5%) where 5 percent or less of the child population lived below the poverty line. In Oakland County, there were 11 communities where 5 percent or less of the children lived below the poverty line. These communities were: South Lyon (.2 percent), Royal Oak (5%), Rochester (5%), Orchard Lake (.7%), Novi (0%), Lake Angelus (0%), Huntington Woods (.3%), Bloomfield Hills (0%), Birmingham (3.1%), Berkley (4.8 percent), Sylvan Lake (0%).

Overall, Livingston County had the lowest percentage of children living below the poverty line at 7.4 percent. This was the only county where less than 10 percent of the children in a county lived below the poverty line. Oakland, Macomb, Washtenaw and Monroe counties all had less than 20 percent of their child populations living below the poverty level.

Although Detroit did not have the highest percent of children living below the poverty line in the seven county region, its rate did soar above the national and county averages. As seen in the map above, the majority of the census tracts within the city had 50 percent or more of its children living below the poverty line. Pockets of this poverty appear to be concentrated more so in the east side of the city, in Southwest Detroit, and near the Warrendale neighborhood on the west side. There were only seven census tracts within the city where 10 percent or less of the children were living below this poverty line. These areas include the downtown area, Indian Village, Arden Park, East Village, Midtown and Rosedale Park.

Opting-Out limits manufacturing employment opportunities for the transit dependent

James Robertson, has been coined Detroit’s “walking man” because of his tenacity in earning a perfect attendance mark at his suburban factory job all while walking nearly 21 miles round trip from Detroit to Rochester Hills. Without a car, Robertson must hobble together a defunct set of bus routes, leaving him no choice but to walk most of the distance into the Detroit suburbs. This story is surely one of many in the Metro-Detroit are, begging the question: Why is the public transit system in the Detroit area far less than mediocre?

Drawing Detroit sets out to illustrate the issue and to discuss how allowing communities to opt out of transit service can limit employment opportunities and create a situation of economic injustice.

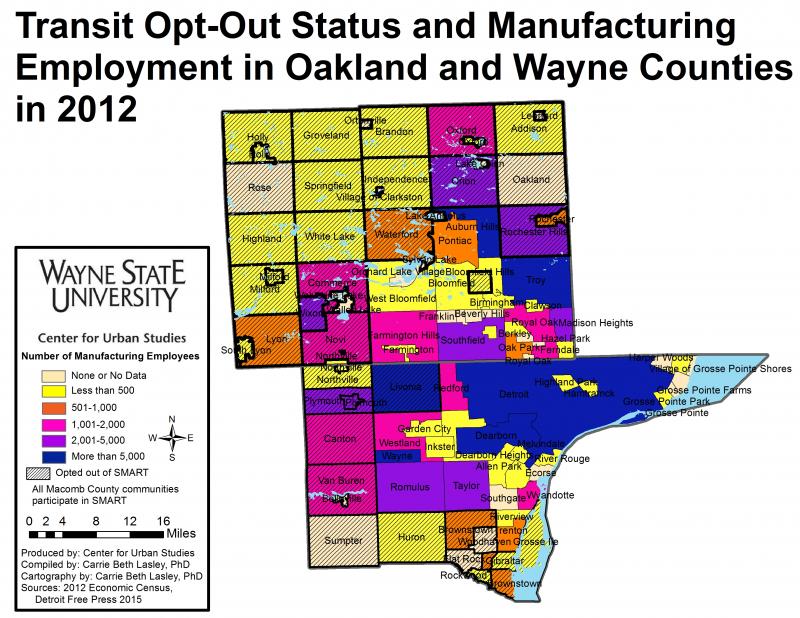
Below is a map showing the number of manufacturing employees reported to the 2012 Economic Census of the U.S. Census Bureau in 2012 along with the transit status of communities in Wayne and Oakland counties. Aside from the Detroit Department of Transportation, the only existing transit system that is close being considered somewhat regional is Suburban Mobility Authority for Regional Transit (SMART). SMART has bus lines that run throughout Wayne, Oakland and Macomb counties. In Wayne and Oakland counties municipalities have the option to either opt-in or opt-out supporting SMART, and therefor having it run through their community. In Oakland, the majority of communities-55 percent of 33 of 60- have opted out. In Macomb County, all municipalities support SMART; they do not have the option to opt-out. Because of this, they are irrelevant to the discussion.

Some critics of the Free-Press article on Robertson indicated that there has been little need for low-skill workers in Detroit and other poorer communities to travel into these opt-out communities for employment or otherwise, characterizing these suburbs as bedroom communities with limited job prospects for transit-dependent workers. A quick examination of the map below indicates this is a fallacy. Many manufacturing jobs have moved to the suburbs, following its workforce and also seeking out new facilities and campuses in unsettled areas. Opt-out communities including Oxford Township, Novi and Canton have in excess of 2,000 manufacturing jobs located in their boundaries; Livonia had 9,447 manufacturing jobs in 2012.

In total, 38,461 manufacturing jobs were located in opt-out communities in these two counties, representing 34.1 percent of all manufacturing jobs in the two-county area. Broken down by county, it is 29.6 percent (19,484 manufacturing jobs) of Wayne County’s manufacturing employment and 40.6 percent (18,977 manufacturing jobs) of Oakland’s manufacturing employment.

Median income provide different view of Southeastern Michigan

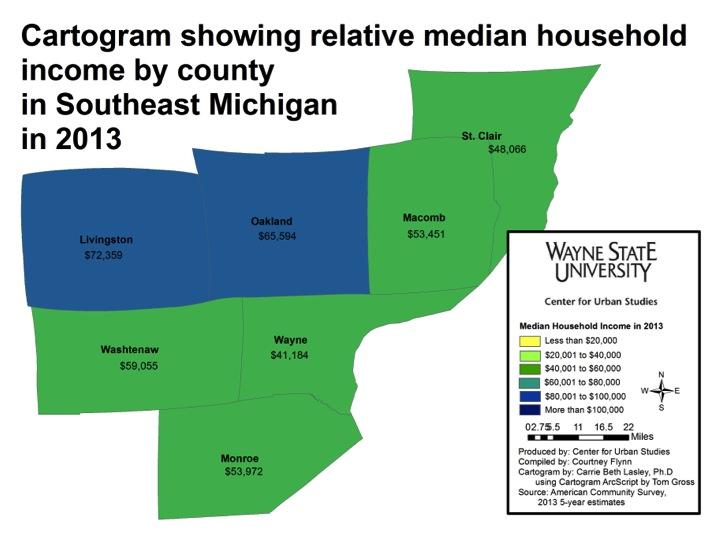
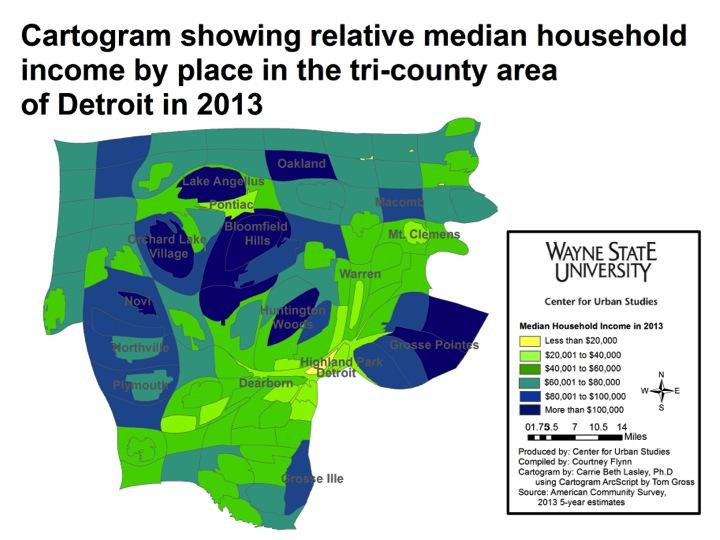
Various blog posts drawing attention to the income disparities that exist throughout Southeastern Michigan have appeared on Drawing Detroit. This particular post though is more visual in its depiction of income throughout the region at the county and municipal levels. In particular, this post presents the 2013 median household income for the seven counties in the region, along with the municipalities in the tri-county region, in a cartogram form.

A cartogram is a geographic representation method that alters the area and shape of locations, while still preserving their spatial relationships, in order to demonstrate the relative relationship of a data feature. This method allows the cartographer to change the way the map is experienced visually, by applying weight to data, while also maintaining geographic relationships.

Of the maps presented in this post, the above map is the least skewed in terms of income in relation to the size of the counties. Livingston County, which had the highest median household income in 2013 at $72,359, appears only slightly larger than its size on a normal scale. There is also a noticeable difference in the size of Wayne County, which had a median household income of $41,138 in 2013. This was the lowest median household income of all the seven counties.

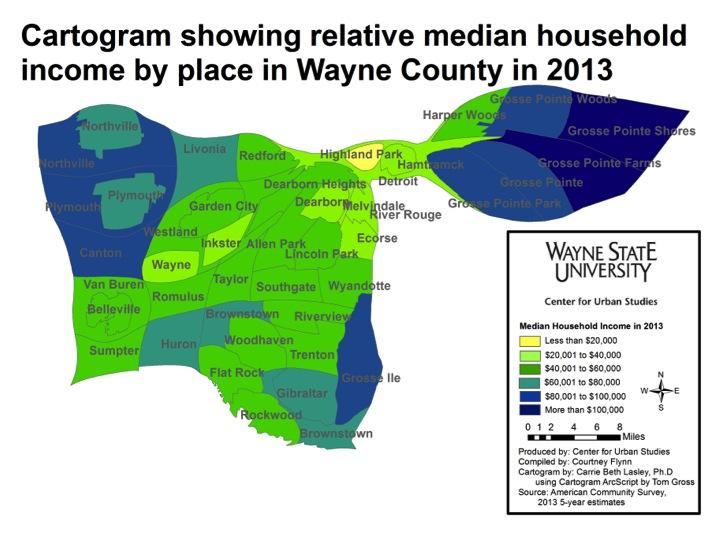
The above two maps truly highlight the income disparities in the tri-county region, particularly in Wayne County. In both maps, the Grosse Pointes stand out as having median household incomes above $80,001. Grosse Pointe Woods ($105,071) and Grosse Pointe Farms ($107,152) had the highest incomes in that area.

In looking at both maps we see that Detroit simply serves as a low-income small connector between wealthy municipalities like the Grosse Pointes and the Plymouth area. Because the size of a municipality in these maps is determined by relative median household income and not geographic size, Detroit, which is the largest city by population in the state of Michigan, does not draw the visual attention it typically would. It has been dramatically impacted by its low median household income of $26,325 in 2013.

Another notable municipality with a high median household income is Lake Angelus in Oakland County. Lake Angelus is only 1.6 square miles but in the above map we see that its median household income makes it larger (in the cartogram) than cities such as Pontiac, Detroit, Warren and Mount Clemens. Lake Angelus had a median household income of $163,393 in 2013.

Other municipalities whose size appears larger in these maps because of their median household income were: Bloomfield Hills ($147,969), Novi Township ($108,125), Plymouth Township ($86,217), Canton ($81,667), Northville Township ($97,161), Grosse Ile ($88,238), and Orchard Lake ($137,321).

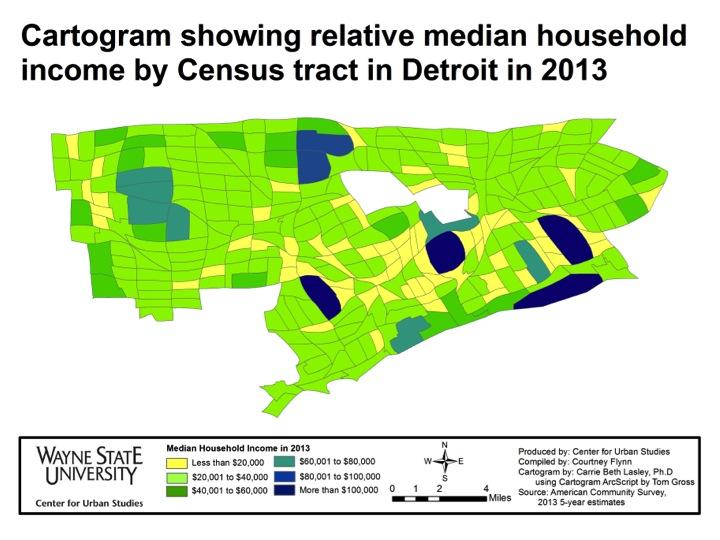
The above cartogram looks at median household income in Detroit by Census Tract in 2013. Areas making less than $20,000 greatly outnumber those making $80,000 or more. Riverview, Midtown, Rosedale Park and Indian Village swell greatly due to their high median income, while areas like Palmer Park and Grandmont-Rosedale also increase in size at the expense of areas like Brightmoor, Briggs, Core City and Poletown.

By viewing a municipality’s size in relation to the median household income we are able to gain a better understanding of where higher household incomes are located in Southeastern Michigan. These maps show that much of the wealth in the region is located in the northeastern and northwestern portions of Wayne County and throughout Oakland County.