According to recently released U.S. Census Bureau data, Michigan’s population has marginally increased for the second year in a row. Experts believe, according to a recent Detroit Free Press article, that part of the reason the state’s population has grown by about 2.3 million people is because the outflow of residents has decreased. To read more, click here.
Category Archives: Population
Most Detroit residents employed in health care, educational services, and social assistance industries
This post is an extension of last week’s (link here), in that we are showing which industries draw the most about of Detroit residents, ages 16 and older, for employment. Here we examine the types of jobs by percentage of the working population in the City of Detroit in 2011, according to the five-year American Community Survey. To learn more about the specific occupations included in the different industries described in this post please click here.
In reviewing the maps, a pattern similar to the region is reflected. The structure of the local economy is based around health care, educational services, social assistance, manufacturing, arts, entertainment, and food service industries.
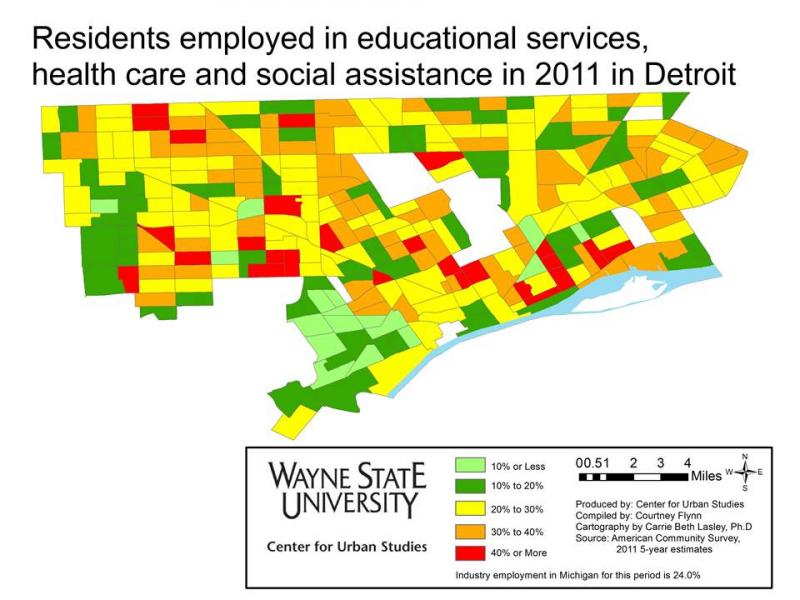
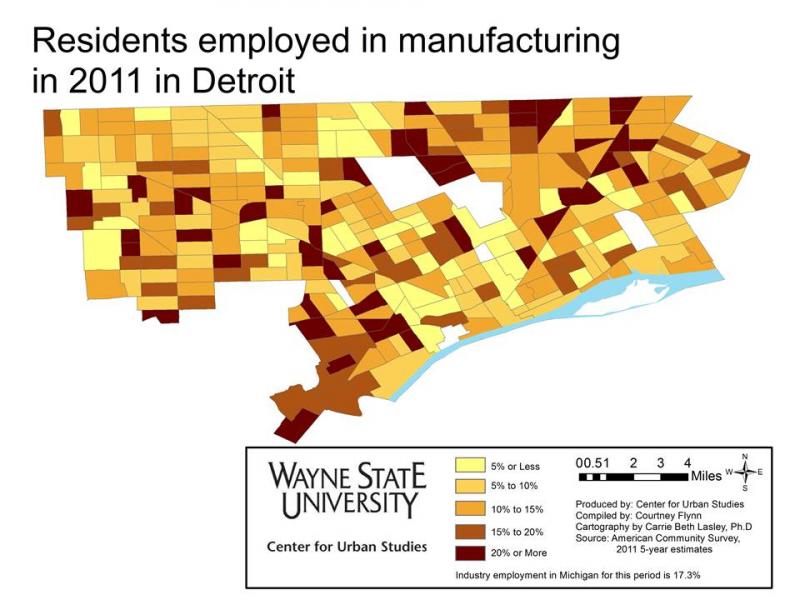
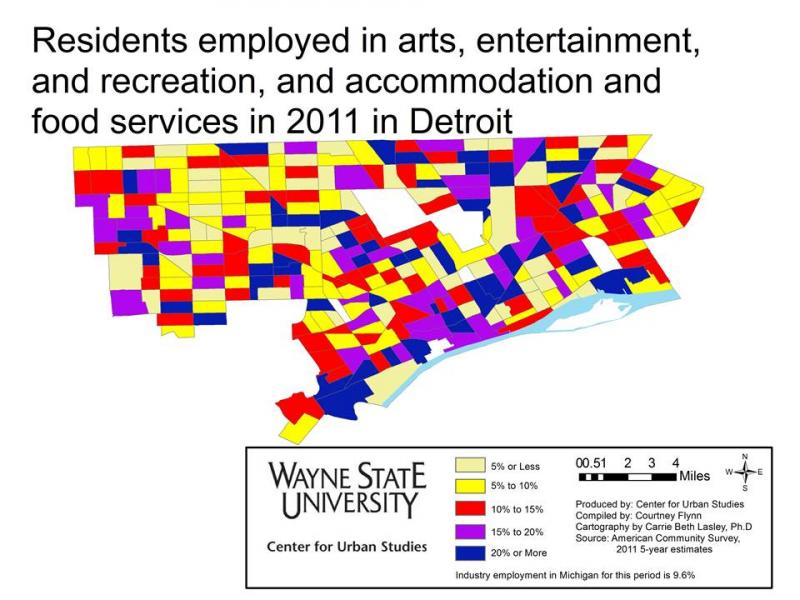
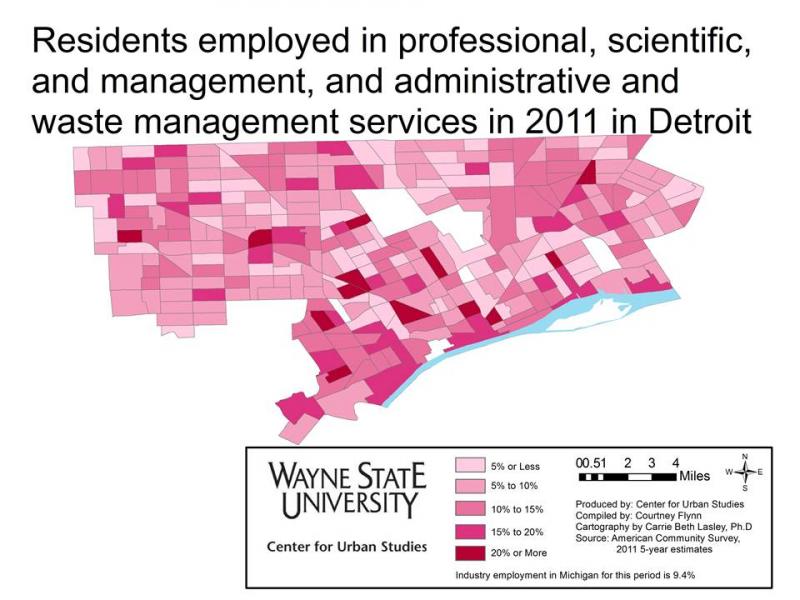
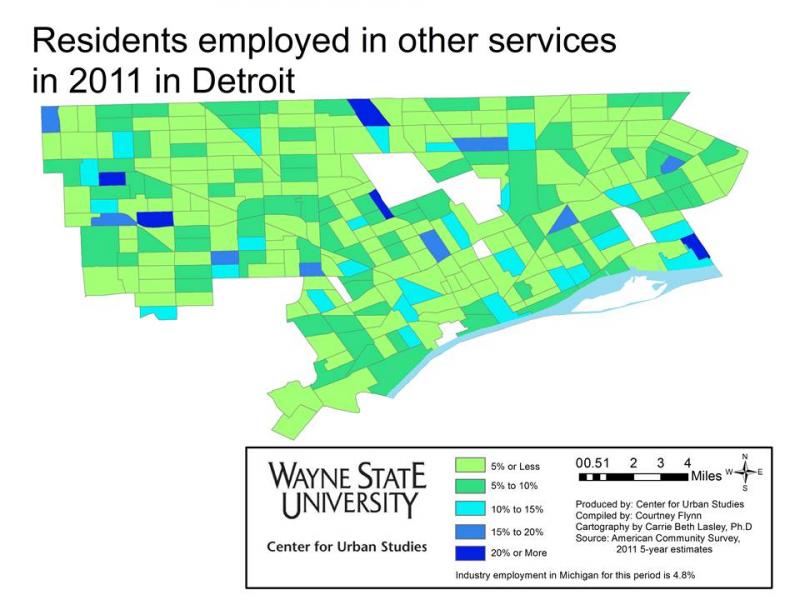
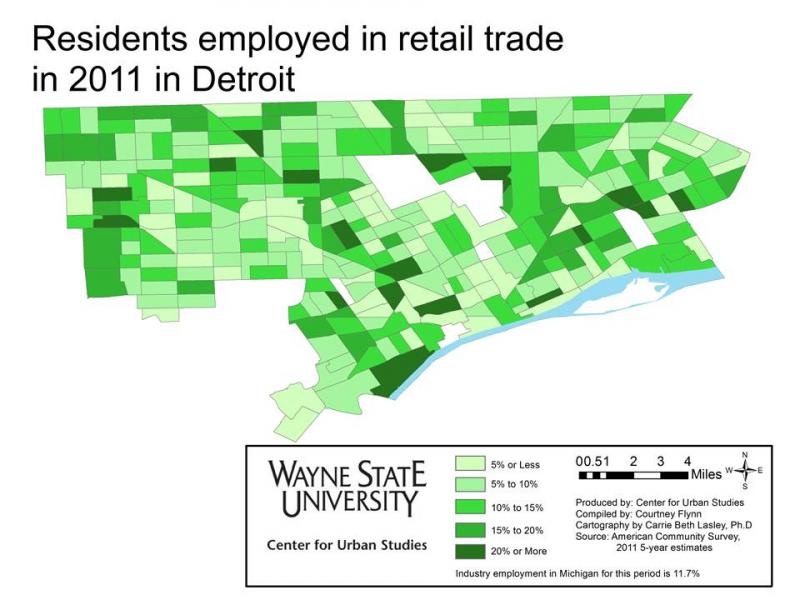
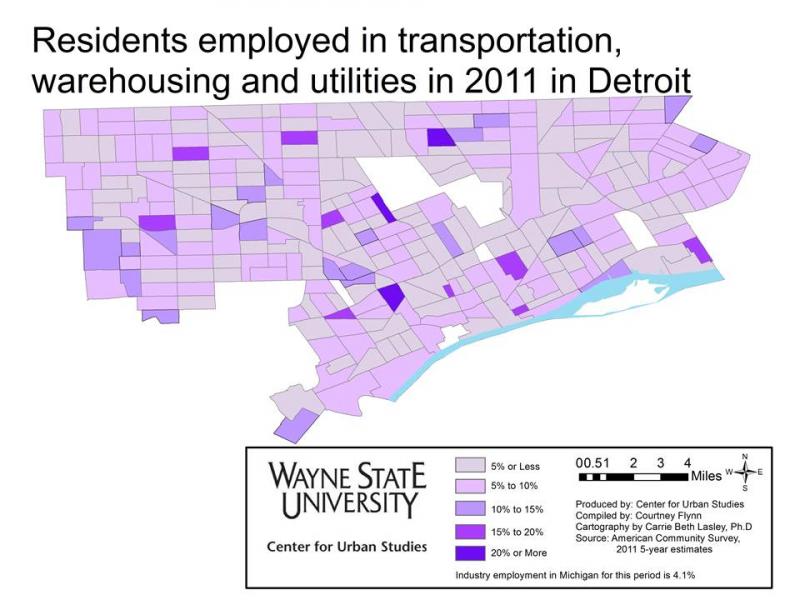
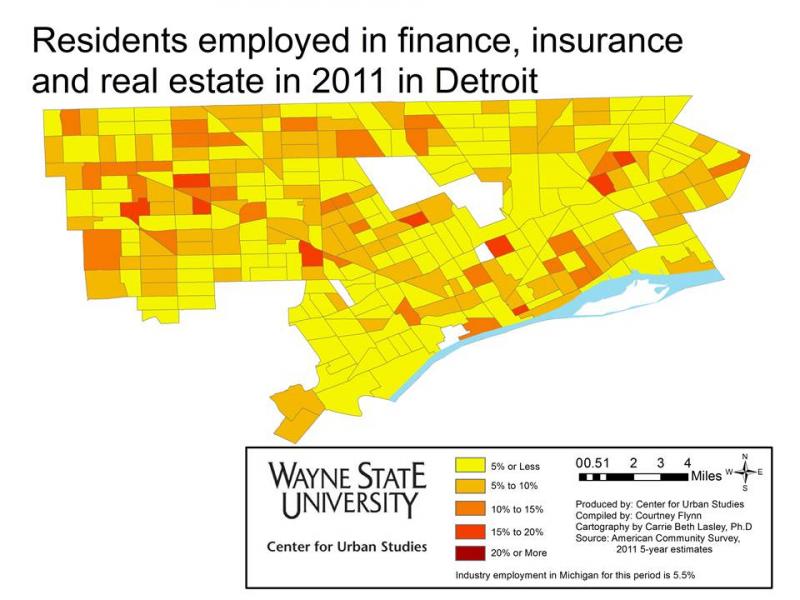
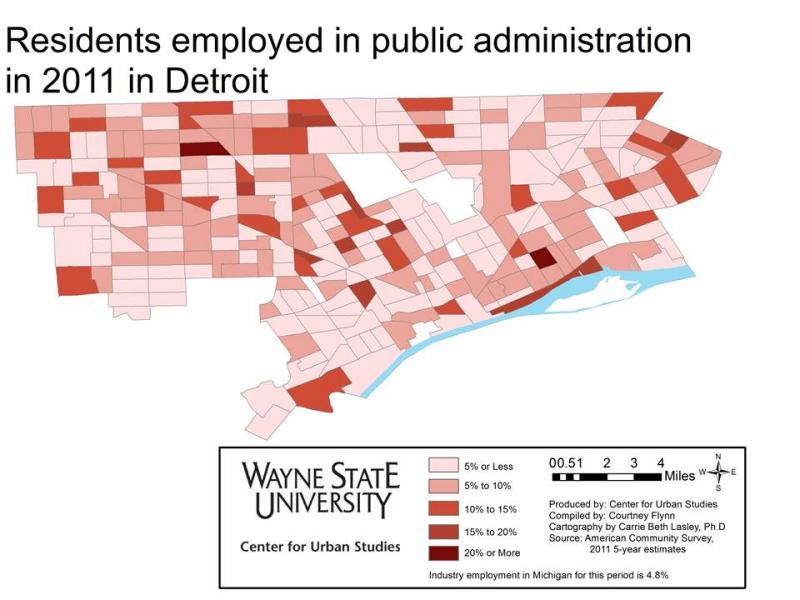
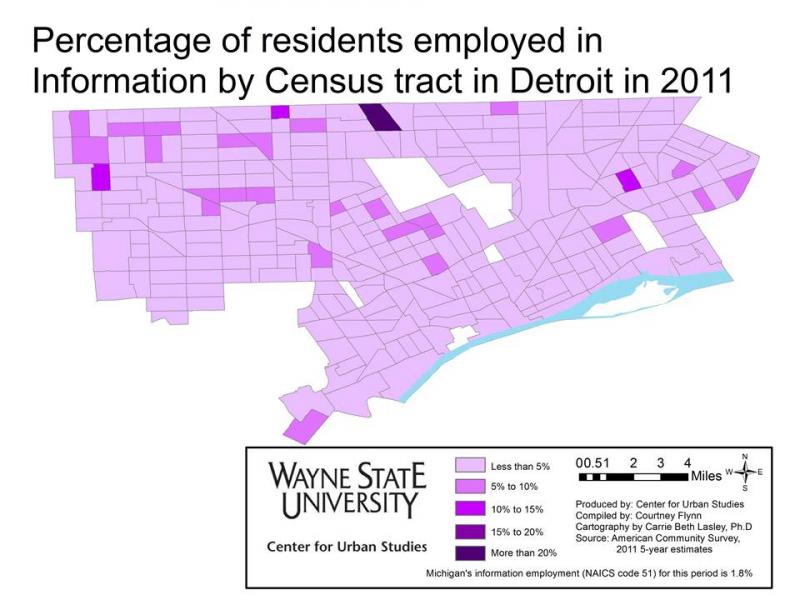
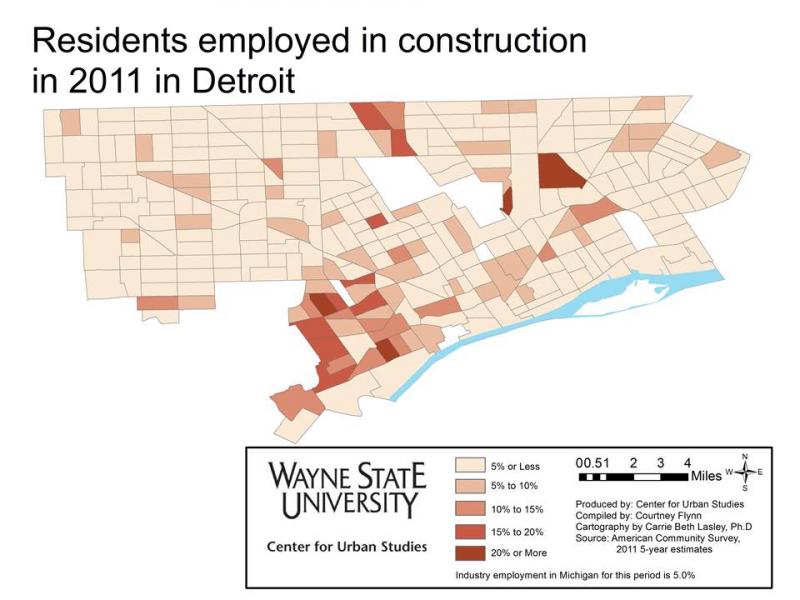
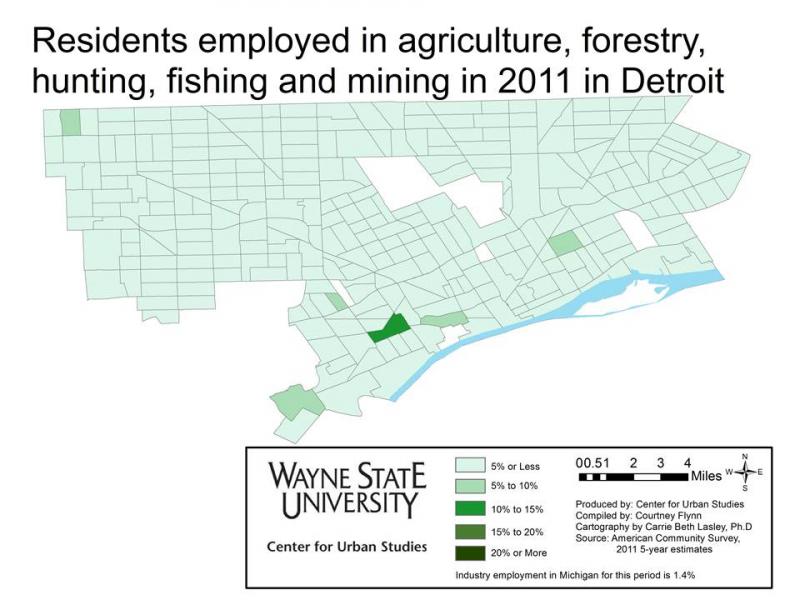
According to the map, in the health care, educational services, and social assistance industries there were about 20 Census tracts that had 41 percent or more of the population employed in these services. There were also about 75 Census tracts where between 30 and 40 percent of the population was employed in these industries in 2011.The other top industries in which Detroit residents were employed in for the year 2011 were the arts, entertainment and recreation, accommodation, and food service industries. There were about 40 Census tracts in the city were 20 percent or more of the residents were employed in these industries. Manufacturing also had a large employment draw in the city; there were about 35 Census tracts within Detroit where 20 percent or more of the 16 years and older population was employed in the manufacturing industry.
Agriculture was the industry with the least amount of Detroit residents employed in it. All but five of the Census tracts had 5 percent or less of the population employed in the industry. The information and construction industries also had low draws. There was a pocket in southwest Detroit though where there was about 15 Census tracts in 2011 with 15 percent or more of the population employed in construction.
Health services, manufacturing dominate area
Manufacturing, health, social services and education were the predominant industry occupations in Southeastern Michigan and the tri-county area in 2011, according to the five-year American Community Survey. The agriculture, forestry, hunting and fishing industries had the smallest proportion of people employed in the area for same time period.
In this post, we examine the types of jobs by percentage of the working population in Southeastern Michigan and the tri-county area and the City of Detroit as a whole. To learn more about the specific occupations included in the different industries described in this post please click here.
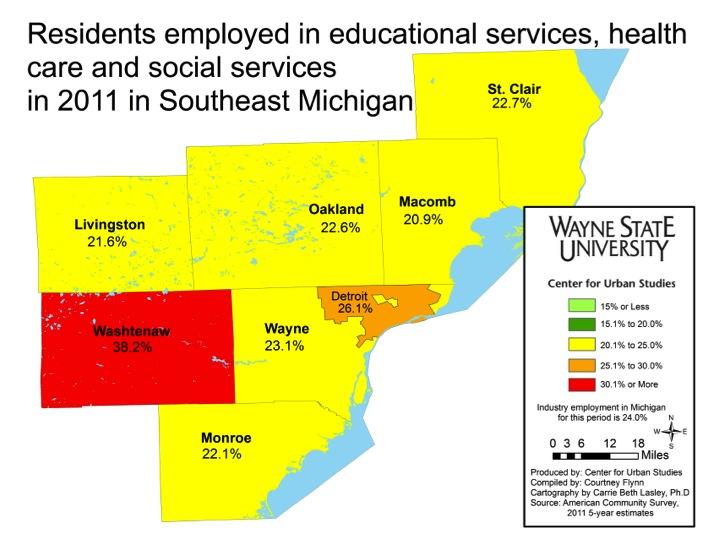
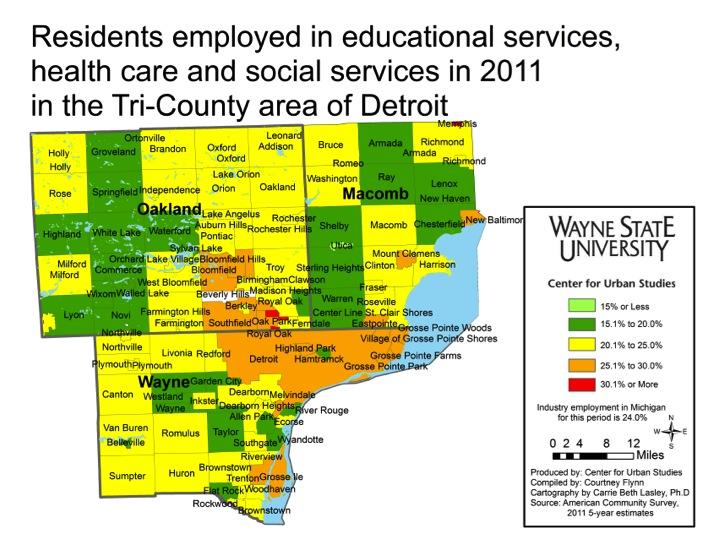
Washtenaw County had the largest percentage of residents employed in educational services, health care and/or social services. Of the employable population over the age 16, 38.2 percent were employed in such fields. This may be due to the fact that Ann Arbor, in Washtenaw County, is home to the University of Michigan and University of Michigan Hospital, St. Joseph Mercy Hospital and a VA Health Care Center. Detroit, which will be further explored in our next post, had 26.1 percent of its residents employed in these industries. Wayne State University is located in Detroit, as is the Detroit Medical Center, Henry Ford Hospital, and a VA Health Care Center.
Macomb County had the fewest number of residents employed in these industries, at 20.9 percent, however, the cities of New Baltimore, Eastpointe, and Mount Clemens had between 25.1 and 30 percent of its residents employed in these industries..
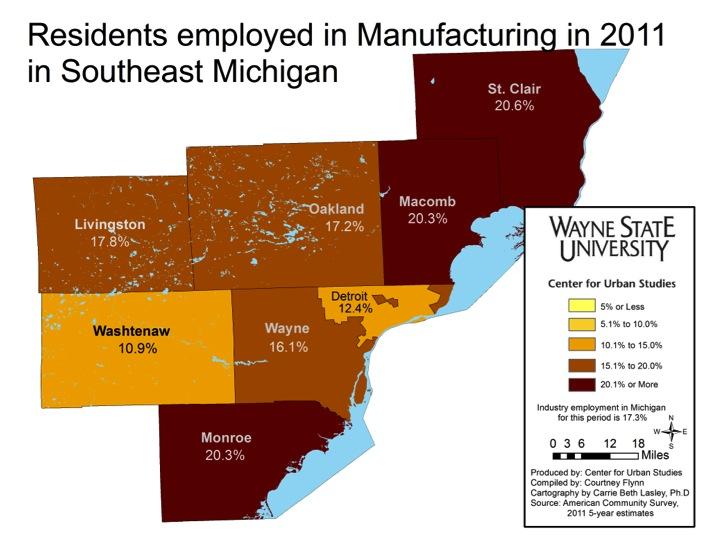
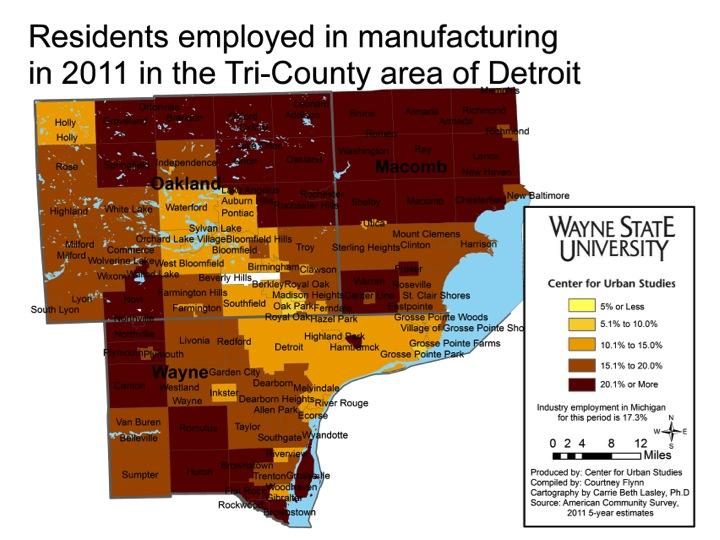
Of the seven counties in Southeastern Michigan, Wayne had the fewest percent of residents employed in the manufacturing industry, at 16.1 percent. St. Clair County had the most at 20.6 percent and Macomb and Monroe counties came in at a close second with 20.3 percent.
There was no municipality in the tri-county area where fewer than 5 percent of the residents were employed in manufacturing.
In the tri-county area, Oakland County, along with northwestern Wayne County, had several municipalities where more than 12 percent of the population was employed in professional, scientific, management, administration and waste services industries. Much of Macomb County had between 9.1 and 12 percent of the residents employed in one of those fields.
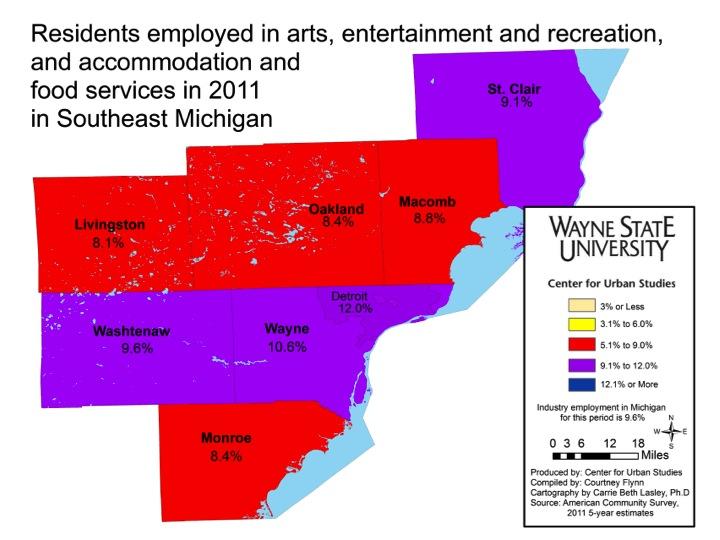
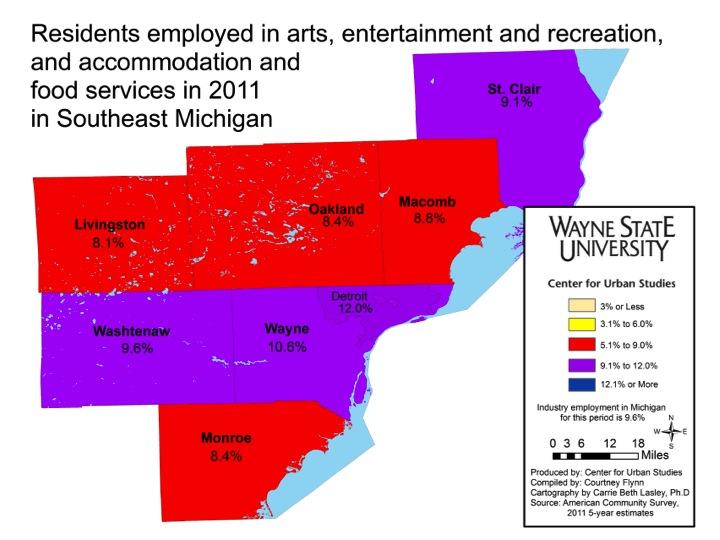
For the arts, entertainment and recreation, and accommodation and food services industries, the highest percent of the population employed across Southeastern Michigan is in the City of Detroit at 12 percent in 2011. Wayne County is the county in the region with the highest percent of its population employed in such occupations, and Livingston County has the fewest at 8.1 percent.
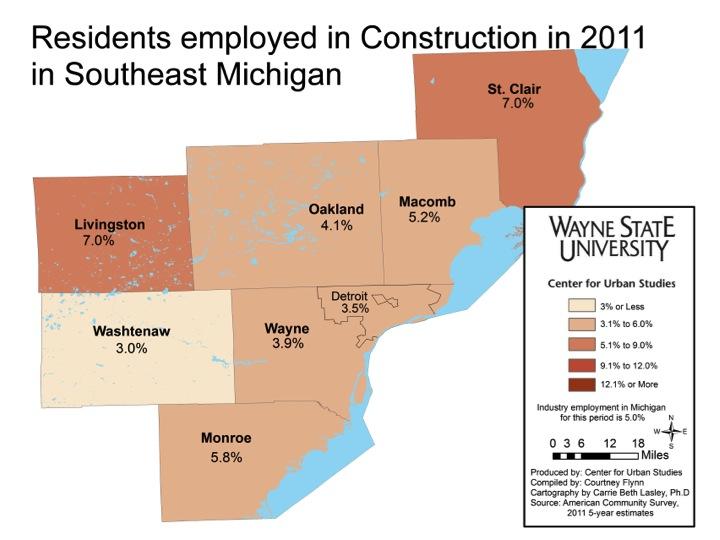
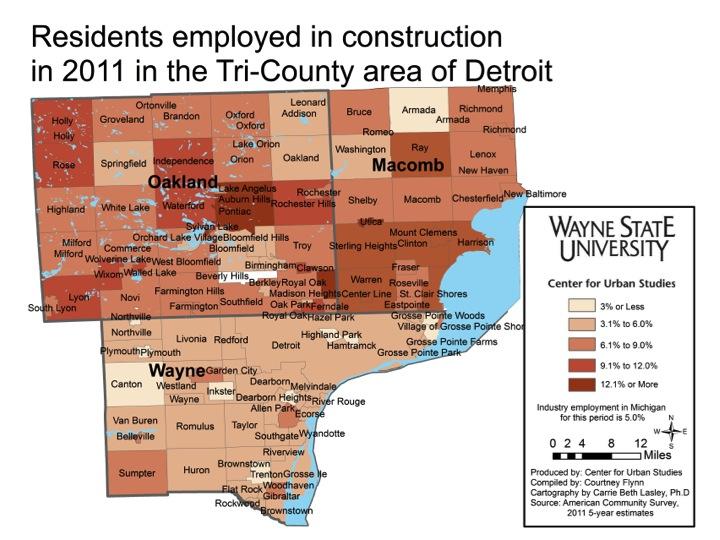
St. Clair and Livingston counties had the highest percentage of residents employed in construction in 2011, at 7.0 percent each. However, the cities of Auburn Hills and Pontiac in Oakland County had more than 12.1 percent of their population employed in the field.
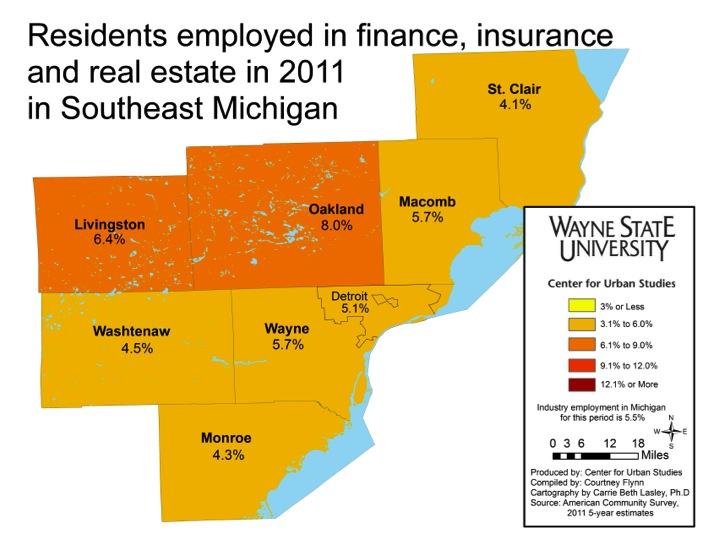
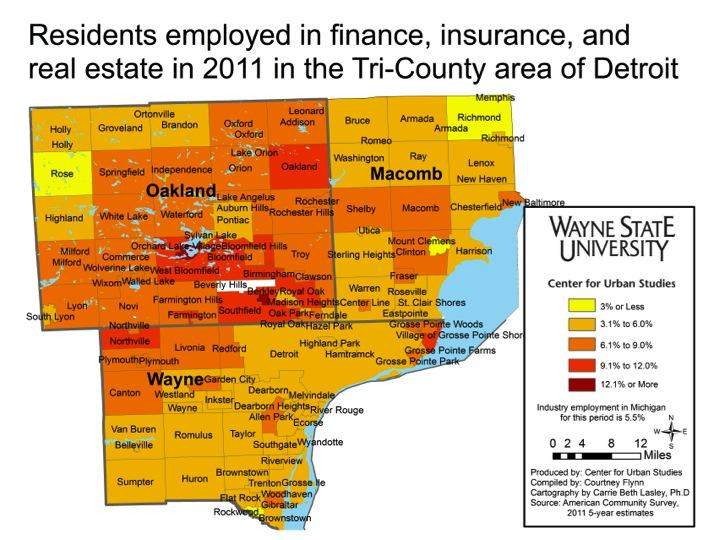
Finance, insurance, real estate, (FIRE) was a more common industry for residents from Oakland County at 8 percent; Livingston County came in second at 6.1 percent. There were two municipalities in Oakland County where 12.1 or more of the population was employed in one of those fields – Orchard Lake and Lathrup Village.
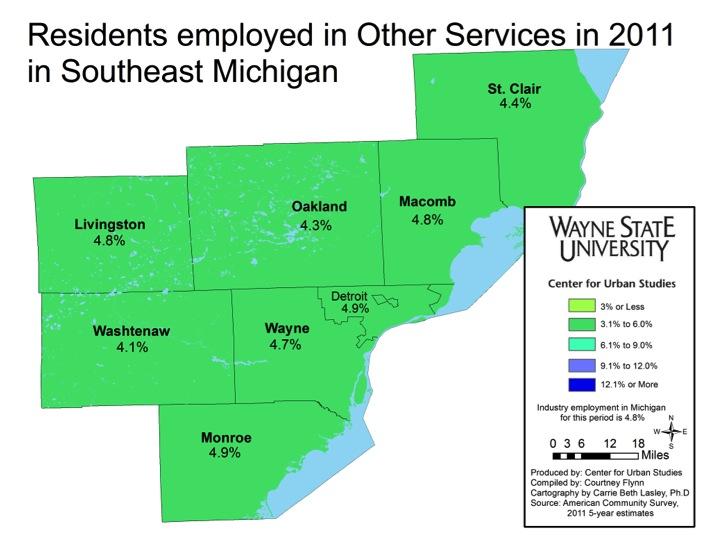
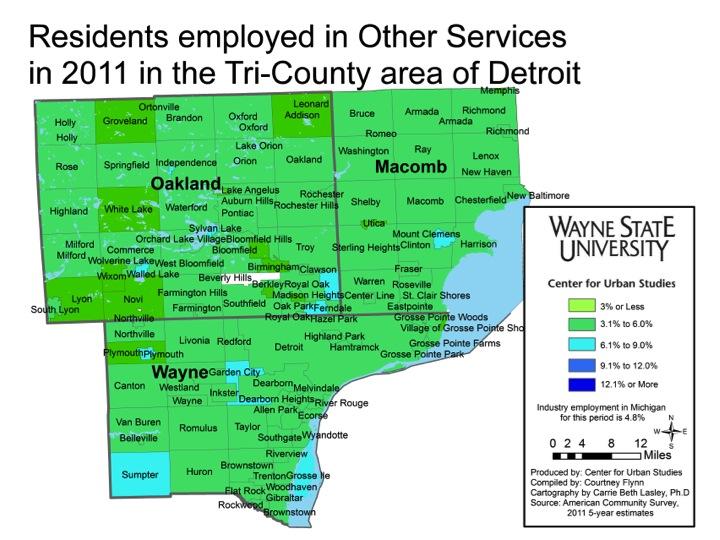
The percent of residents across the seven-county region employed in other services, which includes such jobs as mechanics, repairmen, launders and veterinary services fields, is distributed fairly evenly, ranging from 4.1 to 4.9 percent. Sumpter Township, Garden City, Grosse Ile, Dearborn Heights, Ferndale, Clawson, and Mount Clemens were all municipalities where between 6.1 and 9 percent of the populations were employed in the other services.
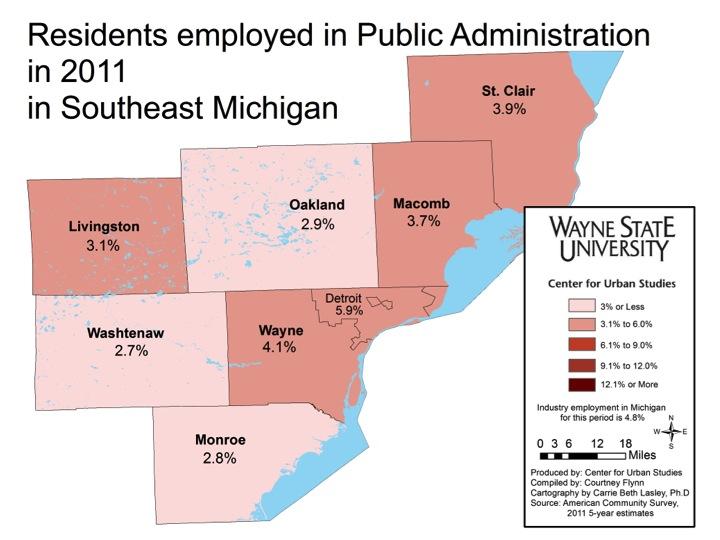
The City of Detroit had the highest population employed in Public Administration at 5.9 percent. Of all the counties in Southeastern Michigan, Wayne County had the highest number of employed at 4.1 percent.
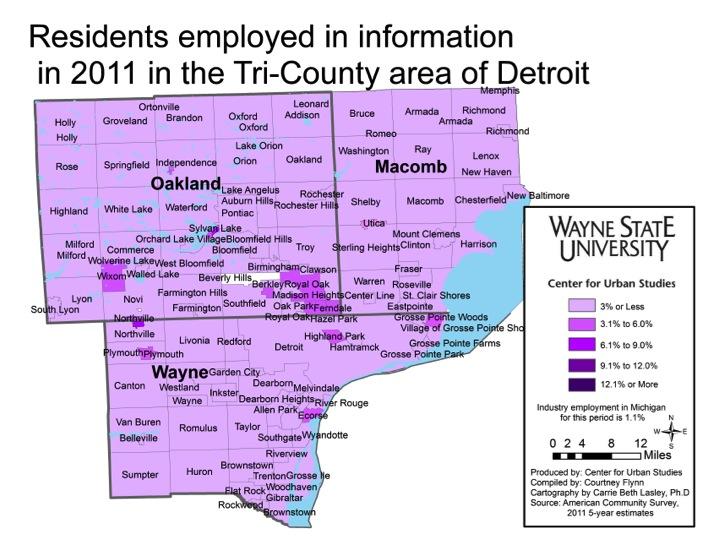
Although information services is described to be a growing field, less than 3 percent of the populations that makeup Macomb, Oakland, and Wayne counties are employed in this industry. The exceptions are residents in Royal Oak (3.1), Wixom (3.1),the cities of Highland Park (3.2), Hazel Park (3.2), Clarkston (3.3), Keego Harbor (3.5), Ferndale (3.7), Plymouth (3.8), Ecorse (4.0), Grosse Pointe Woods (4.3), Huntington Woods (4.3), Pleasant Ridge (4.6) Lathrup Village (5.7), Northville at (6.4) percent and Sylvan Lake at (6.9) that are employed in the field.
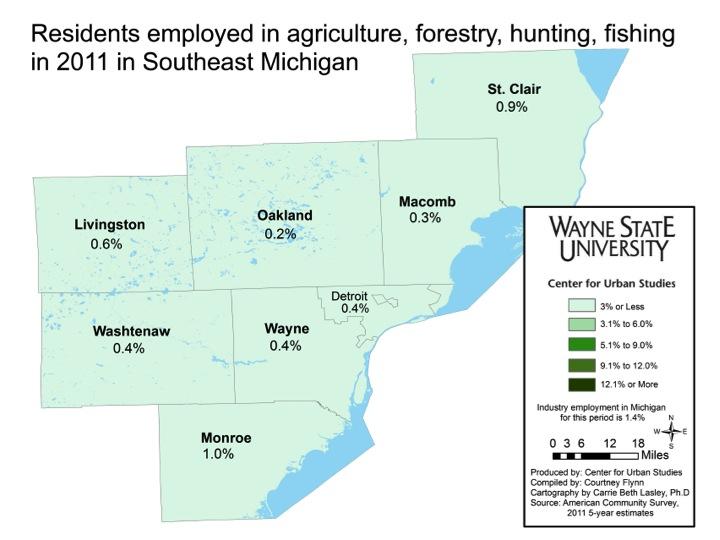
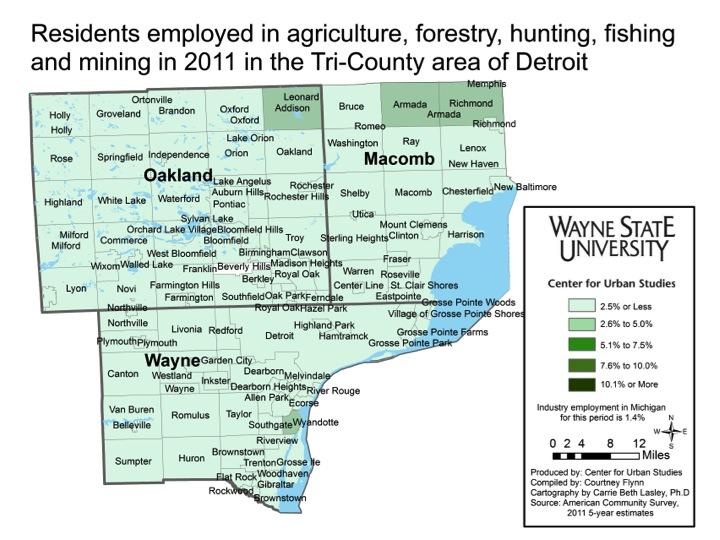
None of the seven counties in the region boast a population in which more than 1 percent is employed in the agriculture, hunting, fishing, or forestry fields. Monroe County has the highest population at 1 percent. The cities of Leonard and Addison in Oakland County; Armada, Richmond, and Memphis in Macomb County; and Wyandotte in Wayne County had between 2.6 and 5 percent of its population employed in one of the above-mentioned fields.
Reported lead releases into the environment up dramatically from 2002 to 2012 in Southeast Michigan
A number of national and international environmental incidents in the early 1980s led to the federal Emergency Planning and Community Right-to-Know Act (EPCRA) in 1986. EPCRA mandates all facilities that handle or produce at least 10,000 pounds of any of 650 chemicals known to be harmful to humans or the environment annually report any releases into the environment This information is made available to the public via the Toxic Release Inventory (TRI).
In this post we will examine releases of two of those 650 chemicals – lead and lead-based compounds. For those interested in learning the effects of lead please click here.
Below is a map showing the location of the 2012 releases of lead and lead-based compounds in the Southeast Michigan area.
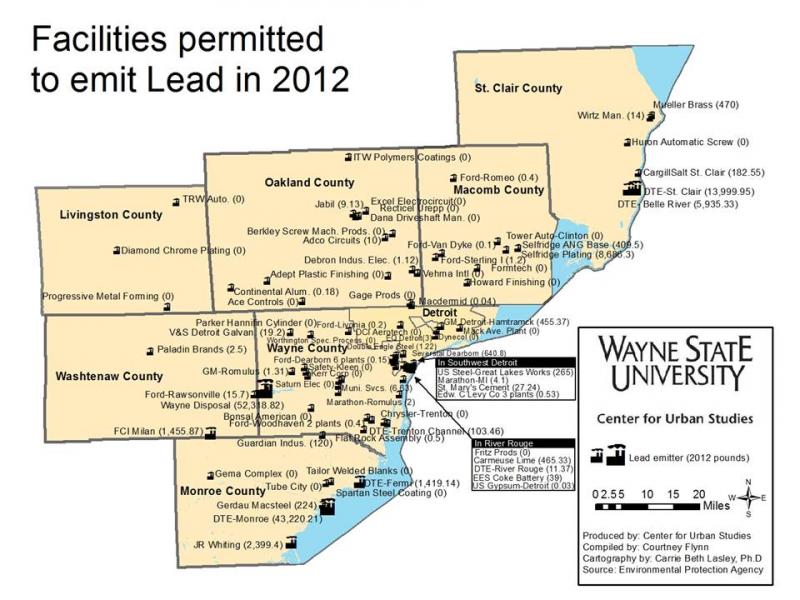
In Southeast Michigan, 38 of 87 reporting facilities indicated they had no on-site releases into the land, water or air (These are 0’s on the map). The largest releases Southeast Michigan was Wayne Disposal, in Belleville, which reported more than 52,000 pounds of lead or lead-based compounds. How much of this stays in landfills versus gets released by air or water is not reported. This facility is a landfill that receives toxic waste, including being the only recipient of polychlorinated byphenols (PCBs) in the State of Michigan. In addition to skilled waste handlers, power generation is another top contributor to lead releases, with DTE and other generating plants along rivers and lakes releasing large quantities of lead and lead-based compounds, well over 60,000 pounds.
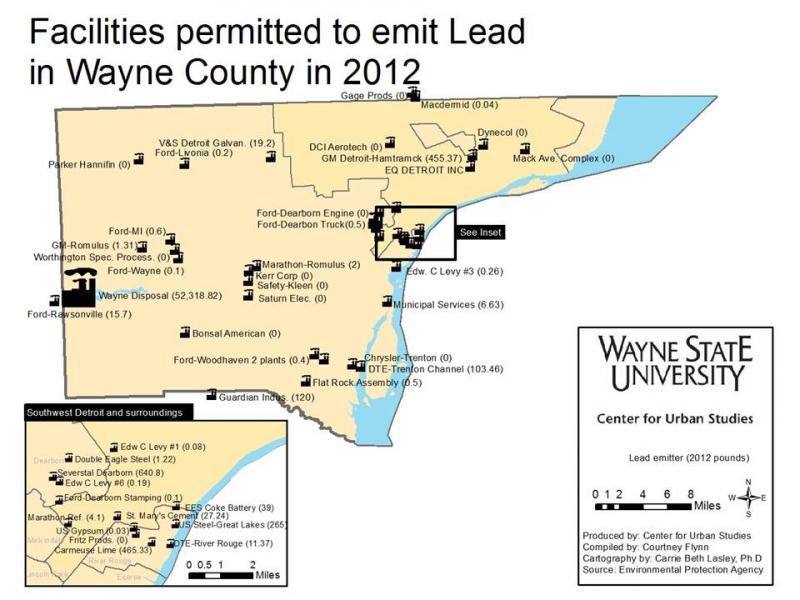
Wayne Disposal, the region’s largest reporter of releases lead and lead-based-compounds (52,318 pounds), is located in Wayne County, along with about 35 other facilities. It may be reasonable to assume that the vast majority of this went into their landfill, but no data is provided about the specifics beyond the amounts. There are a total of 36 facilities reporting in Wayne County; altogether these facilities reported releasing a total of 54,366.91 pounds in 2012, as shown on the map below. There is a concentration of facilities reporting releases of lead and lead-based-compound in and near Southwest Detroit. However, the largest reported releases in Detroit were from the GM Detroit-Hamtramck Assembly Plant, which is bisected by the southern border of Hamtramck and Detroit.
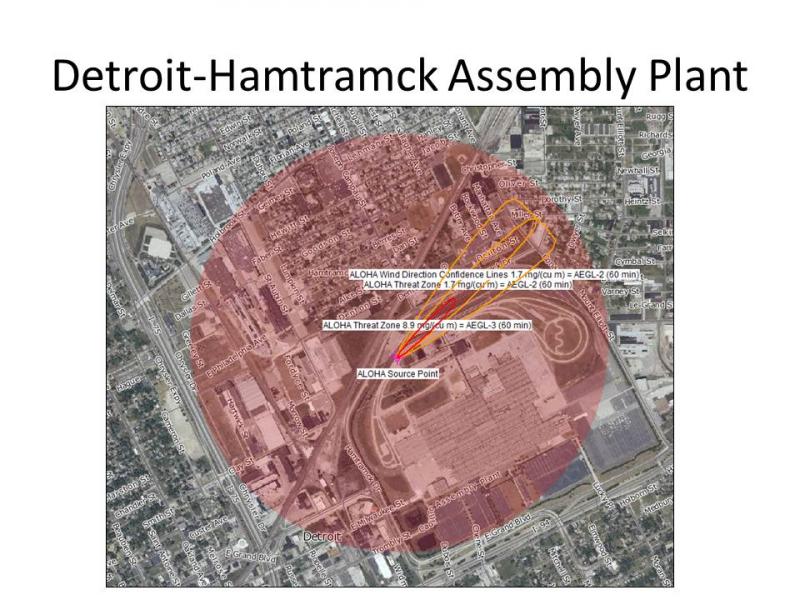
Releasing just over 455 pounds of lead-based compounds into the air in 2012, the GM Detroit-Hamtramck Assembly Plant is large, as well as near areas of dense settlement. Using software developed by the U.S. Military and adapted for use by the Environmental Protection Agency, we used dominant weather conditions to determine the approximate area in which these compounds, emitted from on-site stacks, may fall. The result is shown on the map below. The tri-color cone is the area most likely to be impacted because of dominant weather conditions (Winds 10 mph, 58oF, partly cloudy). The circle includes areas impacted by changing wind directions. Additional clouds, wind or precipitation could create a wider pattern of impact. Within the circle, live 5,963 people in 1,997 housing units (2010 Census). There are also three schools (Hanley, Holbrook and Oakland International) and one park with athletic facilities (Veterans in Hamtramck). Oakland International Academy falls under the cone of dominant exposure.
This set of estimates are based on a centroid in the northern area of the site, near cooling towers, but the results could vary depending on the specific location on the site where releases occur. There appear to be several large stacks and many small stacks on the site. Some stacks are located further east on the site, which would yield estimates that cover more residential areas in Detroit.
Releasing just more than 455 pounds of lead-based compounds in 2012, the GM Detroit-Hamtramck Assembly Plant is large, as well as near areas of dense settlement. Using software developed by the U.S. Military and adapted for use by the Environmental Protection Agency, we used dominant weather conditions to determine the approximate area in which these compounds, emitted from on-site stacks, may fall. The result is shown on the map below. The tri-color cone is the area most likely to be impacted because of dominant weather conditions (Winds 10 mph, 58oF, partly cloudy). The circle includes areas impacted by changing wind directions. Additional clouds, wind or precipitation could create a wider pattern of impact. Within the circle, live 5,963 people in 1,997 housing units (2010 Census). There are also three schools (Hanley, Holbrook and Oakland International) and one park with athletic facilities (Veterans in Hamtramck). Oakland International Academy falls under the cone of dominant exposure.
NOTE:The software Aloha and Marplot were used to used to estimate the spread of lead pollution in the area. In Aloha lead pollution can not be estimated so mercury was used as a proxy. The weight of lead per cubic inch is 0.39 lbs; the weight of mercury is 0.49 lbs. per cubic inch.
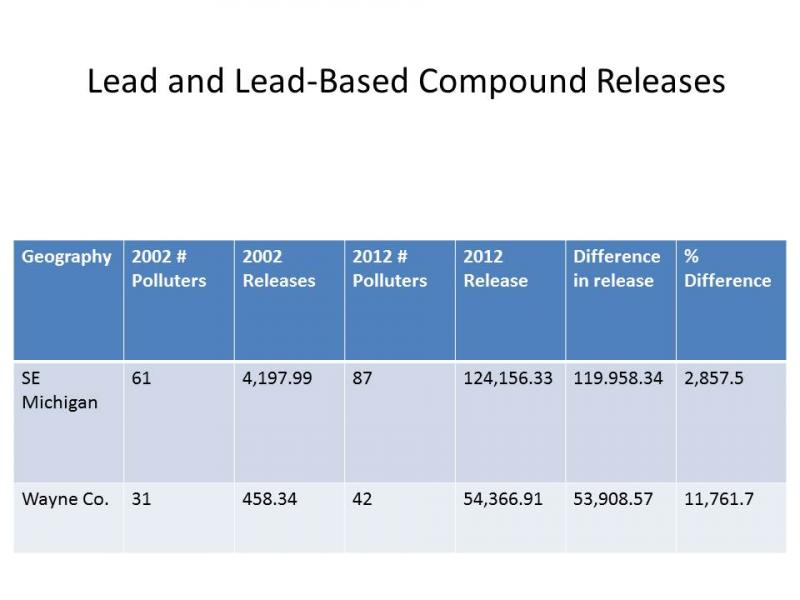
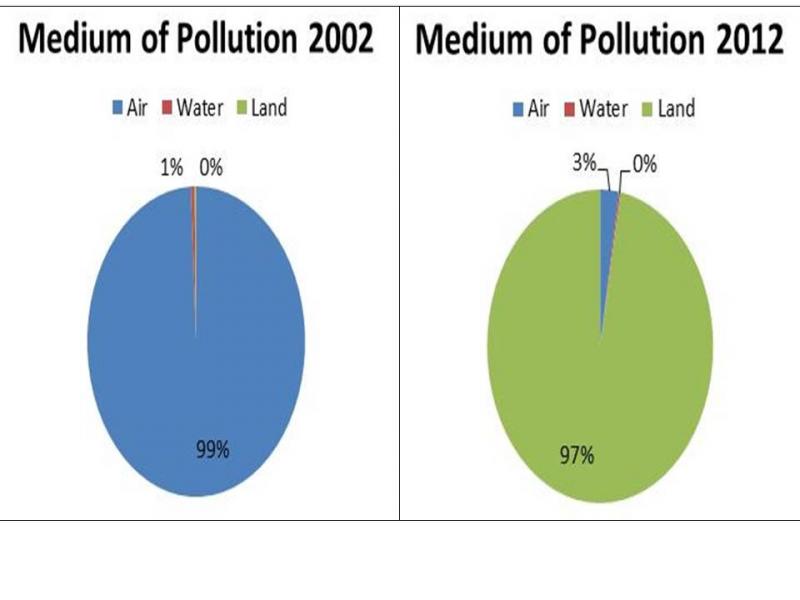
To better understand the increase in lead pollution, we examined how lead was released into Wayne County. TRI documents releases into all mediums of the environment, breaking them down into details. Aggregating the categories into the three major environmental mediums – air, water and land, we can see that which methods of lead pollution has changed dramatically over the decade. In 2002, air pollution was the predominant medium, accounting for 99 percent of all lead pollution (455 pounds in total from stack releases and fugitive emissions). Since 2002, this amount has increased in aggregate (1,453 pounds in 2012, a 319 percent increase); however, the proportion of reported lead releases into the air has decreased in relation to the total, from 99 percent in 2002 to 3 percent in 2012.
The dramatic increase in reported lead releases has come from land releases – or that stored in landfills or otherwise held on site. In 2012, 96 percent of the total emissions for the region came from a single facility – Wayne Disposal, a toxic waste facility located on the Wayne/Washtenaw border near Belleville. As explained earlier, a facility must report if it handles more than 10,000 pounds of a toxic chemical, whether or not the facility releases the chemical or handles it without a release. Opened in 1997, Wayne Disposal was not handling enough lead or lead-based compounds in 2002 to require TRI reporting. By 2004, Wayne Disposal was handling enough to trigger reporting requirements. Eight years later, it is the largest single reporter in the region, reporting more than 52,000 pounds of lead or lead-based compounds. In future posts we plan to investigate the sources of the lead maintained at the facility. In general, we expect to find that most of the lead is from lead-based paint that is part of demolition debris from older houses in the metropolitan area.
Mortality related to Disease:Region below average for Alzheimer’s mortality
This post portrays regional mortality rates related to disease, in particular, cancer, heart disease and Alzheimer’s disease.
The cancer mortality rate for those above the age 75 was the highest of the three diseases presented below. Alzheimer’s disease was the only illness presented below where none of the counties in Southeastern Michigan has a mortality rate above the state average. From 2006-2010, the rolling average mortality rate related to Alzheimer’s disease for the State of Michigan was recorded at 22.7 deaths per 100,000 residents. Macomb was highest in the region at 20.9.
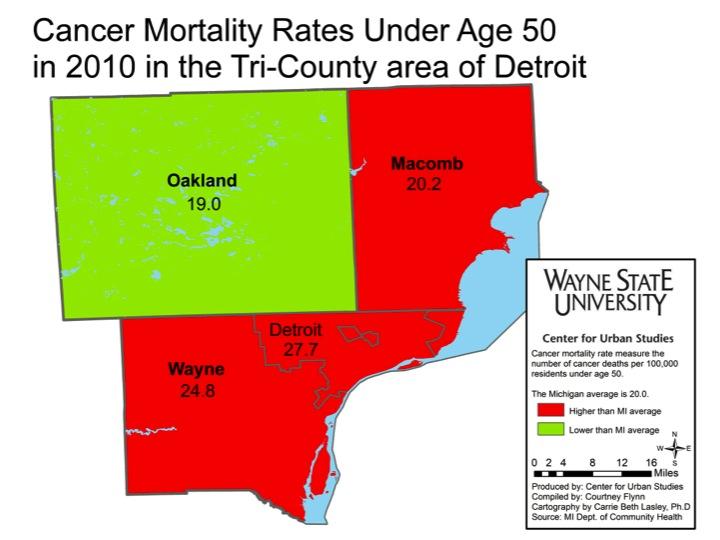
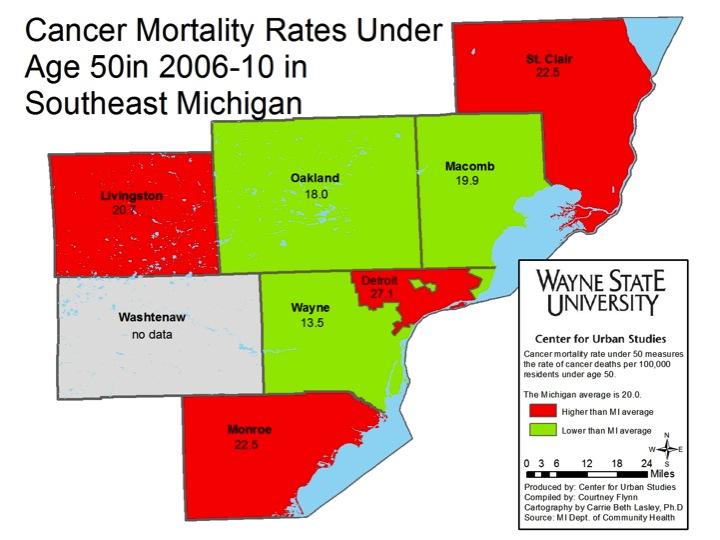
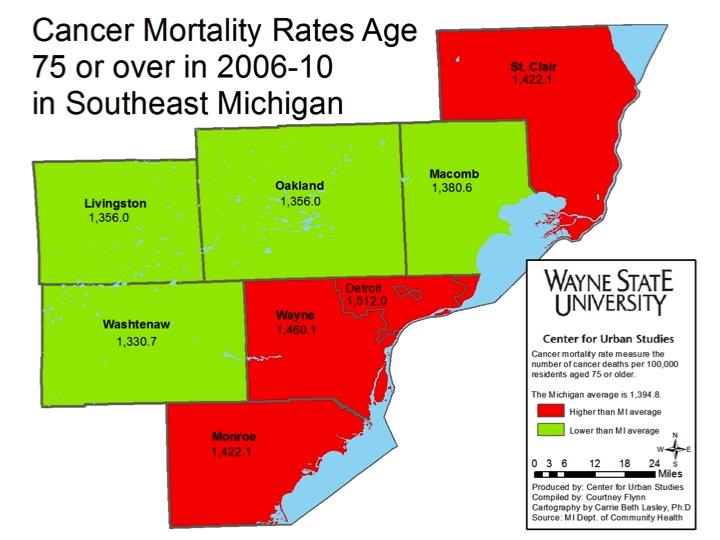
The mortality rate for those 75 or older with cancer is about 150 times higher than those below the age of 50. For example, in the City of Detroit the mortality rate for those above the age of 75 with cancer was 1,512 per 100,000 residents from 2006 to 2010. For those below the age of 50 the mortality rate was 27.1 per 100,000 residents for the City of Detroit during the same time frame.
On all three maps, Oakland County was below the state average for the mortality rate related to cancer. Mortality rates related to cancer for the City of Detroit, however, were consistently above the state average, across age group and time.
The Michigan Department of Community Health did not document cancer mortality rates for those between the age of 51 and 74.
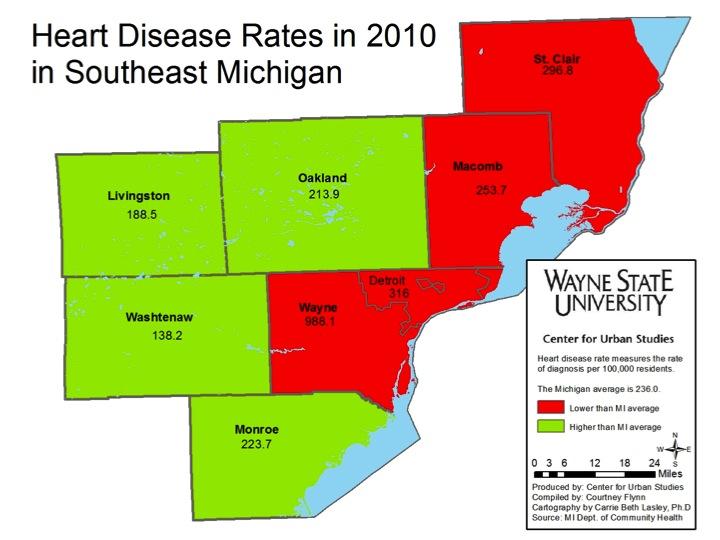
Heart disease is another illness where Detroit was again above the state average, but in this case lower than Wayne County as a whole. In 2010, according to the Michigan Department of Community Health (MDCH), there were 236 deaths related to heart disease in the State of Michigan. In comparison, MDCH reported 316 deaths in Detroit and 988 deaths per 100,000 residents in Wayne County related to heart disease in 2010. Washtenaw County was on the opposite end of the spectrum with a mortality rate related to heart disease recorded at 138.2 per 100,000 residents.
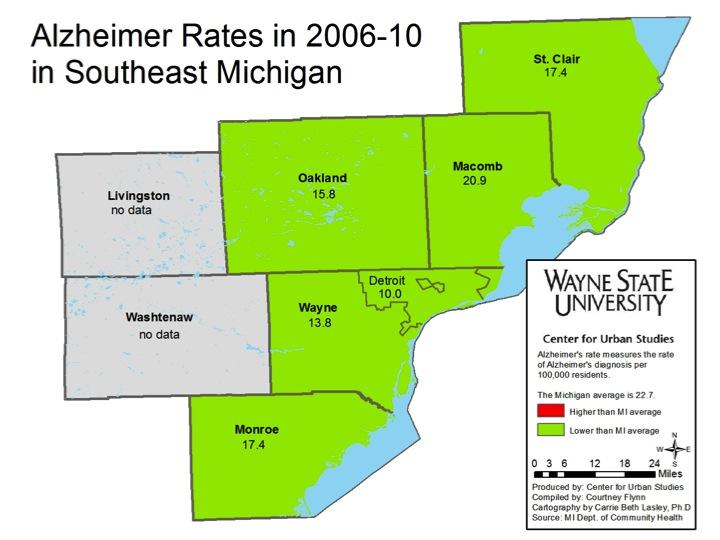
Of the three types of diseases presented, Alzheimer’s disease had the lowest mortality rates. According to MDCH, the state average was 22.7 Alzheimer’s related deaths per 100,000 residents from 2006-10. None of the areas presented on the map were at or above the state average. Macomb County had the highest rate at 20.9 while Detroit had the lowest at 10 deaths per 100,000 residents.
Information for Livingston and Washtenaw counties was not available because the state reported it had not collected enough data to determine an accurate rate.
A different look: Southeastern Michigan’s population
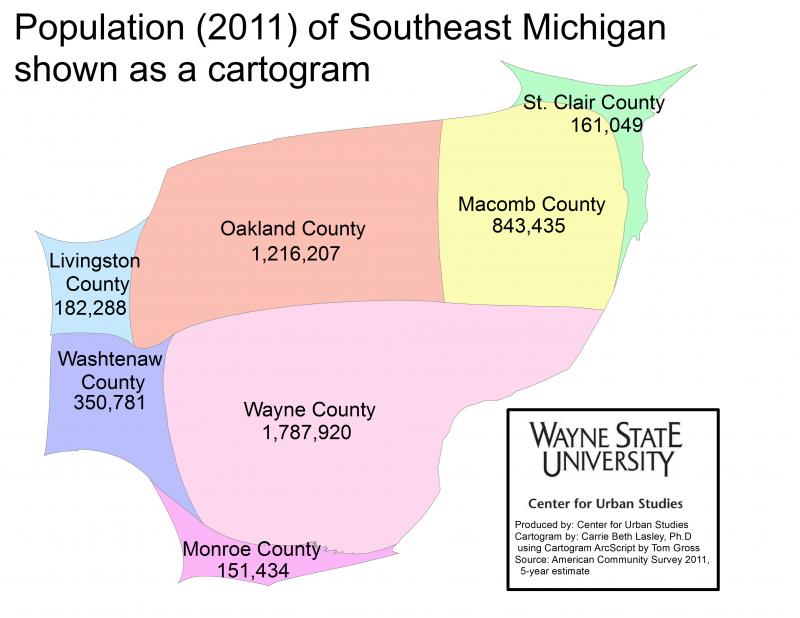
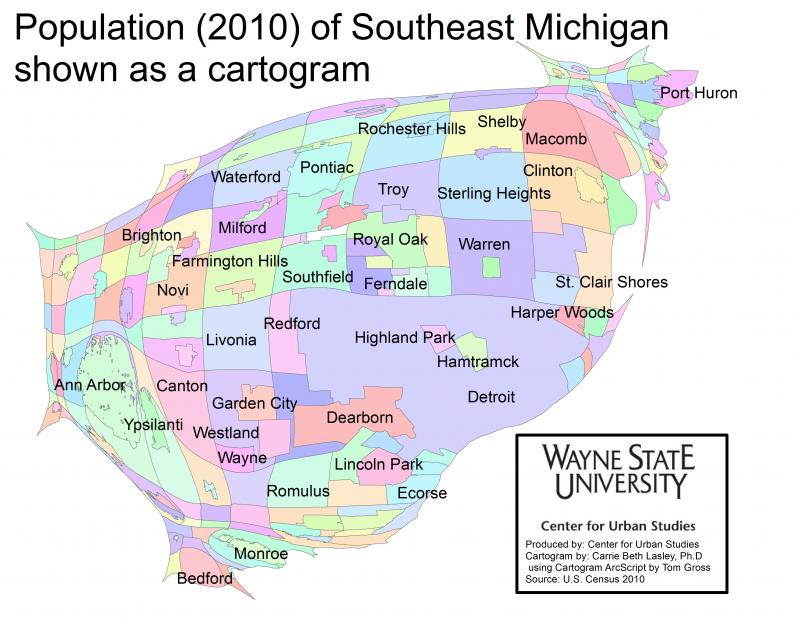
In the population cartograms below Wayne, Macomb, Oakland, Livingston, Monroe, St. Clair, and Washtenaw counties, along with the municipalities, are displayed according to their population size. A cartogram is a geographic representation method that alters the area and shape to demonstrate the relative relationship of a data feature while preserving the spatial relationship. This method allows you to visually apply weight to data, changing the way we visually experience the map, while maintaining geographic boundaries.
As can be seen, Wayne County had the highest population in 2011 of the seven counties, at about 1.8 million, and Detroit had the highest population of the all the municipalities in the region in 2010 at about 714,000.While Detroit is the most eye-catching municipality on the map because of its size, the surrounding suburbs, such as Warren, Sterling Heights, and Dearborn, also have higher populations than places in St. Clair and Washtenaw counties, with exceptions like Ann Arbor and Port Huron.
The population information was provided by the U.S. Census and the American Community Survey.
Highest Arab, Hispanic populations found in Wayne County
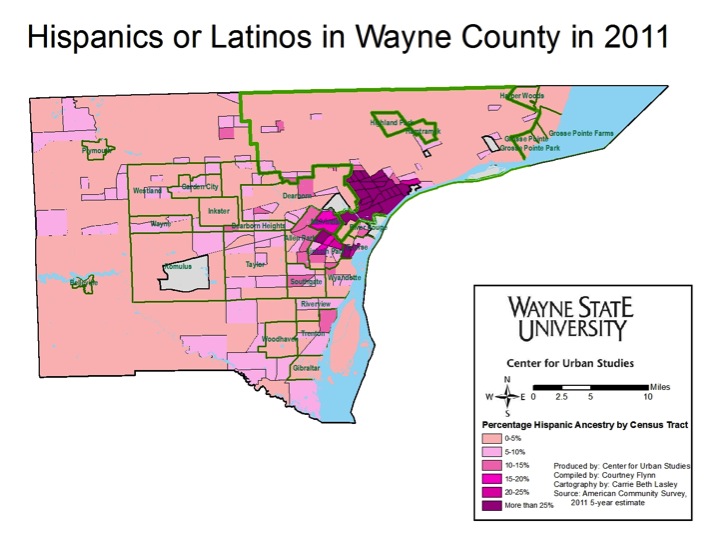
For this post another look at the population makeup of Southeastern Michigan is examined, this time by ethnicity. The maps below show that majority of the ethnic groups examined in this post-Arab and Hispanics or Latinos-were located in Wayne County, particularly in and around Detroit, as of 2011. It is important to note, however, that there was a presence of these ethnic groups throughout the seven-county region too. The only other areas with a high a percentage of these ethnic groups beyond the Detroit-Dearborn area was Pontiac in Oakland County and Sterling Heights in Macomb County.
The information shown throughout this post was obtained from the 2011 American Community Survey, based on five year estimates.
The Arab population in the seven county region was heavily concentrated in Dearborn in 2011, which is in Wayne County. According to the American Community Survey, about 40 percent of the Dearborn population was of Arab ancestry; in Wayne County 4.2 percent of the population are of Arab ancestry. When taking a closer look at the Dearborn population, it can be seen that those with a Lebanese ancestry made up a large portion of the population in northeast Dearborn, as did those with an unclassified ancestry and an “other” Arab ancestry. There was also a smaller presence of Syrians and Armenians throughout the area.
A similar concentration of Arabs could also be found in Hamtramck in 2011. According to the Hamtramck Ethnic Enclaves map, the Arab population within the city is more concentrated in the eastern half. Other ethnic groups present in Hamtramck include those of Bangladeshi, Yugoslavian and Polish decent.
In Sterling Heights, those with a Chaldean, Iraqi and Lebanese decent made majority of the city’s Arab population. About 43 percent of the city’s population is foreign born.
While the above mentioned cities had relatively high concentrations of Arabs as of 2011, there was also a smaller concentration of Arabs (5-20 percent) around Sterling Heights, the Farmington Hills-West Bloomfield areas in Oakland County, and the Wayne and Washtenaw County borders
For the Hispanic-Latino ethnic group, Southwest Detroit had the heaviest concentration, where this group represented about 47 percent. A closer look at the Hispanic population in Southwest Detroit shows that majority of the Hispanic residents were of Mexican decent, as of 2011; those of Spanish decent were the least represented.
In Pontiac, there were areas where over 25 percent of the population is of a Hispanic or Latino background.
People of Hispanic or Latino decent were widely distributed across the region. Outside of Detroit, a few Downriver communities and portions of Pontiac, Hispanic or Latino residents appeared to represent between 0 and 10 percent of an area’s population.
Minorities increasingly distributed across the region
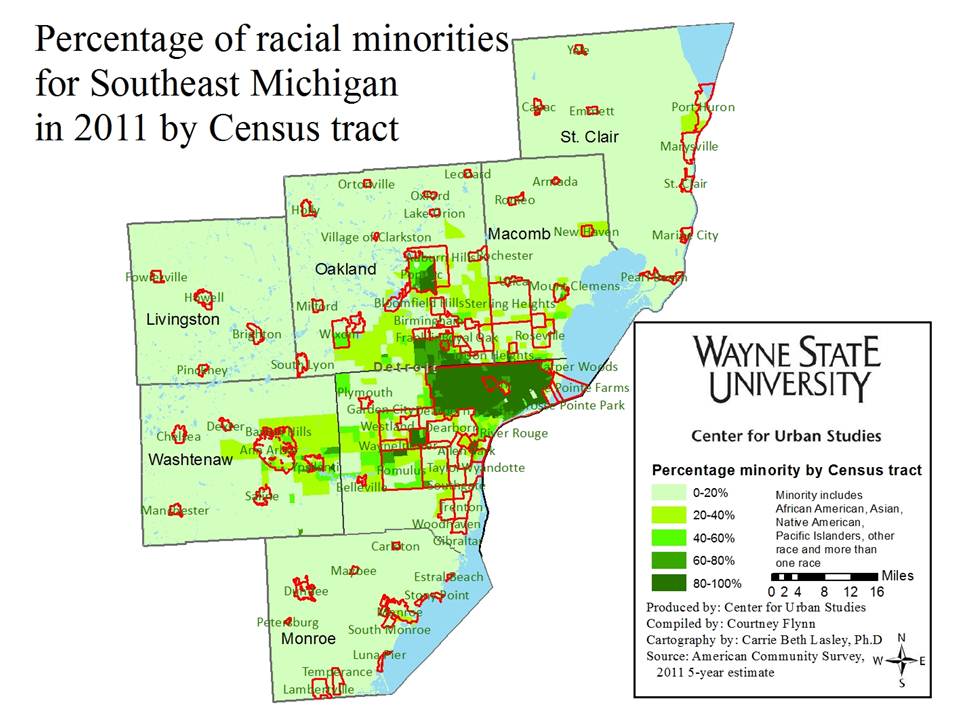
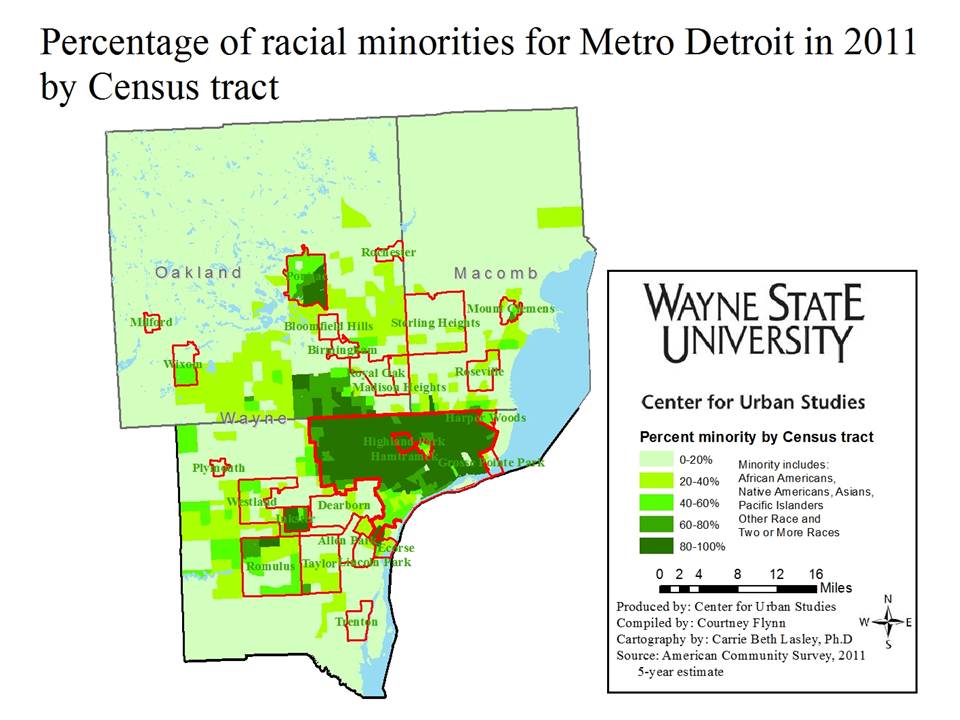
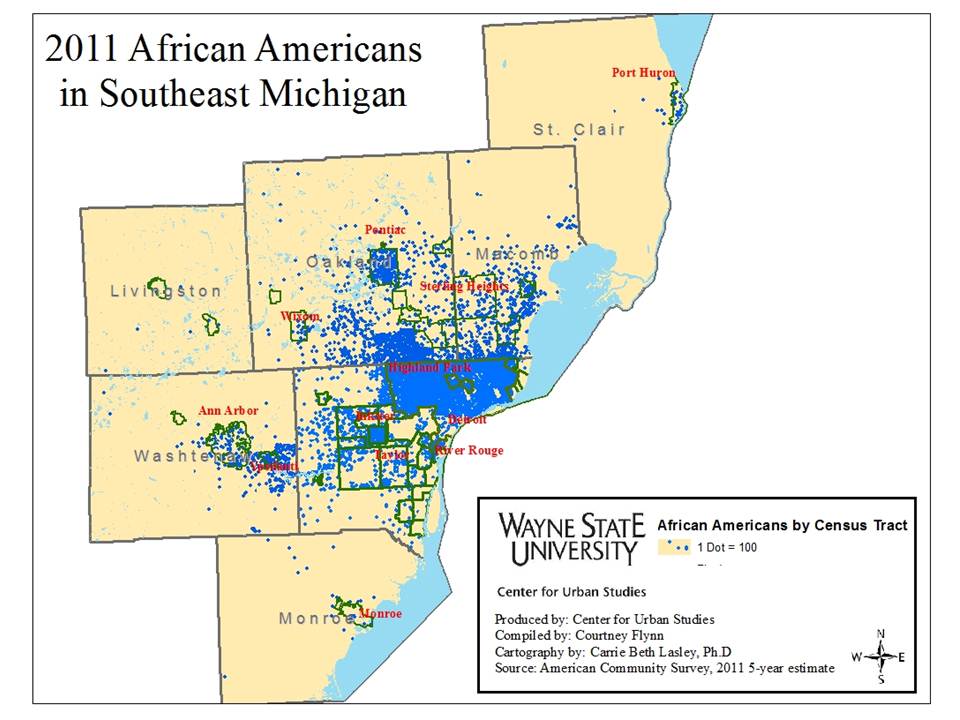
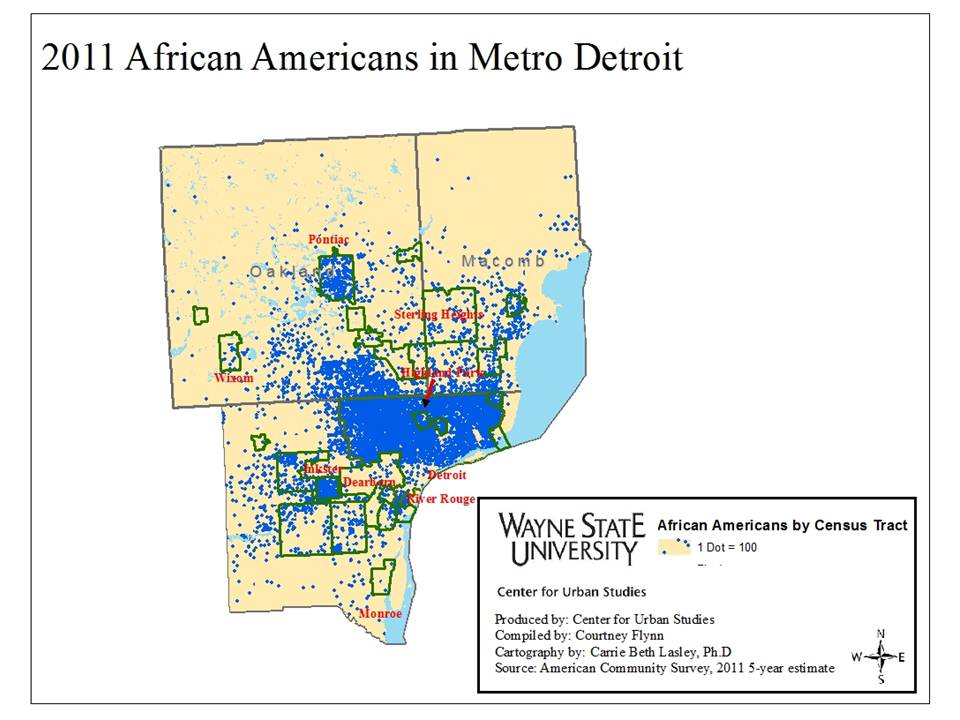
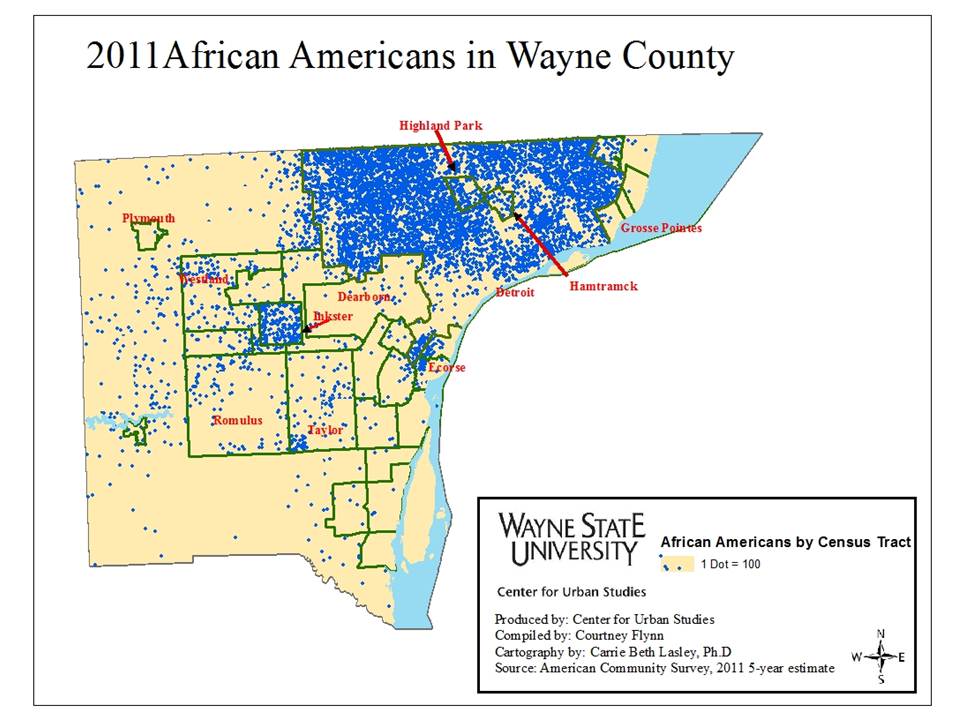
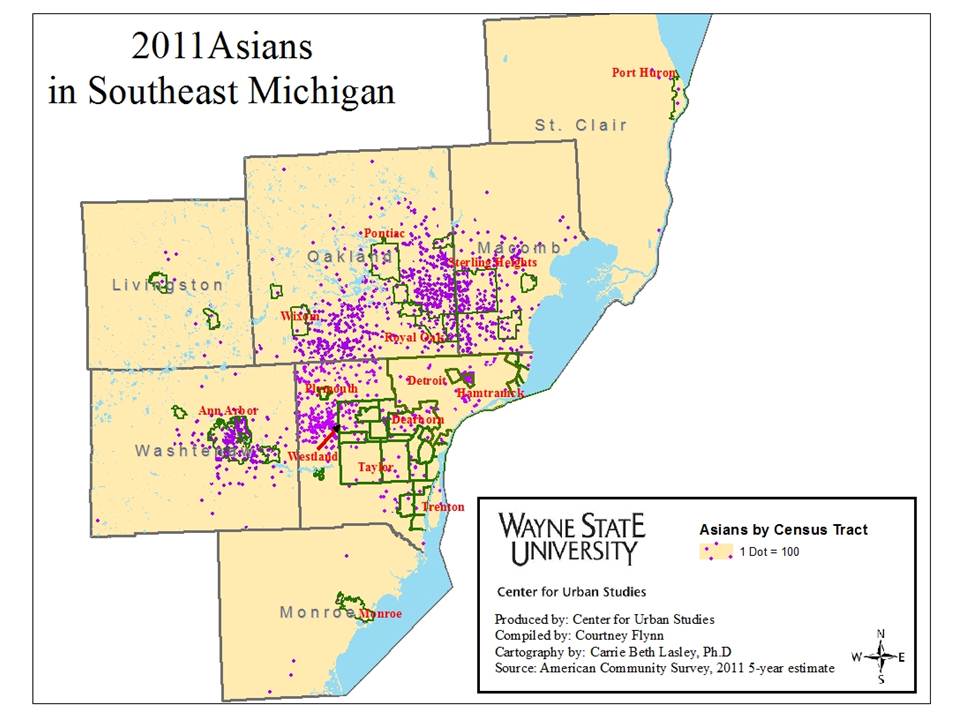
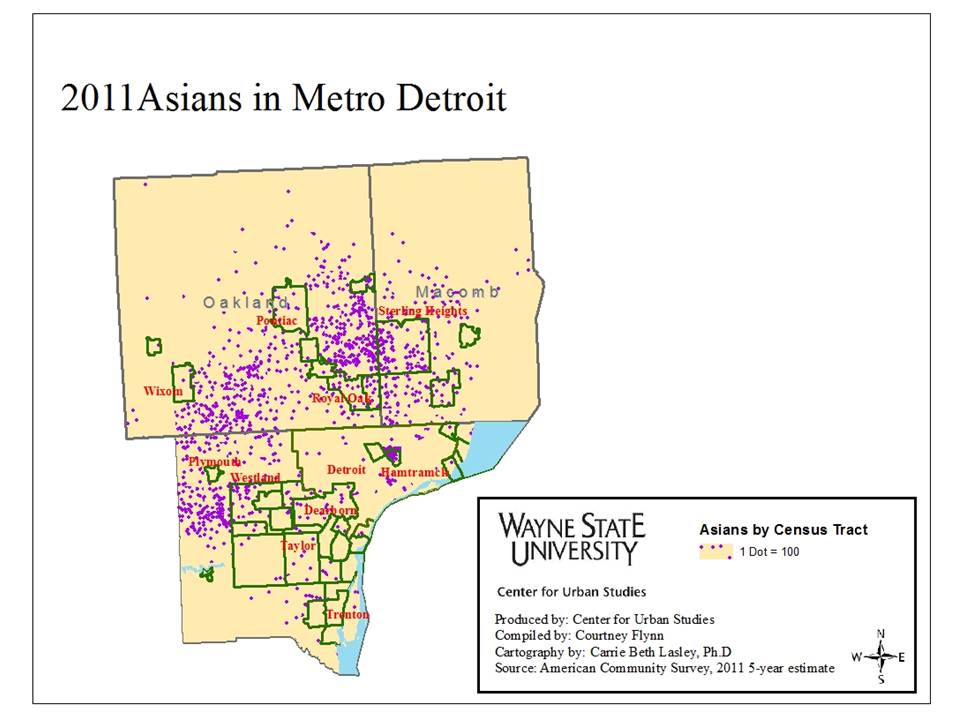
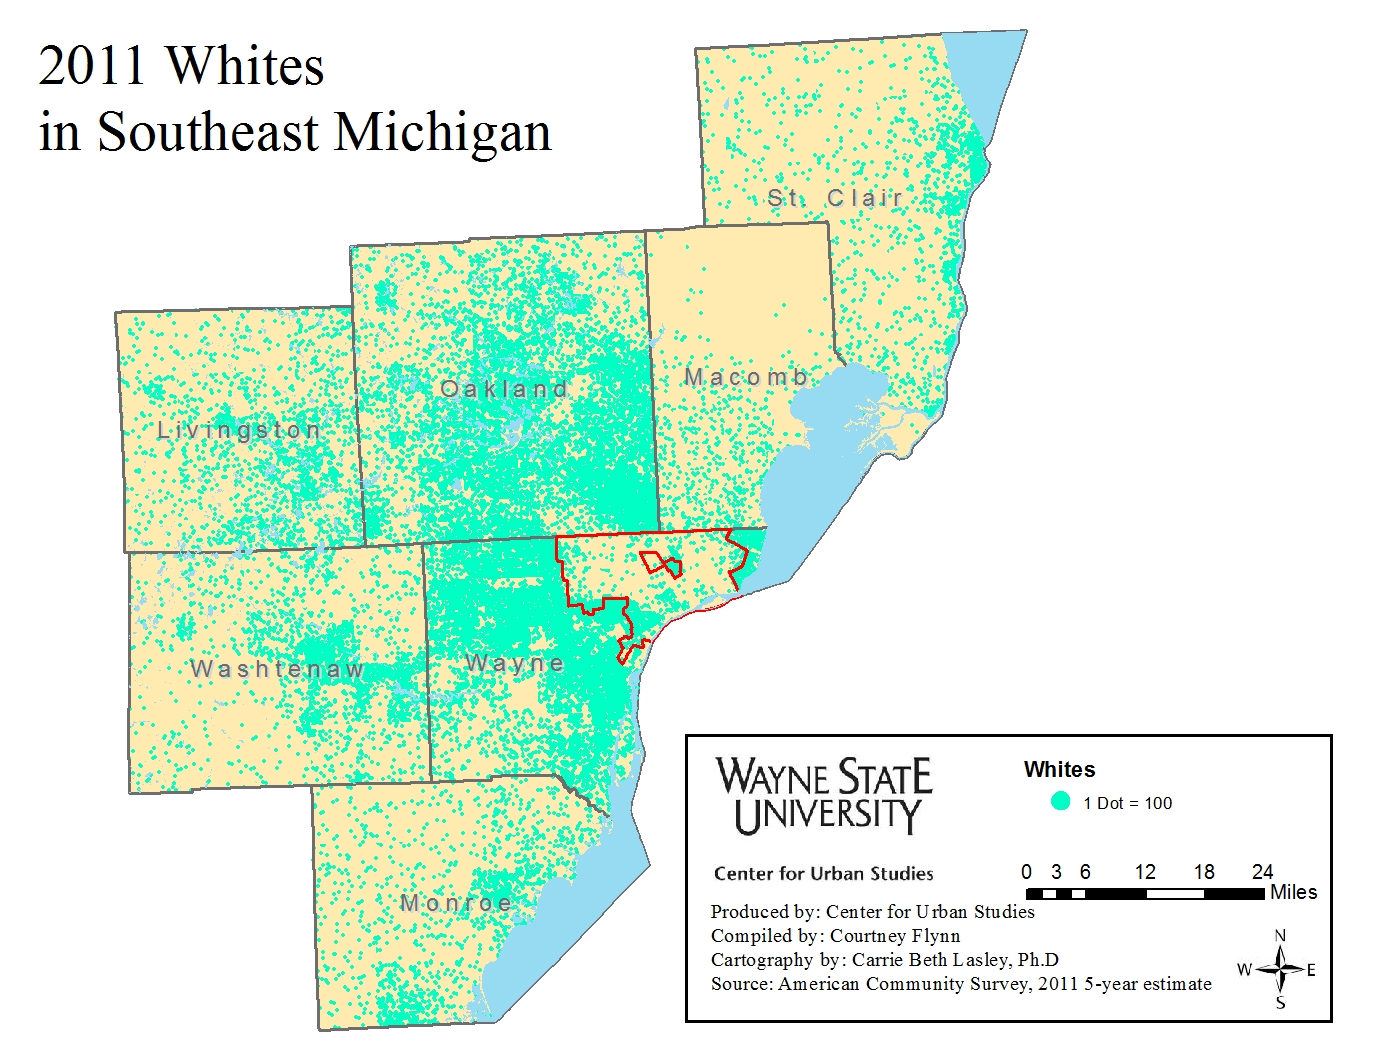
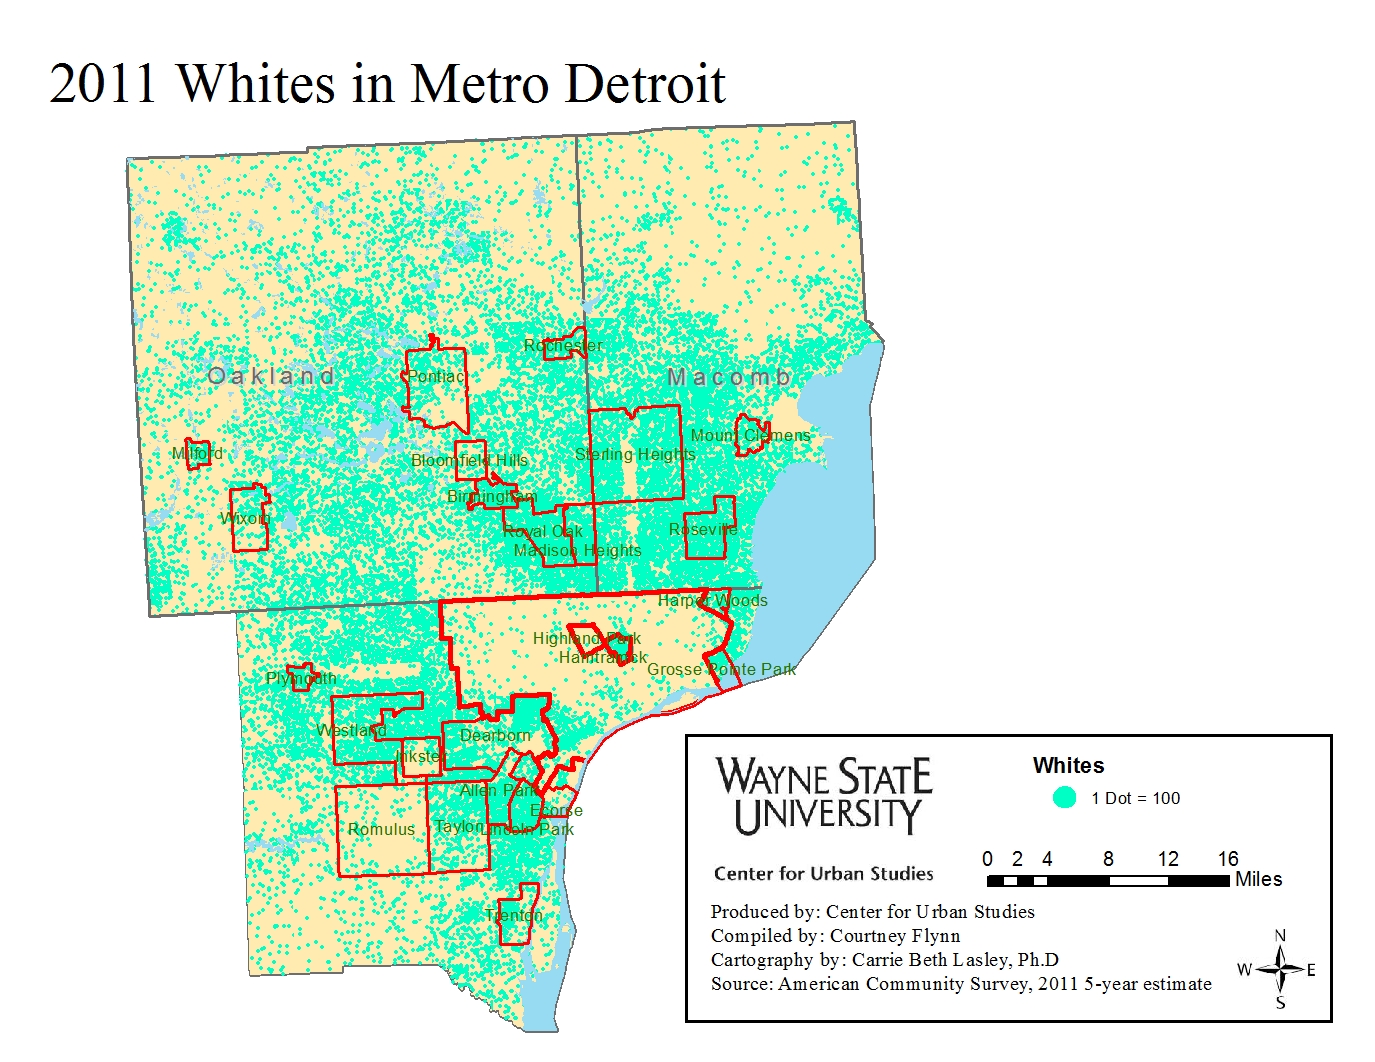
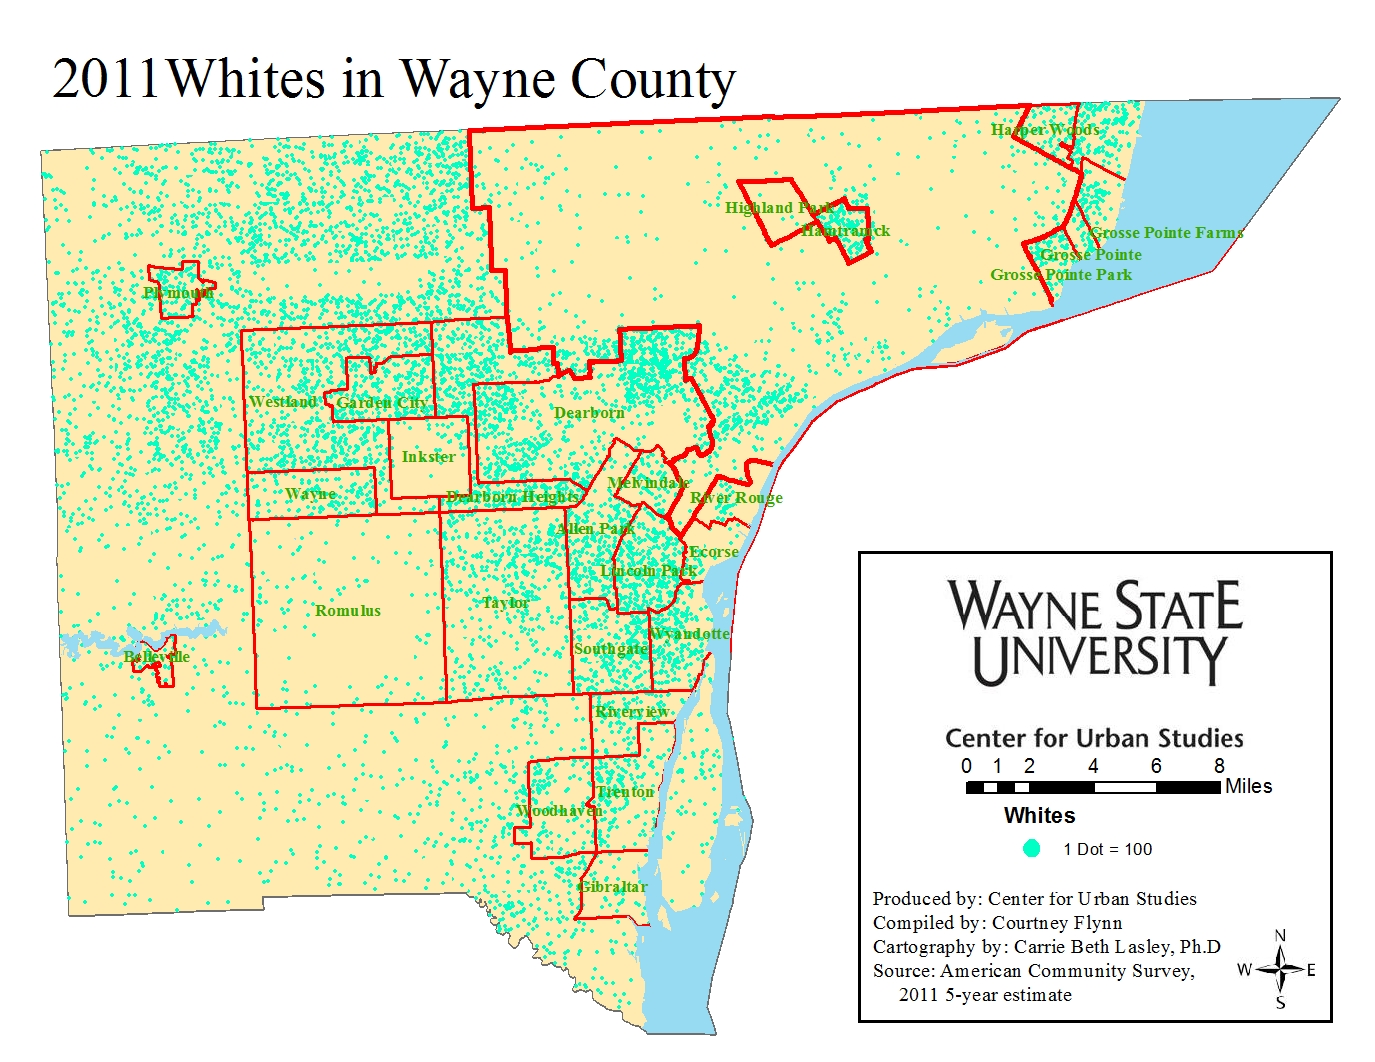
In the following post the percent of minorities that makeup Southeastern Michigan is examined. We examine the overall percent of minorities for the region, in addition to showing, through a dot map, the concentration of African Americans, Asians, and Whites in the region. The maps show that the City of Detroit has the highest percent of minorities in the region, particularly African Americans. However, Asians are largely located outside Detroit, though they represent a smaller portion of minorities.
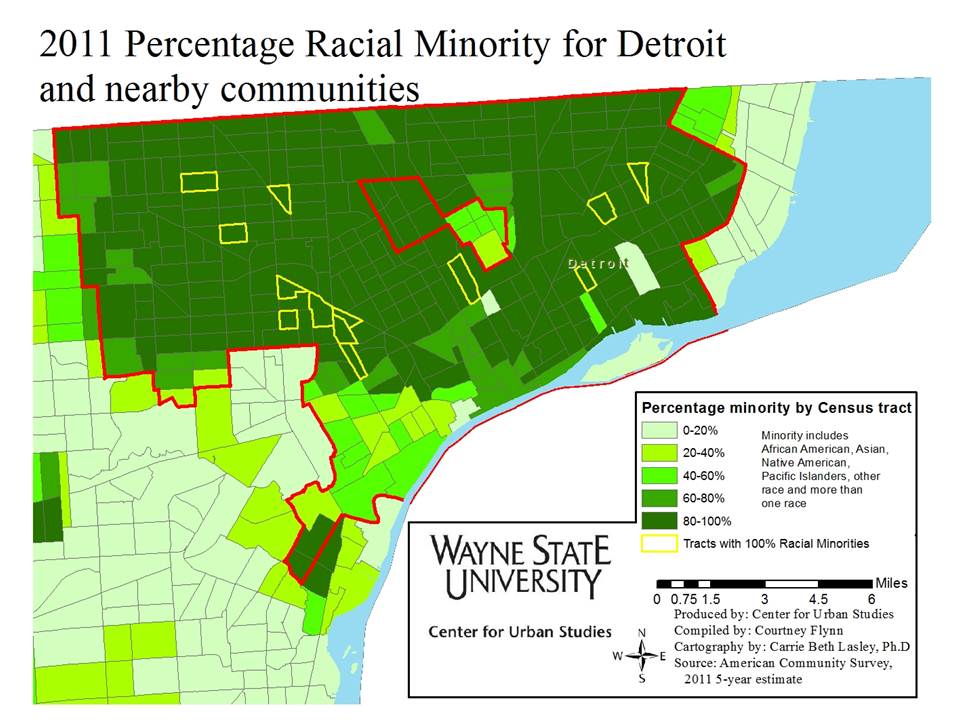
The information shown throughout this post was obtained from the 2011 American Community Survey, which was based on five year estimates. For the total minority maps the following races are included: African American, Native American, Asian, Pacific Islander, other races and two more races.
The City of Detroit is predominantly minority, the majority of which are African American, according to the 2011 American Community Survey. While not every neighborhood of Detroit was predominantly minority, there were several-Northwest, Barton-McFarland and portions of the east, west and northeast sides-where 100 percent of the residents were identified as minority. Other areas in the region where the population was made up of between 81 and 100 percent minorities were Pontiac, Inkster, Highland Park and River Rouge.
When looking beyond the City of Detroit, the percent is much lower. For example, nearly all of Livingston, St. Clair, Monroe and Macomb counties are made up of 0-20 percent minorities. When looking at the dot map depicting where Asians live, it is clear that there are heavy concentrations in the Ann Arbor, Plymouth, Westland, Sterling Heights and Royal Oak. The dot maps that depict the White population show high concentrations just outside of the City of Detroit, in the Grosse Pointes, Lincoln Park and throughout Oakland County.
In next week’s post we will examine the distribution and concentration of various ethnic groups in the region, particularly Hispanics and Arabs.
Outlying counties in Southeast Michigan have lower population density
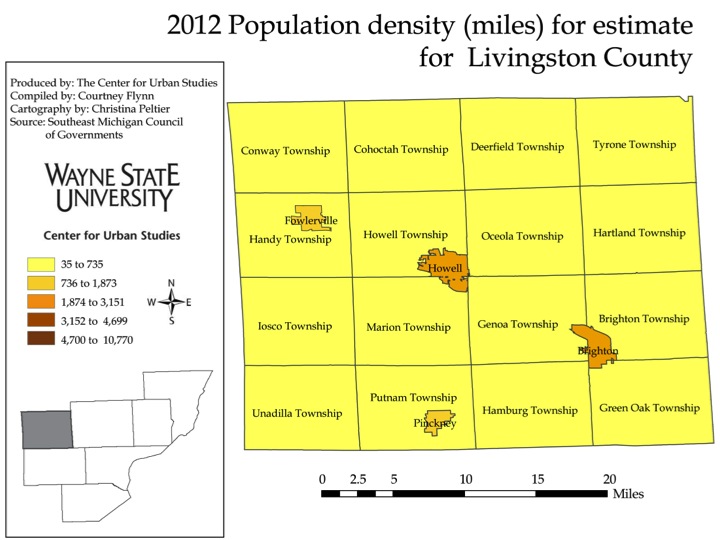
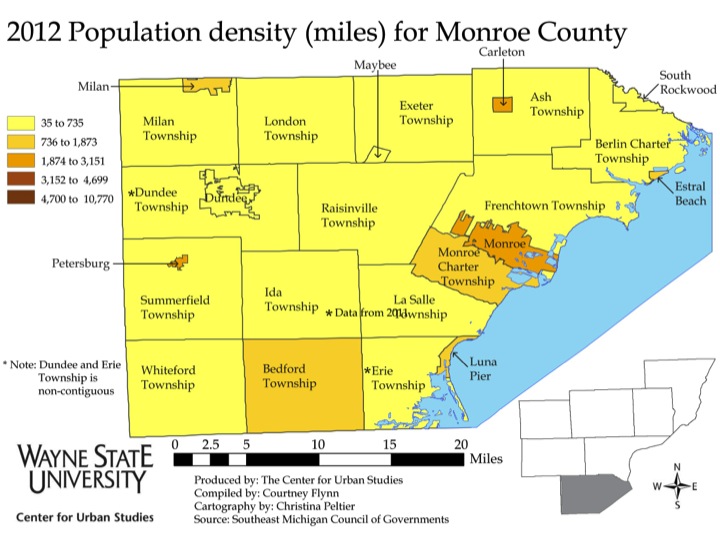
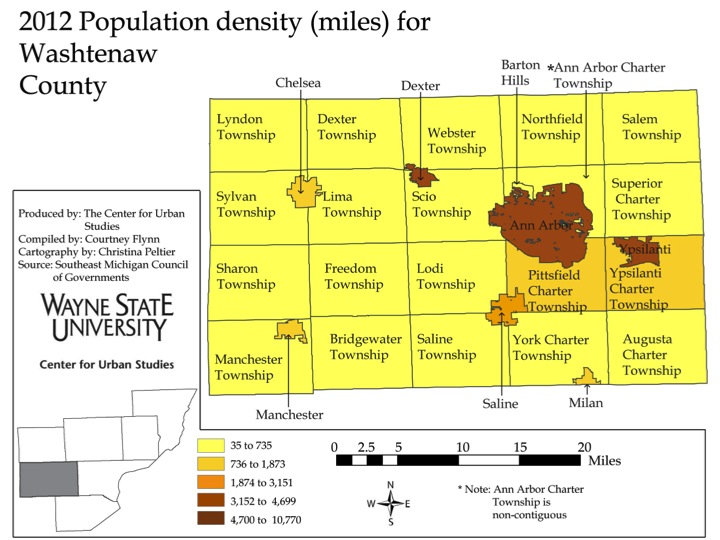
In a previous post, we examined the population densities in Wayne, Oakland, and Macomb counties. This post examines the population densities for the outlying counties in Southeast Michigan: Livingston, Monroe, St. Clair and Washtenaw.
As can be seen in the map below, the population densities in four outlying counties are much lower than those in Wayne, Macomb and Oakland counties.
The data used for these maps came from the Southeast Michigan Council of Governments (SEMCOG) December 2012 population estimates, which are the most recent available. To calculate the population density, each municipality’s population was divided by its square mileage.
There are no municipalities in the outlying counties in Southeast with a population density categorized in the highest bracket (4,700 to 10,770 residents per square mile) and only three municipalities in the second highest bracket (3,152 to 4,699 residents per square mile): Port Huron in St. Clair County and Ann Arbor and Ypsilanti in Washtenaw County. Ypsilanti has the highest population density of all the communities presented in this post with 4,296 residents per square mile. In contrast, neither Livingston nor Monroe have any municipalities with a population density above 3,151 residents per square mile(the maximum density for the middle bracket).
Detroit and surrounding communities have highest population density
In this post we will examine the population density for the Southeast Michigan region as a whole, as well as the population density of each municipality within each county in the region. The first map shows the population density of the entire region by county, is presented in a different color because the data represents a larger region.
Population density is described as a measurement of population per area or unit volume; for this post population density is examined per square mile.
Overall, according to the maps below, Wayne County, as a whole, has the highest population density of the counties being examined. It can also be seen that the City of Detroit and the surrounding communities have the highest population density; not all the surrounding communities are in Wayne County.
The data used for these maps came from the Southeast Michigan Council of Governments (SEMCOG) December 2012 population estimates. We use the SEMCOG estimates for 2012 because they are the most recent available. That data was then divided by each municipality’s square mileage to determine the population density per square mile.
Of the three counties represented above, Oakland County has the highest number of municipalities with a population density ranging from 4,700 to 10,770 (this is the highest category, displayed in dark brown), although all of these are relatively small. These municipalities are: Berkeley (5,840), Clawson (5,840), Ferndale (5,073), Hazel Park (5,882), Keego Harbor (7,657), Oak Park (5,618) and Royal Oak (4,976). Ferndale, Oak Park and Hazel Park, all directly border Detroit, which is the largest municipality in the seven county region. However, even though Detroit is the largest municipality in the region, it does not have the highest population density; the population density for Detroit is 4,792. This still puts the city in the largest population density category, but Lincoln Park, which borders Detroit, has the highest population density in the county, it has been recorded at 6,513. The population density for Dearborn Heights, which also borders Detroit and is in the highest category, is recorded at 4,929; Wyandotte has a population density of 3,632. In Macomb County, with the exception of Center Line and Roseville, the municipalities with the highest population density also border Detroit. These municipalities are St. Clair Shores (4,186) and Eastpointe, (6,406). The population density for Roseville has been recorded at 4,793 and for Center Line it is recorded at 4,913.
In next week’s post we will examine the population density for the remainder of the Southeast Michigan region. The post will focus on Livingston, Monroe, St. Clair and Washtenaw counties. All of these counties have much lower population density levels than the three counties we examined this week.


