Region’s percentage of Asian residents higher than state average

As we continue to explore what makes up Southeast Michigan’s population we find that those of Asian descent make up a growing proportion of certain communities’ populations. This post examines both the percentage of residents of Asian descent in each community in the region along with their background.

In this post we see that although some counties have an overall higher percentage of Asian residents than others, there are pockets throughout the region with much higher proportions of Asians than what exists in their county or in the region.

Overall, the average percent of Michigan residents with Asian ancestry was 2.4 percent, according to the 2012 5-year estimates of the American Community Survey. In the seven-county region, three of the seven counties are below this average (Monroe, Livingston and St. Clair counties). The county with the highest population of residents of Asian descent in the region was Washtenaw County; 7.9 percent of its indicated an Asian background.

The map above not only shows what percent of residents are of Asian descent in each county, but also what Asian subgroup is most dominant. For example, in Washtenaw and Livingston counties, those of Chinese descent make up the majority of the Asian population. However, in St. Clair County, those of Filipino descent are the most common subgroup; Asian Indian descent is the most common subgroup for the remaining counties and the City of Detroit (Note that this identity may also be selected by those with Bangladeshi or Pakistani backgrounds who often choose this designation).

While the first map showed the most dominant Asian subcultures represented in each county, this map shows what cultures are most represented in each community.

As may have been expected by the first map, those of Asian Indian descent were most heavily represented in Wayne, Oakland and Macomb counties.  However, in the City of Taylor and on Grosse Ile, located in Wayne County, those of Pakistani descent were the most represented. In Pontiac in Oakland County, those of Hmong descent were the most represented Asian subgroup.

The previous maps showcased what Asian subgroups were represented throughout the region and this one shows the percentage of residents of Asian descent in each community. At 19.6 percent, the City of Troy in Oakland County had the highest percent of residents with Asian descent of all the communities in the region. The majority (48.4 percent of Asians) are of an Asian Indian background, followed by Chinese (25.2%) and Koreans (9.3%). Also in Oakland County, the City of Novi has a high percentage of residents of Asian descent; this percentage is 16.5.

The highest proportion of Asian residents in Wayne County was in Hamtramck at 18.9% (second in the region, behind Troy).  Residents identified Asian Indian (1,882) as the predominant subculture, ahead of Bangladeshi (1,664), however, the country of birth for Hamtramck residents during the same period was listed as India for 43 residents, and Bangladesh for 2,928, suggesting that many Bangladeshis may have identified as Asian Indian.

In Washtenaw County, Ann Arbor Township has the highest percent of residents of Asian descent. This percentage is 16.1, majority of whom are Japanese. The city of Ann Arbor’s population is at 14.6 percent, majority of whom are Chinese.

The map above is a dot-density map of Asian subgroups, showing where residents live, instead of the percentage of the population. From this map you can see that while there may be a smaller percentage of the population that is Asian in some areas, the actual number of residents of Asian descent in highly populated areas may be large. There is a large number of Asian residents forming a semi-circle around the north and west of the City of Detroit, and some sub-group patterns arise. Hmong Asians live primarily in Pontiac and along the Macomb and Wayne county borders. Pakistanis form a cohesive presence between the airport and the river. Laotians dominate the New Haven area.

Within Wayne County, in addition to the Pakistanis, Cambodians are prevalent in Garden City and Hmong in Northeast Detroit. The large numbers of Asians in Northwest Wayne demonstrates an eclectic mix of cultures, and is more apparent when viewed with dot-density rather than percentage.

In the Detroit area, the expanse of the Hmong is apparent up the Gratiot Avenue corridor into Macomb beyond Detroit. Various ethnicities have chosen small areas of Detroit to call home, including Filipinos near and in Hazel park, Chinese in west Detroit neighborhoods, Thais near Redford, Pakistanis and Japanese on the East side.

Region’s child population higher than elderly population

The focus of this post is on the percent of children under the age of 18 in the seven-county region. In 2012, according to the American Community Survey, the average percent of children in the state of Michigan was 23.6 percent. This post shows that the percent of children across the region  is higher than the elderly population in the region. Three of the seven counties in Southeastern Michigan had a lower percentage of children than the state average.

Although children under the age of 18 made up 23.6 percent of the state’s population, there were only four counties in the region at or above this threshold. St. Clair was right at the state average, while three counties were above and three below the state average. The three counties with a higher percentage of children were Livingston (25.3%), Wayne (25.3%), and Monroe (24.0%). Washtenaw County had the lowest percent of children under the age 18 (20.7%).

In last week’s post on the elderly population, St. Clair (14.8%) and Macomb (14.4%) counties had the highest population of residents age 65 and above. Washtenaw County had the lowest elderly population at 10.6 percent.

The above map provides a closer look at how the child population is distributed across the region. Livingston County only has one community that has a lower percentage of children than the state average, however, there are few areas with 800 children or more (it should be noted Livingston County has a much lower population than Macomb, Oakland and Wayne counties). As the yellow dots show, there is a high concentration of children in the City of Detroit and the communities surrounding it, such as Warren, Southfield and Dearborn.

In Washtenaw County, the child population is concentrated in the Ann Arbor area. In Macomb County, which had the second lowest percentage of children in the region, the southern part of the county had a high number of children despite having a lower than state average percentage of children.

The above map provides a look at the child population in the City of Detroit. When comparing this map to the Detroit map in the previous post (link) about the elderly population, it can be seen there are several Census tracts where the elderly population is above the state average but the child population is below. Many of these Census tracts are northwest of Highland Park, around Palmer Park, and in the area between Highland Park and Belle Isle.

St. Clair, Macomb counties have highest percent of elderly population

As our population ages, there are many factors that will need to be considered.  As the Baby Boomers reach retirement age and beyond, there are many issues that will need to be discussed and addressed, from housing surpluses to medical care. In order to address these issues, however, we must first understand the size of the elderly population, ages 65 and older.

In this post, we will examine that population in the seven county region for the year 2012. All data was received from the American Community Survey.  According to this data, an average of 13.9% of all residents in the State of Michigan were age 65 and older.

As the above map shows, St. Clair (14.6%) and Macomb (14.4 %) counties have the highest percent of residents age 65 and older in the region. Washtenaw County, which is home to the University of Michigan, has the lowest percent of elderly in the region at, 10.3 percent. Reportedly, in the City of Detroit, 11.5 percent of the population is aged 65 or older.

This map shows that, overall, a majority of communities in the region had less residents aged 65 and older than the state average of 13.9%. The yellow dots depict concentrations where there are 200 or more residents are age 65 and older. While the City of Detroit is lower than the state average (11.54%),  the size of the population means that there are still a large number of residents within the city limits or nearby who are aging and may need additional services, such as transportation to health facilities and senior activity centers. There are about 20 communities outside of Wayne County, and southern Oakland and Macomb counties, where the percent of residents age 65 or older is above the state average, including areas near the Ohio border and along Lake St. Clair.

This map sheds additional light on Detroit’s elderly population. The yellow dots depict concentrations of 200 people aged 65 or above. While there are dozens of such areas with such a presence of the elderly population, there are four concentrated areas in the city where the elderly population resides, and comprises a higher proportion than the state average. These areas, colored in red, are located in clusters between the city’s border and Highland Park (which also has a significant elderly population), and on the near East side.


Population continues to grow for those with Mexican ancestry

The first residents of Michigan with Mexican ancestry arrived in the early 20th Century as recruited farm labor in the state’s beet fields, or came to Detroit to work in assembly lines (Herrada, 2007). Beets crashed in the early 1920s leading to a farm-to-factory migration of Mexican-Americans from rural Michigan to Detroit, nearly quadrupling the urban population to 15,000 before the Great Depression (Herrada, 2007). Due to the high rates of unemployment during the Great Depression, the City of Detroit, federal government and Mexican government adopted a policy that stated unemployed workers would have to move back to Mexico to live in newly formed agricultural colonies, on marginal land. The urban population dropped to about 1,200. (Herrada, 2007). These residents remained clustered in Southwest Detroit near Holy Trinity Catholic Church. In the 1940s though, a federal effort was made to bring in labor from Mexico to work on Detroit wartime industries (Alvarado & Alvarado, 2003).

As in many part of the United States, the number of Mexican immigrants grew in the post-War years. A number of service, political, cultural and religious organizations focused on Latino – and predominantly Mexican American — causes and interests began to flourish in Southwest Detroit and Pontiac in the 1960s and 1970s. Beginning in 1970s, Mexican American communities formed in into other neighborhoods in Detroit, including the area around Greenfield and Grand River as well as the North End area, west of Woodward . The population also grew in Redford and Plymouth (Wayne County),Monroe Monroe County, Ypsilanti (Washtenaw County), Capac (St. Clair County); and Hartland (Livingston County) (Alvarado & Alvarado, 2003).

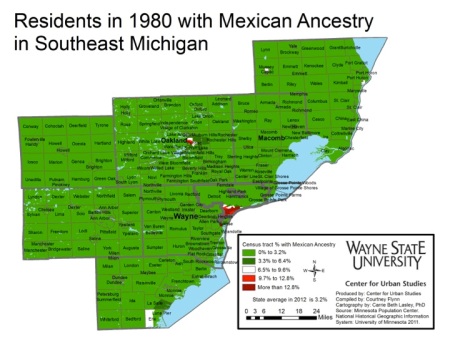
Many of those clusters were still present in 1980. The 1980 Census reported more than 130,000 residents in Southeast Michigan claiming Mexican ancestry. More than 72,000 were in Wayne County, followed by Oakland County with 27,000 residents claiming Mexican ancestry. A look at where residents with Mexican ancestry were located in the 1980s shows clusters that had already formed in Southwest Detroit and near Pontiac with smaller clusters in Erie Township in Monroe County and Capac in St. Clair County.

Slide03

Slide04

Slide05

The following chart shows the growth in residents with Mexican ancestry in the region using Census data and the American Community Survey’s 2012 5-year estimates. It shows consistent growth across counties and over time:

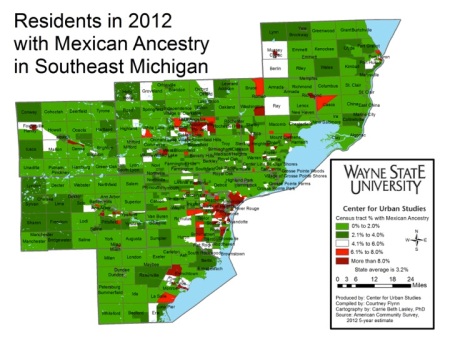
Flashing forward to 2012, the Mexican-American population in the region has nearly tripled since 1980. The Interstate corridors in Livingston and Washtenaw are seeing an influx of residents with Mexican ancestry. Enclaves near Monroe city and Capac have expanded too. In Capac’s case, neighboring Mussey and Berlin townships now exceed the state average. The corridor between Howell and Brighton in Livingston is now 11.6% residents with Mexican ancestry. The outskirts of Ann Arbor have also seen an increase in the proportion of residents with Mexican ancestry.

Slide08

The enclave that began in Pontiac in Oakland County has expanded outward to adjacent areas, such as Auburn Hills and Waterford. There are now 13 Census tracts with more than 10 percent of the population claiming Mexican ancestry.  Areas along the Interstate 75 corridor in Macomb are also seeing a growth in their population with Mexican ancestry, especially in multi-ethnic Sterling Heights and northward.

Slide10

The number of residents claiming Mexican ancestry in the Downriver area of Wayne County has grown proportionally as well. Areas such as Melvindale, Lincoln Pak and Allen Park have Mexican-American populations that exceed 10 percent.

Slide12

Southwest Detroit, often referred to as “Mexicantown” expanded and became more densely Mexican by 2012. Most of the area is comprised of Census blocks with more than 30 percent of the population identifying as having Mexican ancestry. One tract even contains 50.2 percent of residents reporting .

Works Cited

Alvarado, R., & Alvarado, S. (2003). Discovering the Peoples of Michigan: Mexicans and Mexican Americans in Michigan. East Lansing, MI: Michigan State University Press.

Herrada, E. (2007). History of Latinos in Michigan and Detroit. Detroit, MI.http://www.umich.edu/~ac213/student_projects07/repatriados/index.html

A little bit o’ Irish everywhere in Southeast Michigan

This past weekend, hundreds gathered in Detroit’s Corktown neighborhood to celebrate St. Patrick’s Day – a Catholic feast day for Ireland’s most well-known saint and an opportunity to celebrate all things Irish. Held annually on March 17, St. Patrick’s Day has become an opportunity for anyone to claim they are Irish (at least for the day). According to the American Community Survey data presented below, however, only 5.1 to 10 percent of the population in a majority of the communities in Southeast Michigan claimed Irish ancestry in 2011.

IrishSEMICH

Although Corktown once had a large Irish population base many people (exact numbers could not be found) from Ireland relocated to that part of Detroit during the Irish potato famine in the mid-1800s). Today though, the Irish population in Corktown has diminished and the entire City of Detroit itself does not have a particularly large Irish-ancestry population. According to the 2011 American Community Survey, those with Irish ancestry made up 5 percent or less of the city’s population in 2011.

As the map shows, in 2011, the percent of the population claiming Irish ancestry in a majority of the communities (insert number) in Southeast Michigan was between 5.1 and 10 percent. Fewer communities (12) had between 10.1 and 15 percent of the population make such claims, and even fewer (8) had over 15.1 percent.

Grandparents caring for grandchildren high in Detroit

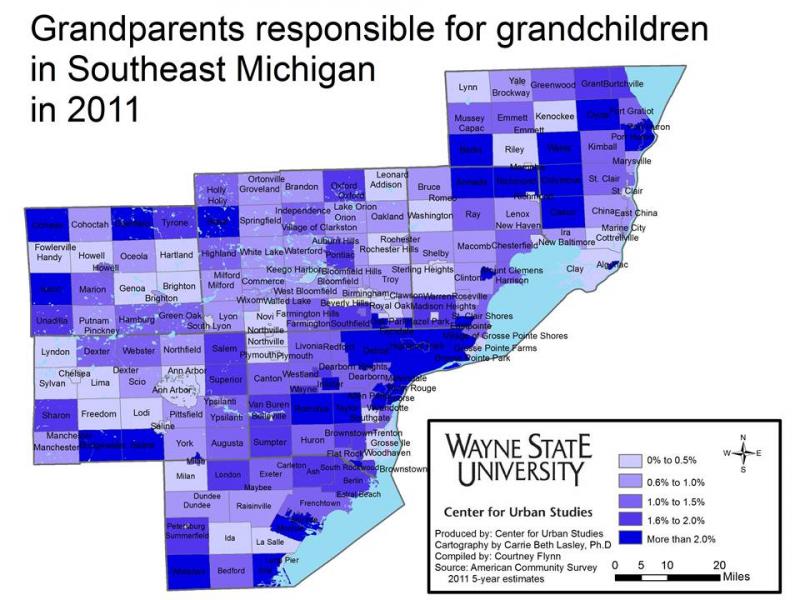
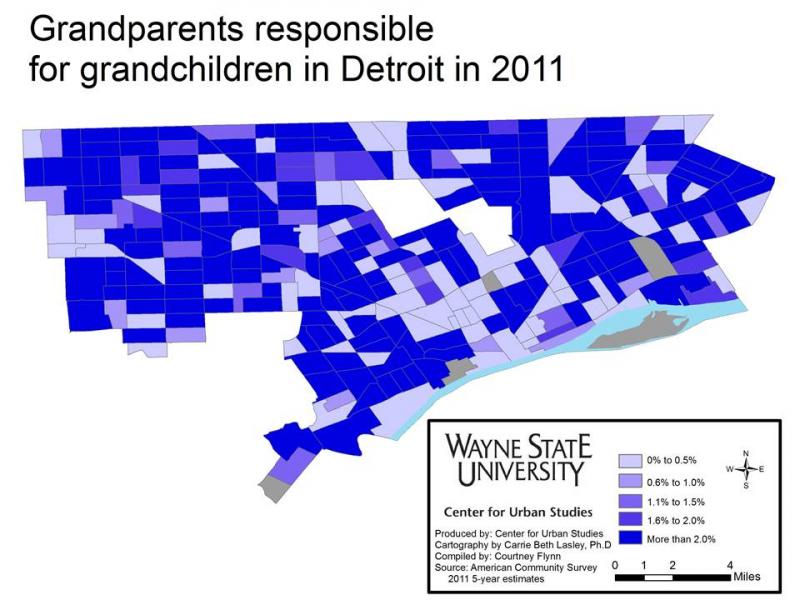
In the last post we explored the makeup of family households in the seven county region. For this post, we will break that information down even further and look at how many households in the area are led by grandparents who assume responsibility for their grandchildren that are younger than the age of 18.  In some communities more than 4 percent of the households with children are headed by grandparents.  In Detroit, there are neighborhoods where this number reaches more than 12 percent.

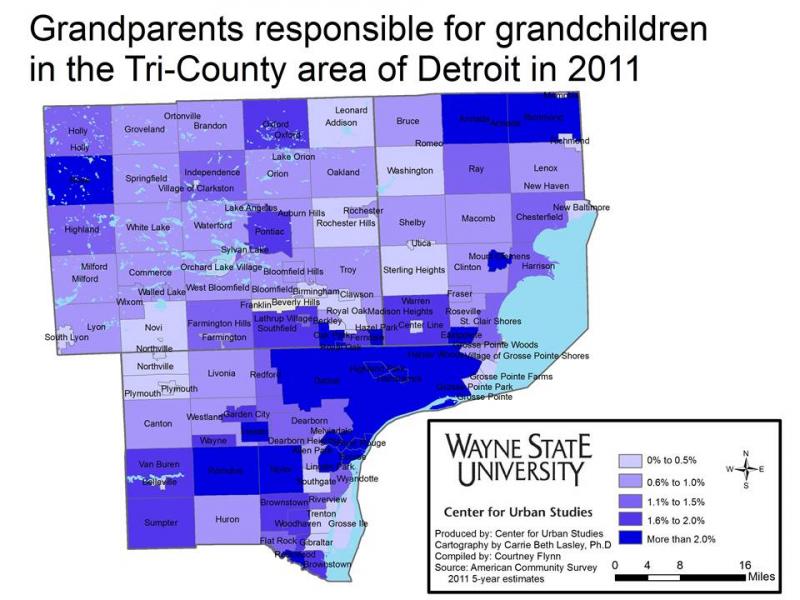
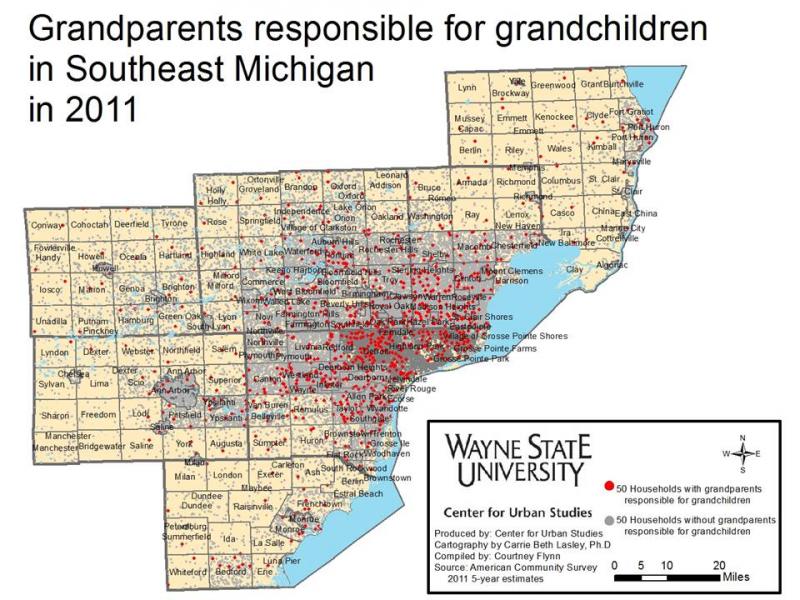
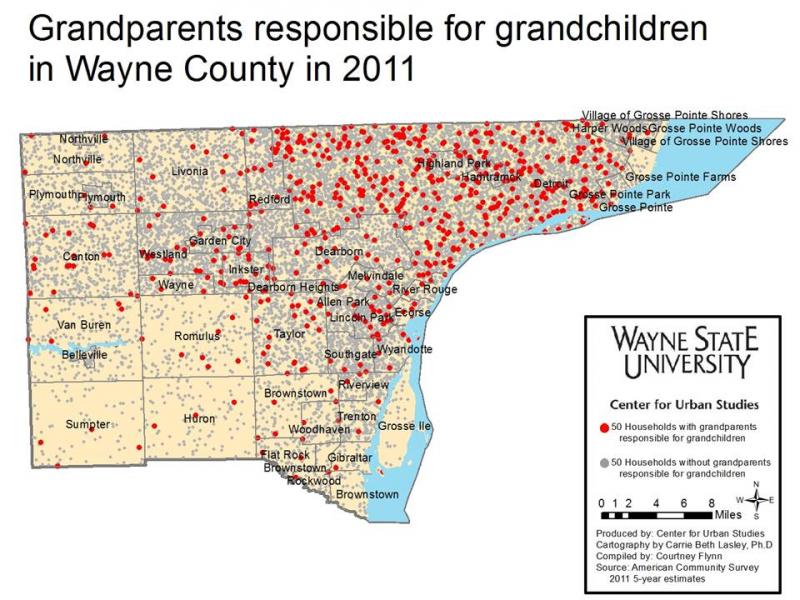
The overall percentage of grandparents responsible for children can be seen in the first three maps, the third focusing on Detroit.  Several communities in Wayne County, like Detroit, Inkster, Romulus and Taylor, have high percentages of grandparent led households. There is also a cluster in Northern Macomb and St. Clair counties. In that area there are eight communities where more than 4 percent of the grandparent population is responsible for their grandchildren; there are 24 total communities where more than 4 percent of the grandparent population is responsible for their grandchildren.

The third map though shows that on a Census tract level, there are about 25 neighborhoods in the city where more than 12 percent of the grandparent population is responsible for their grandchildren.

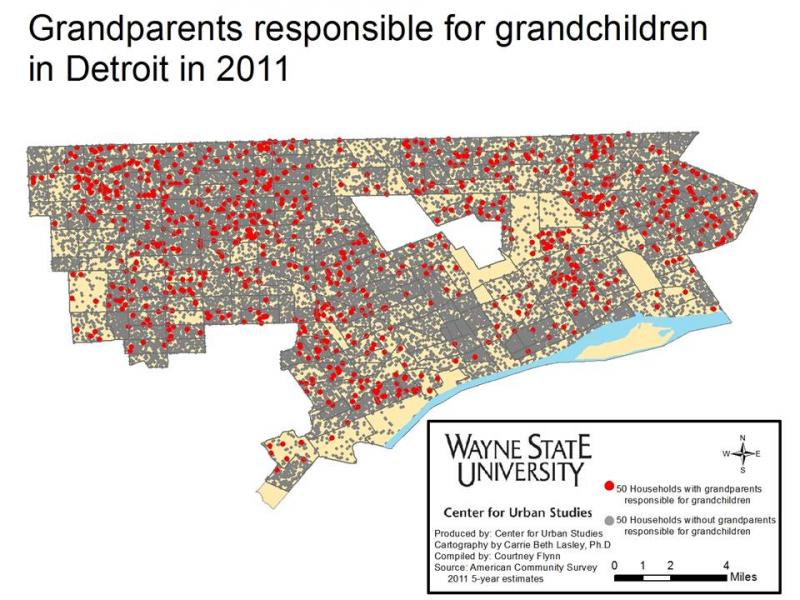
According to the data, about 7.1 percent of Detroit’s population is made up of grandparents, and of that population over 4 percent are responsible for their grandchildren. The fourth through sixth maps show the overall distribution of grandparents in Southeast Michigan, whether they are responsible for their grandchildren or not, are heavily concentrated in and around the City of Detroit.  Although Detroit has the highest concentration of the dark grey and red colors concentrated within its boundaries,  these colors also bleed out into the outer ring suburbs of Wayne, Oakland, and Macomb counties.

Single parent households more concentrated in Wayne County

In this post we examine the type of family households with children, whether they are two parent or single parent. According to the data, there are also thousands of homes in the region where single fathers or mothers take care of the home and children. As the data shows, there are more homes with single mothers than single fathers; these homes are more concentrated in Wayne County. According to data provided by the 2011 American Community Survey, a majority of family  households in Southeastern Michigan do not have any children under 18

According to the U.S. Census Bureau, a family is described as a group of two or more people related by birth, marriage, or adoption who all live together. A family household is described as a household that is maintained by the head of a family and includes people who live in that home who are not related. Non-family households are defined as households where a single person claims head of the household and if there are others living there, they are not related.

The graph above shows the total make up of family v non-family households in the seven county region. As can be seen, family households make up majority of the region, and in that sub-section it is family households without kids that make up  that majority. For family households with kids, that subsection is made up mostly of married families with kids.

The above map shows the percent of two-parent households with children under the age of 18 in each municipality in the seven-county region. Livingston County has seven communities in which 30-40 percent of its households are composed of two parents and children under 18. Washtenaw County has six such communities, and Wayne County has one (Canton). The percentage of families with children under 18 in Wayne County was 29.8. Fewer than 10 percent (9.2) of the households in the City of Detroit were made up of two-parent households with children below the age of 18.

The above map shows the percent of two-parent households with children under the age of 18 in each municipality in the seven-county region. Livingston County has seven communities in which 30-40 percent of its households are composed of two parents and children under 18. Washtenaw County has six such communities, and Wayne County has one (Canton). The percentage of families with children under 18 in Wayne County was 29.8. Fewer than 10 percent (9.2) of the households in the City of Detroit were made up of two-parent households with children below the age of 18.

While Detroit had the smallest percentage of two-parent households with children, it also had one of the highest percentage(s) of family households with children under 18 led by single mothers. According to the data, 16.6 percent of the households in Detroit in 2011 were led by single mothers with children. The City of Inkster topped the list with 18.1 percent of family households being led by single mothers with children, while the City of River Rouge had 16.9 percent and the City of Highland Park had 16.4 percent.

All of these communities are located in Wayne County. Pontiac, in Oakland County, had 14.5 percent of its households led by single mothers with children in 2011.

The data also shows that the percentage of single mother households with children in the region is much higher than the percentage of single father households with children. According to the data, Wayne County had the highest percentage, with 2.4, and Washtenaw County had the lowest, with 1.6 percent. In the tri-county area, Melvindale had the highest percentage of family households led by single fathers at 9.5 percent. In Macomb County, Ray Township was the community with the highest percent at 8.2; in Oakland County it was Pontiac with 7.2 percent.


All the single ladies (and men): Ann Arbor has highest percent of single residents

Singlehood in Ann Arbor and Detroit is quite popular, according to data provided by the 2012 American Community Survey. When comparing the City of Detroit to the other municipalities that make up the seven-county region, Detroit was one of only four municipalities where over 40 percent of females 15 and older have never been married. For males, Detroit was one of 22 municipalities in which more than 40 percent of the male population was single. Given these percentages, however, Detroit was not the city in the seven-county region with the highest percentage of people who have never been married. That distinction belonged to Ann Arbor, where over 50 percent of both the male and female population was single in 2012.

When looking at both the tri-county and seven county region, there were only four municipalities in 2012 where more than 40 percent of the female population, 15 years of age and older, had never been married by 2012. These municipalities were: Ann Arbor, Detroit,  Highland Park and Pontiac. Ann Arbor had the highest percentage of single females at 51.6 percent; Detroit was closely behind at 50.1 percent.  Highland Park came in third at 47.5 percent and Pontiac came in fourth at 42 percent.

When looking at the Southeast Michigan map,  the outlying counties (Livingston, Monroe, St. Clair, and Washtenaw) were predominantly composed of communities where the population of single females ranged from 10 to 20 percent.  Wayne County was the only county in the region where the percent of the single, never married, female population was above 20 percent in all communities.

According the American Community Survey, there were more single males in the City of Detroit in 2012 and in the seven-county region than there were single females. The number of municipalities in the Southeast Michigan region where 40 percent or more of the male population was never married by 2012 is more than double the number of municipalities with the same percentage of single females.

Of the 22 municipalities where more than 40 percent of the male population was single and never married, Ann Arbor had the highest percentage at 58.4 percent. Wayne and Oakland counties both had the highest number of communities (6) where more than 40 percent of the male population was single in 2012. In Wayne County, the City of Highland Park had the highest percentage of men never married at 56.5; the City of River Rouge came in second with 55.3 percent and the City of Detroit came in third with 54.9.

In addition to Washtenaw County having the community with the highest single male population, it also has the highest number of communities where only 10 to 20 percent are single. There are four such communities in Washtenaw County and one in Livingston County.

Economic and Demographic indicators: Detroit’s population up as are home prices

In recent weeks information regarding the increase in Michigan’s population and an estimated decrease of migration out of the state have been published in various news outlets. According to information from the Southeastern Michigan Council of Governments, Detroit’s population has also experienced an increase.

In addition:

•The unemployment rate in Detroit and across the state has been decreasing; (monthly)
•The Purchasing Manager’s Index for Southeast Michigan decreased from November 2013 to December 2013; (monthly)
•The Commodity Price Index experienced a decrease from November 2013 to December 2013 for Southeast Michigan; (monthly)
•Standard and Poor’s Case-Shiller Index show that the prices of homes in the Detroit area have been experiencing an increase; (monthly)
•The number of building permits obtained in Wayne and Oakland Counties decreased from October 2013 to November 2013; (monthly).
Slide02

Overall, the City of Detroit’s population has experienced a decline, going from about 1.5 million residents in 1970 to 677,891 in 2012. However, from 2012 to July 1, 2013 the city has experienced a population increase, according to the Southeastern Michigan Council of Government. SEMCOG estimated in 2012 the city had 677,891 residents, and as of July 1, 2013 the SEMCOG estimate was 681,090 residents. The biannual population estimates from SEMCOG are based on trends from area demographics.

Slide04

According to the most recent data provided by the Michigan Department of Technology, Management and Budget, from October to November of this year the unemployment rate for the State of Michigan has decreased from 9 to 8.8 percent. They estimate the City of Detroit also experienced an unemployment rate decrease. In September the rate was recorded at 16.9 percent and in October it was estimated at 16.2 percent.

Employment numbers for Detroit, and other localities in the State of Michigan, were not available for November because of the government shutdown in October.

Slide06

The number of employed in the City of Detroit decreased by 1,928 people from September to October of 2013. In October there were 287,067 people employed.

Slide08

The above chart shows the number of people employed in auto manufacturing industry in the Detroit Metropolitan Statistical Area throughout 2012 and into 2013. Employment increased in the auto manufacturing and auto parts manufacturing industries from September to October. In September it was reported there were 90,700 people employed in these industries, and in October there were 91,500 employed; this is an increase of 800 employees.

Slide10

The Purchasing Manger’s Index (PMI) is a composite index derived from five indicators of economic activity: new orders, production, employment, supplier deliveries, and inventories. A PMI above 50 means the economy is expanding.

According to the most recent data released on Southeast Michigan’s Purchasing Manager’s Index, there was a decrease of 7.7 points from November 2013 to December 2013. In December 2013, a PMI of 50.6 was recorded, which is reflective a declining in economic expansion because of a reduction in new orders and production.

Slide12

The Commodity Price Index, which is a weighted average of selected commodity prices, was recorded at 52.2 in December 2013, which was 2.2 lower than the previous month.

Slide14Slide15

The above charts show the Standard and Poor’s Case Shiller Home Price Index for the Detroit Metropolitan Statistical Area. The index includes the price for homes that have sold but does not include the price of new home construction, condos, or homes that have been remodeled.

According to the index, the average price of single-family dwellings sold in Metro Detroit was $92,140 in October 2013. This was an increase of approximately $13,420 from the average price in October 2012.

The annual percent change in the Home Price Index showed a slight decrease from the increase the region experienced in July. Between August 2012 and August 2013, there was a 16.34 percent increase in home prices for the Detroit MSA.

Slide17Slide18Slide19

The above charts show the number of residential building permits obtained each month in Wayne, Oakland, and Macomb counties from January 2012 until November 2013. These numbers are reported by local municipalities to the Southeastern Michigan Council of Governments and include single family, two family, attached condo, and multi-family units.

All three counties experienced a decrease in the number of building permits pulled from October to November, consistent with a seasonal decline in home construction. Oakland County experienced the most dramatic decrease in the number of building permits pulled. In October 324 permits were pulled and in November there were 113; this is a decrease of 211. Wayne County experienced a decrease of 61 permits pulled and Macomb County experienced a decrease of 51.

In addition to Oakland County experiencing the most dramatic decrease, it was the only county that had fewer permits pulled in November 2013 than November 2012.