Monroe, St. Clair Counties Rank Highest for Green Infrastructure; Majority is Agricultural Land

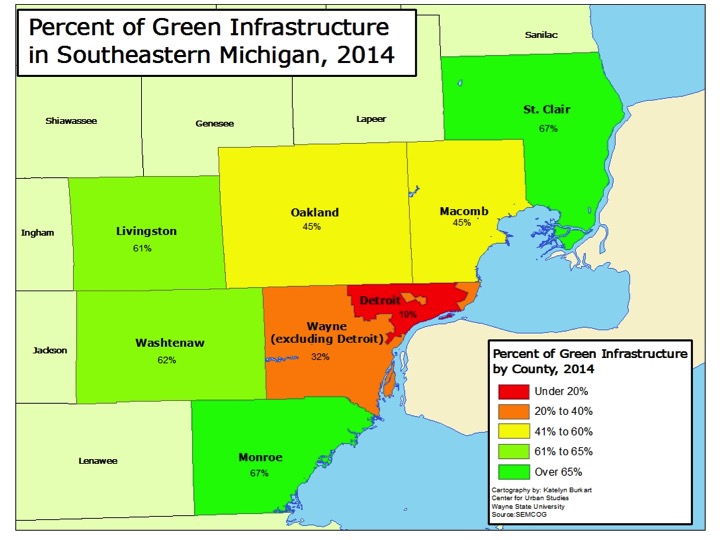
In Southeastern Michigan there was about 180,000 acres of green infrastructure in 2014, according to the Southeastern Michigan Council of Governments (SEMCOG), and the regional planning agency is looking to improve and grow that number. This green infrastructure represents both natural ecosystems (wetlands, forests and parks), agricultural land and constructed versions, such as community gardens and bioswales. Both Monroe and St. Clair counties had the highest percentage of total green infrastructure in 2014 at 67 percent. Wayne County, both including and excluding Detroit, had the lowest percentage of green infrastructure. Excluding Detroit, Wayne County was made up of 32 percent of green infrastructure; including Detroit Wayne County was made up of 30 percent green infrastructure. In general, one can think of green infrastructure as the inverse of developed land, where houses, businesses, roads and other infrastructure exists.

Of this overall green infrastructure it is important to identify what it is comprised of. Below we will see how the tree canopy varies from county to county and how these variations are affected by the presence of parks and agricultural land.

The data provided for this post was found in SEMCOG’s 2014 Green Infrastructure Vision document.

Metro-Detroit Green Infrastructure

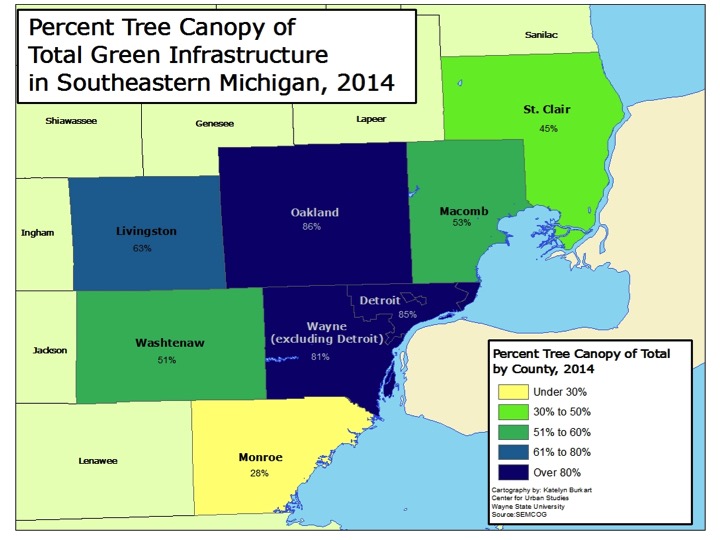
In total, Oakland County had the highest percentage of overall tree canopy at 44 percent; the county’s tree canopy made up 86 percent of its total green infrastructure. Oakland and Livingston counties were the only two in the region that had a tree canopy above the American Forest’s overall standard of 40 percent. The American Forest is the country’s oldest conservation non-profit, and SEMCOG bases its green infrastructure goals on their standards.

The county with the lowest overall tree canopy was Monroe; it had a tree canopy of 20 percent. This 20 percent of total tree canopy made up 28 percent of its total green infrastructure. This is largely because of the greater portion of land devoted to agriculture, as discussed below.

The city of Detroit had a total tree canopy of 16 percent, which is below American Forest’s standard for tree coverage in an urban area. Nevertheless this represents 85 percent of Detroit’s green infrastructure. American Forest calls for a 25 percent tree canopy coverage in an urban area. In a suburban residential the organization’s standard is 50 percent, and in a central business district that standard is 15 percent.

Metro-Detroit Tree Canopy

Metro-Detroit Tree Canopy and Green Infrastructure

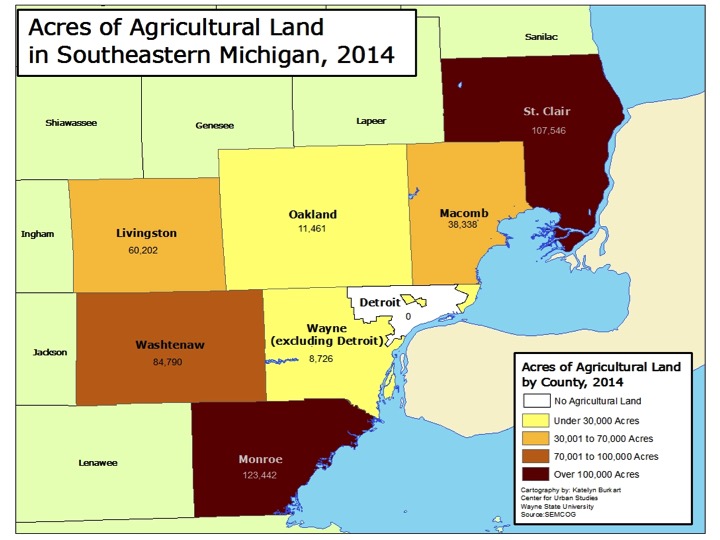
While tree coverage is an important aspect of green infrastructure, it is not the only thing that can make a community “more green.” As discussed above, Monroe County had the highest percentage of overall green infrastructure yet the lowest percentage of tree canopy coverage. As shown below, this is, in part, because there was more than 123,000 acres of agricultural land in Monroe County in 2014. Monroe County had the highest amount of agricultural land in 2014 in the region followed by St. Clair County, which had about 107,000 acres of agricultural land. St. Clair County, like Monroe County, was made up of 67 percent green infrastructure. According to SEMCOG, Monroe County ranks seventh in the state in the total number of acres of vegetables (6,707) and corn, soy and wheat (169,792). St. Clair County ranked sixth in the state in the number of farms producing organic products and eighth in state for the total number of acres of soybeans it produced in 2014 (64,224).

According to SEMCOG, agricultural land is defined as “rural land used with the growing of food as the primary function, but can also provide ecological benefits.” SEMCOG classified Detroit as having 0 acres of agriculture, but this does not include the number of community gardens, which have been growing in the city through individual and organizational efforts.

While Detroit had 0 acres of agriculture land, Wayne County had 8,726 acres of agricultural land, which was the smallest amount in the region.

Metro-Detroit Agriculture Land

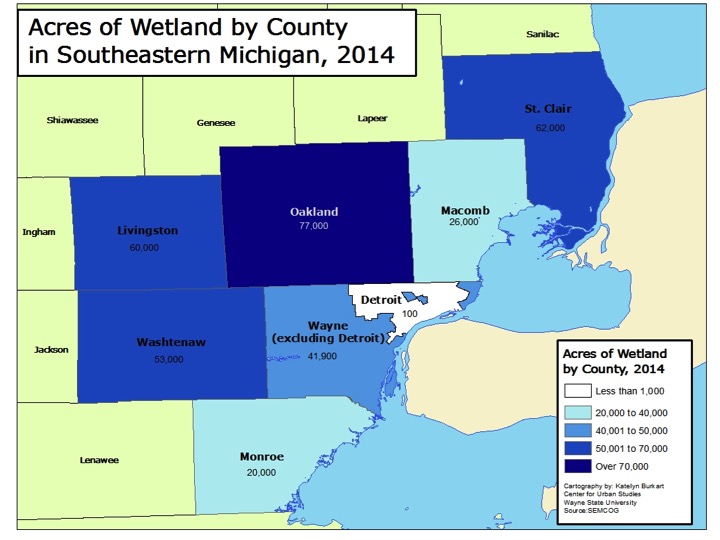
For total acreage of agricultural land in the region, Oakland County had amongst the smallest amount of coverage in the region but for wetland coverage it had the greatest amount. Oakland County had 77,000 acres of wetland in 2014. St. Clair (62,000 acres), Livingston (60,000) and Washtenaw (53,000) counties all had more wetland coverage than Wayne County. However, the 41,900 acres of wetland coverage in Wayne County was nearly five times the amount of agricultural land in the county. Additionally, of those 41,900 acres, 100 were located in Detroit.

Monroe County had the least amount of wetland coverage at 20,000, which is about 100,000 less acreage than it had of agricultural land.

Metro-Detroit Wetlands

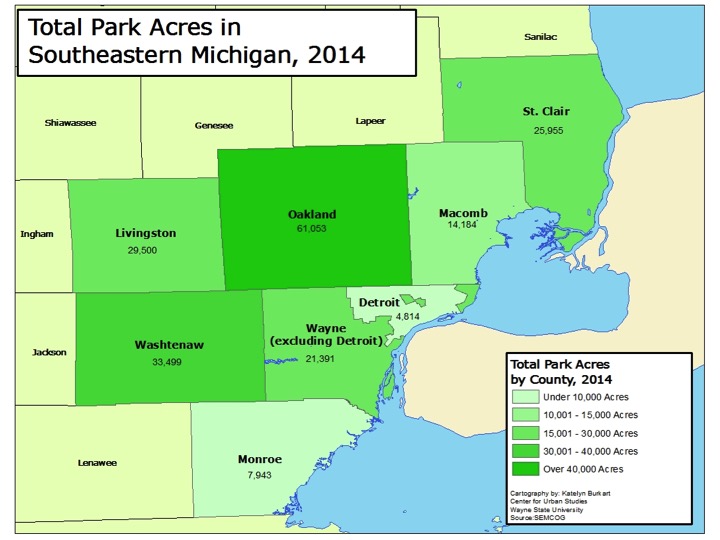
Another factor into the total amount of green infrastructure present in a county is park land, which includes city, country, metro and state parks. Oakland County had the highest amount of park acreage at 61,053. Oakland County is home to five state park/recreation areas, three metroparks, 13 county parks and numerous local parks at the municipal level. Washtenaw County had the second highest acreage of park coverage at 33,499 acres, which was nearly half of Oakland County’s coverage. Like Oakland County, Washtenaw County is home to three metroparks and 13 county parks. Washtenaw County also has 20 nature preserves, numerous parks at the local level and nine state park/recreation areas.

Wayne County had about 26,000 acres of total park acreage, about 5,000 of which was located in Detroit. Belle Isle made up nearly a fifth of Detroit’s park acreage; it is 982 acres.

Metro-Detroit Parks

The amount of green infrastructure established in a community and a region is important because it can not only serve as a catalyst for economic growth but also because it serves as the base for ensuring citizens have access to clean water and air, fresh food and amenities that promote healthy and sustainable lifestyles. There is a recognition that additional green infrastructure is needed in Southeastern Michigan, which is why SEMCOG has created a green infrastructure vision. This vision aims to benchmark the current green infrastructure in the region and then identify policies that will allow for stronger and more connected infrastructure networks, more accessibility and cleaner air and water quality.
Southeastern Michigan Anticipating Water Rate Increases

With the proposed wholesale water rate changes for the newly formed Great Lakes Water Authority (GLWA)-which now provides water and sewer services to 127 former Detroit Water and Sewer Department (DWSD) customers-only one of the 89 tri-county customers is expected to experience a rate decrease above 10 percent. That community is the city of Novi and the anticipated decrease between 2016 and 2017 is 23.7 percent. The only other government entities expected to experience a decrease are Bruce Township, the city of Warren and the Southern Oakland County Water Authority (which is made up of Royal Oak, Berkley, Clawson, Huntington Woods, Pleasant Ridge, Southfield, Beverly Hills, Lathrup Village, and Bingham Farms). The reason for Novi’s expected wholesale water rate decrease is because of a water reservoir that went online in the city in July of 2015. This reservoir allows the city to hold up to 1.5 million gallons of water; it is filled nightly when demand and costs are lower and discharged at peak hours during the day, according to the Hometown Life article.

While wholesale rate decreases are expected to occur for a select few communities, wholesale rate increases are anticipated to be the norm for the region. The overall average wholesale rate increase for the region is expected to be about 6.1 percent, but Royal Oak Township’s expected increase is estimated to be about 20 percent. New Haven and Romeo were the only other two government entities in the GLWA that are expected to experience a wholesale water rate increase above 10 percent. New Haven is expected to experience an increase of about 14 percent, and Romeo is expected to have an increase of about 12 percent.

Charges for water service are a combination of a monthly fixed cost (which are associated with infrastructure costs) and metered usage. According to an interview the Detroit News held with the GLWA, monthly fixed costs make up about 60 percent of what the GLWA charges a community, and the remainder is metered usage. At the time of this post it is unclear why fixed costs vary so vastly from one government entity to another. However, this is a question Drawing Detroit will be further investigating.

GLWA

GLWA Rate Change

While both Novi and Bruce Township are expected to have wholesale rate decreases, they are two of 22 communities in the GLWA that had 2016 commodity costs above $10 per million cubic feet (mcf). Bruce Township had the highest commodity price per mcf of all the GLWA customers at $22.82 per mcf. Additionally, the township’s fixed wholesale monthly cost was $2,200 in 2016. In 2017 that fixed monthly cost is expected to increase to $2,300, and the commodity price is expected to be $21.44 per mcf. This represents a 6 percent wholesale rate decrease. For Novi, the 2016 cost per mcf is $16.99 with a fixed monthly cost of $560,000; for 2017 those numbers are expected to decrease to $12.96 per mcf and $475,000, respectively.

Royal Oak Township, which is expecting a 20 percent rate increase, has a current commodity cost per mcf of $6.85 and a fixed monthly cost of $10,300. Those numbers are expected to be $8.23 per mcf and $12,400, respectively.

As noted throughout this post, the 2017 rates and costs discussed here are expected; the GLWA has yet to vote on the regional rates and costs. The vote is expected to come in the coming weeks though so the wholesale rates and fixed costs can become effective on July 1, 2016. The proposed figures used for this post were made public by the GLWA in March of 2016.

Additionally, while wholesale rates were discussed in this post, each individual community has the opportunity to set water rates above the wholesale rates set by the GLWA. These rates are known as the retail rates and are ultimately what the customers pay.

GLWA Commodity Costs

GLWA Fixed Costs

The city of Detroit was not included in this post because when the GLWA was formed the city of Detroit was able to maintain operations of its water and sewer infrastructure. DWSD still legally owns the water and sewer infrastructure it used to service the now GLWA members with, but the creation of this regional authority allows the GLWA to lease water and sewer infrastructure from the city of Detroit for 40 years at a cost of $50 million a year.

U.S. Postal Service: Detroit Vacancy Rates Drop by 2,500 between 2014 and 2015

There were 2,540 fewer vacant Detroit residential properties between December 2014 and December 2015, according to the U.S. Postal Service. Between September 2015 and December 2015 the number of residential vacancies decreased by 896. Overall in the month of December of 2015 there were 80,077 vacant residential addresses, which is equivalent to a 22.4 percent residential vacancy rate, according to the U.S. Postal Service. Also for December 2015 the total number of residential addresses decreased by 905 from December 2014 and by 1,163 from September 2015.

In addition to a decrease in the number of vacant addresses in the city of Detroit in December of 2015 there was also a decline in the number of “no stat” addresses; that number decreased by 786. Mail carriers denote properties as being either “vacant” or “no-stat.” Carriers on urban routes mark a property as vacant once no resident has collected mail for 90 days. Addresses are classified as “no-stat” for a variety of reasons. Addresses in rural areas that appear to be vacant for 90 days are labeled no-stat. So are addresses for properties that are still under construction, and urban addresses that the carrier decides are unlikely to be occupied again any time soon — meaning that both areas of high growth and severe decline may be labeled no-stat.


Slide3


Slide4

Slide5

Part III: Metro-Detroit Region Working Toward Wide Spread Transit

In our last two posts we discussed several regional authorities that governments and voters in Southeast Michigan have approved, especially in the wake of Detroit’s financial problems. In this post, we will consider regional efforts to coordinate and fund mass transportation in the area. Transportation planning in Metro-Detroit has long been a fragmented issue. Currently, the Regional Transportation Authority (RTA), which was created through Public Act 387 of 2012, is placing the finishing touches on its Regional Master Plan. This plan is to include main transportation routes along Woodward, Gratiot and Michigan avenues, along with connector lines going east to west throughout Wayne, Oakland, Macomb and Washtenaw counties. It is these four counties that the RTA encompasses and, in order to have sufficient funding for a robust regional transportation system, the RTA is expected to put a ballot initiative before the voters of these four counties (Detroit included) asking for a yet-to-be-determined amount of funding through a millage. According to Public Act 387 of 2012, the RTA can receive money through voter approved millage funding and/or an additional fee that may accompany state driver registration fees. Ballot initiatives can only be placed on ballots during presidential or gubernatorial elections.

Decisions on how and when to seek public funding are made through the RTA’s Board of Directors. This is a 10-member Board, with each Board member serving three-year terms. The County Executives of Wayne, Oakland and Macomb counties each appoint two board members, the Chair of the Washtenaw County Board of Commissioners appoints two members, the Mayor of Detroit appoints one member and the Governor appoints one member. The Governor’s appointee serves as chair but does not vote, according to the RTA’s website.

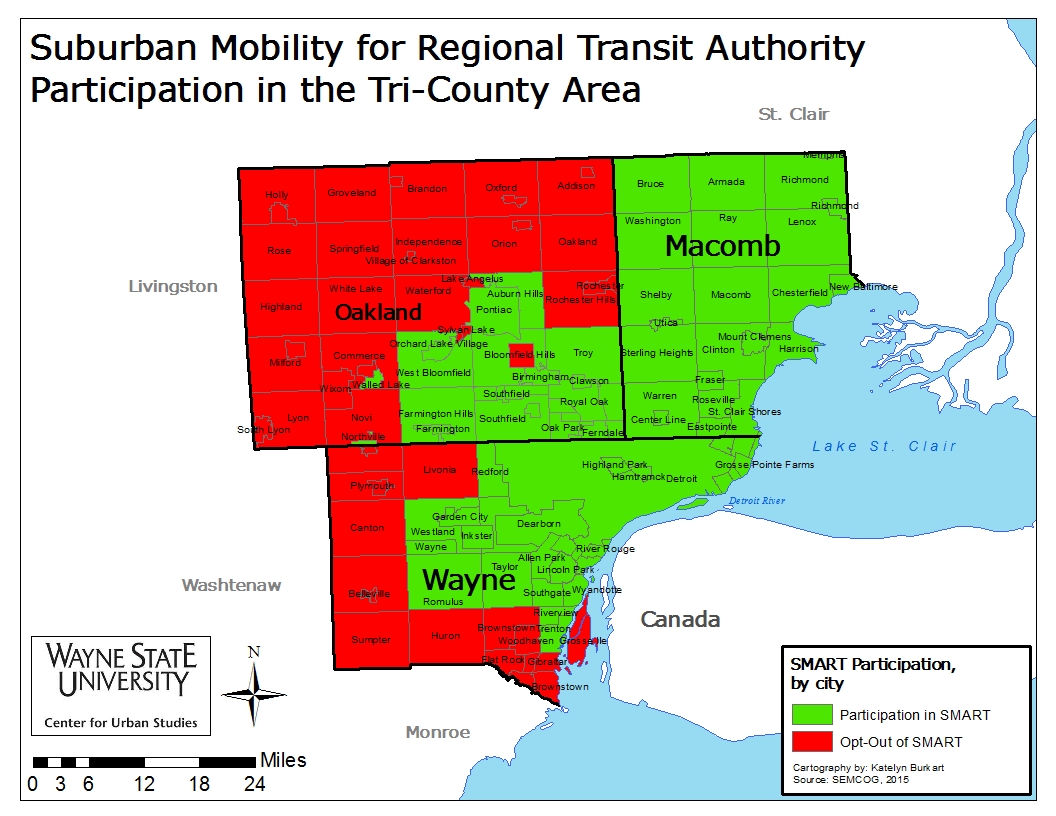
Prior to the establishment of the RTA, the Suburban Mobility Authority for Regional Transit (SMART) was created in 1967, and it still operates in portions of Wayne, Oakland and Macomb counties. Up until recently, SMART did not coordinate with the Detroit Department of Transportation (DDOT), and because of the way SMART initiatives can be placed on the county ballots (by individual counties), Macomb County is the only county in which all communities support the suburban transit authority and are all thereby affected by the authority’s ballot initiatives. In Oakland and Wayne counties, communities have the option to “opt-out” of supporting the authority.

The percentage of opt-out communities as of February 2015 was as follows:

  • Wayne County: 38.6%
  • Oakland County: 57.6%
  • Macomb County: 0%

source

SMARTBus

Most recently, the County Board of Commissioners in Wayne, Oakland and Macomb counties placed a 4-year 1 mill request for the Suburban Mobility Authority for Regional Transit (SMART) on the ballot in August of 2014. The 1 mill request, which included an increase from the original 0.59 mills, was approved throughout the tri-county region as follows:

  • Wayne County: 63.45% yes
  • Oakland County: 73.6% yes
  • Macomb County: 59.6% yes


While SMART, RTA, DDOT and the Ann Arbor Transportation Authority (AATA) are now expected to coordinate with one another, it has taken about 100 years for the region to develop even a semblance of a coordinated regional transit system.


Starting with streetcars in the early 1900s, Southeastern Michigan once had the largest transportation system in the country, according to Tobi Voigt of the Detroit Historical Society in a 2015 Detroit Free Press article. Although the streetcars were once nearly all privately owned, in 1922 the voters of Detroit voted to buy the streetcars, lines and all other materials that made them operational at a cost of $19.8 million. Having bought an aging system, and then with the Great Depression and World War II, the once vibrant streetcar system could no longer be maintained with the funds the city had. The aging infrastructure, however, did not deter people from using the system. According to Voigt, during World War II ridership actually doubled because of widespread difficulty in obtaining gas, tires and vehicles during World War II.


While World War II meant increased ridership, post-World War II meant the beginning of a more developed highway system and more wealth to afford vehicles. These societal changes lead to the retirement of Detroit’s last streetcar on April 8, 1956.


Following streetcars came busses, a mode of transportation still used today. Similar to today’s operations, the DDOT (formerly the Detroit Department of Street Railways) attempted to coordinate with a regional entity—then called the Southeastern Michigan Transportation Authority (SEMTA). Created by the Michigan Legislature in 1967, SEMTA was intended to provide service to the seven county region. However, SEMTA did not have the authority to ask voters for operating funds. This, combined with decreasing ridership and President Ronald Reagan’s decision to cut federal funding to regional transit authorities in 1985, caused SEMTA to cut down to bare bones operations. By 1989, SEMTA became SMART, an authority with the power to seek millage funding.


With its 2012 creation, the RTA is now the entity charged with coordinating and planning for public transportation in Wayne, Oakland, Macomb and Washtenaw counties; applying for state and federal transportation dollars; and dispersing those dollars to the appropriate entities.


Despite the RTA’s status as the “official” regional transportation authority, collaboration between it, SMART, DDOT and the AATA is expected to take place so truly robust, connected and coordinated system can exist.


Regionalism never strongly existed in the Metro-Detroit area until the financial downfall of Detroit began, and even though we are now seeing a surge in regional coordination, the coordination between those regional entities remains fragmented.


Part II: Regional Water Authority Sets Terms for the Next 40 Years

In our last post, we examined some of the regional authorities in Southeast Michigan. In this post we will continue that discussion by considering the Great Lakes Water Authority (GLWA). Like the Detroit Zoo Authorities, the Detroit Regional Convention Facility Authority, and the Detroit Institute of Arts authorities, the GLWA is a regional entity created in response to Detroit’s financial crisis. In October of 2014, the GLWA was approved by Wayne, Oakland and Macomb counties’ Board of Commissioners and on Jan. 1, 2016 the regional authority became fully operational. In addition to creating the authority, the county boards’ approval allowed the GLWA to lease water and sewer infrastructure from the city of Detroit for 40 years at a cost of $50 million a year. The GLWA is made up of six members: two appointed by the Mayor of Detroit, one each by Wayne, Oakland, and Macomb counties, and one by the Governor from the service area outside the three counties. A county can leave the authority if it meets the criteria below:

    • Two-third majority vote by the Board of Commissioners to leave
    • Unanimous vote by GLWA, excluding the county wishing to leave
    • Payment of all financial obligations
    • Water and Sewer services may continue via contract

While the GLWA has no tax power, it does have bonding power, according to its articles of incorporation. This power provides the regional entity the ability to bond for improvements to the water/sewer infrastructure within its service area. Debt service for improvements to the city of Detroit’s system is the responsibility of the city though, according to the articles of incorporation. The lease money paid to the city though can be used for water and sewer improvements on Detroit Water and Sewer Department (DWSD) infrastructure.

The approval of the GLWA also means that all former DSWD wholesale customers (127, 75% of which are in the tri-county area), with the exception of the city of Detroit, are now customers of the Great Lakes Water Authority, according to a statement released by the authority. While other water authorities/commissions are highlighted in the map below, these too are connected into the GLWA system.
The Detroit/GLWA system consists of:

  • 640 miles of large water and sewer pipes
  • Five water treatment facilities
  • One major sewage treatment plant

Within this system, Detroit is to remain in control of its 3,000 miles of local sewer pipes and 3,400 miles of local water mains serving the neighborhoods of Detroit.

In addition, of the 1,400 DWSD employees, about 900 employees are to become GLWA employees, according to the GLWA Articles of Incorporation.

DetroitWater

Detroit’s housing costs increasing faster than incomes

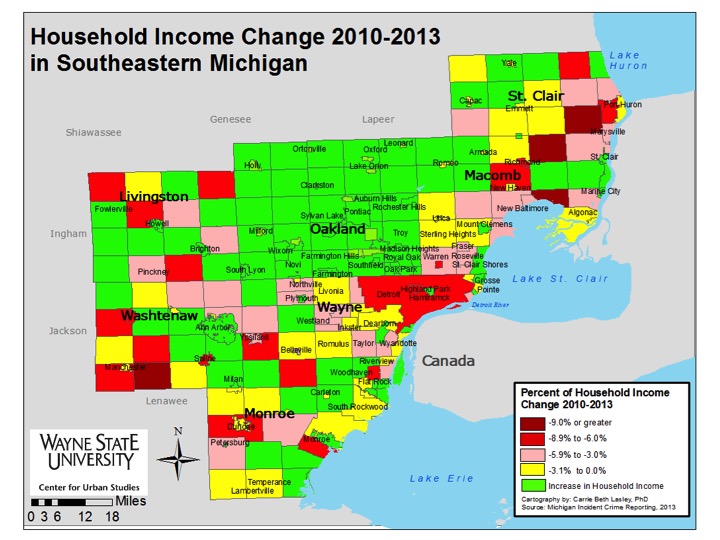
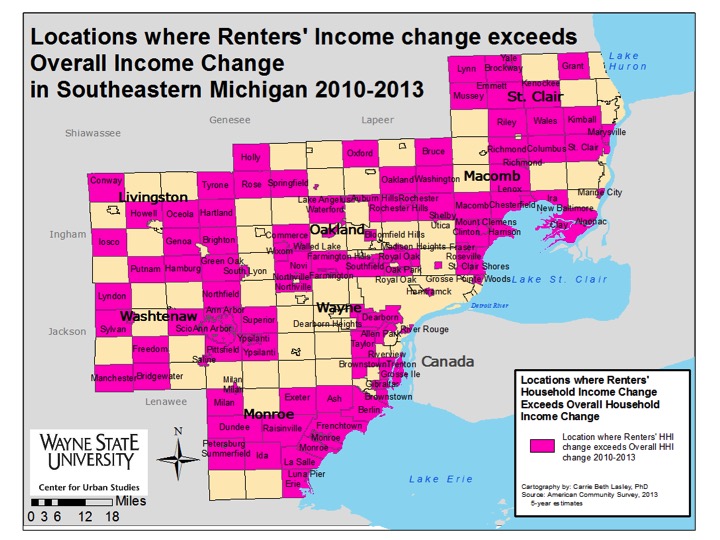
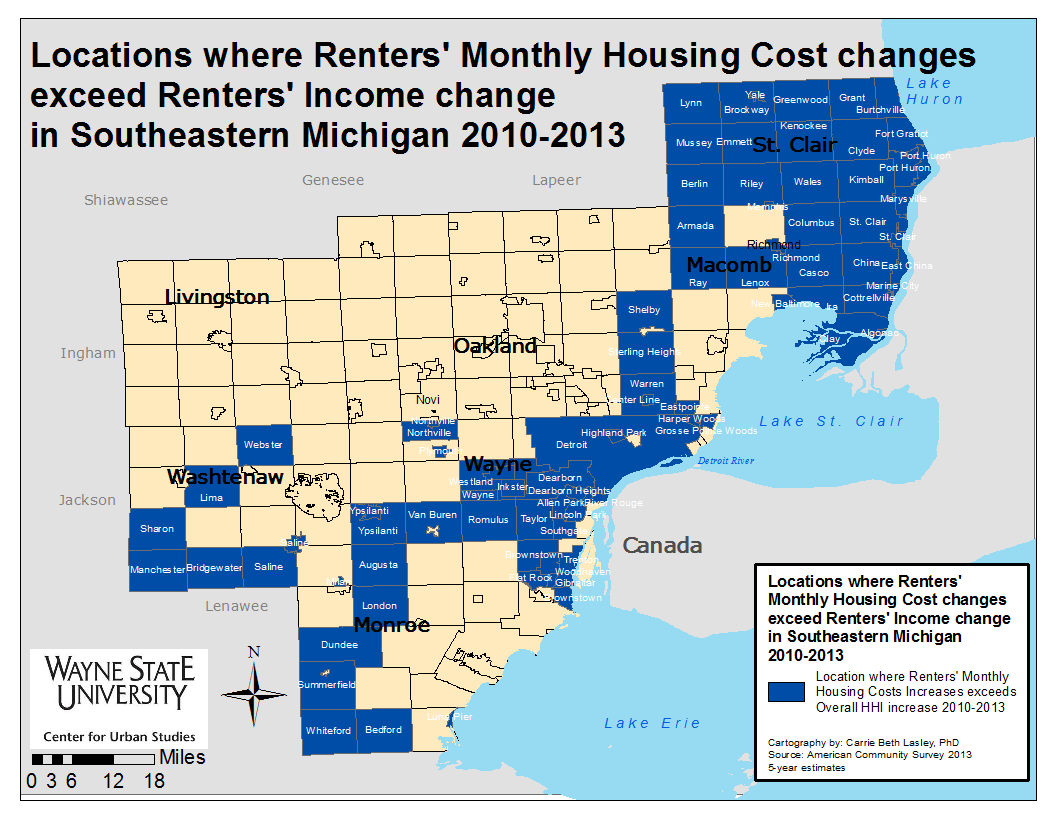
Throughout Southeastern Michigan monthly housing costs for renters are increasing generally faster than their monthly household incomes, which in many cases are actually declining, according to data from the American Community Survey. Even in areas where the renters’ incomes improvements exceeded the change in overall regional housing costs between 2010 and 2013, monthly housing costs continued to increase at a rapid pace. There were areas in the region though, particularly Oakland County, where monthly housing cost increases stayed below the monthly household income increases. However, Detroit’s overall housing costs generally increased at a faster pace than the monthly income changes (largely declines) of residents.
Slide03


Slide04

Between 2010 and 2013 all Oakland County communities experienced an increase in household income while many communities throughout the rest of Southeastern Michigan continued to experience a decrease in their household income. St. Clair County had the most communities where the household income decreased more than 9 percent (three-Columbus, Ira and Kimball townships) between 2010 and 2013; the only other county where a community had such an income decrease was Washtenaw with Bridgewater Township.

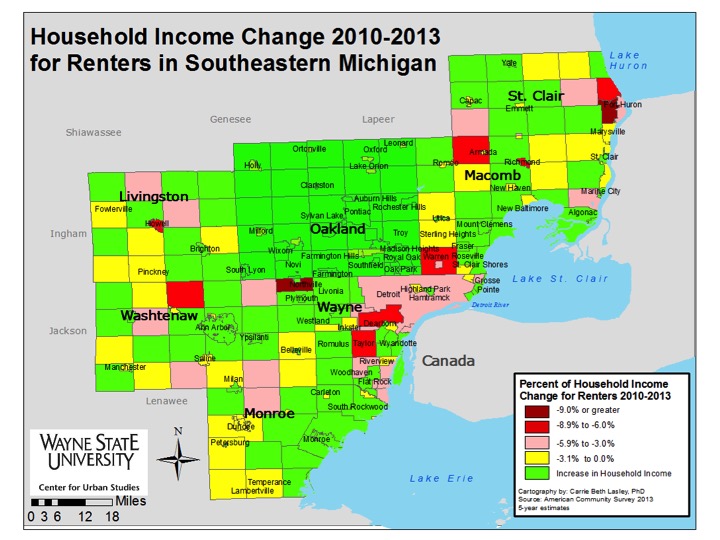
When just looking at renter’s income change between 2010 and 2013 we see that there were fewer households that experienced an income decrease and more that saw their incomes increase.

According to Governing.com, Michigan is one of three states that suffers from housing affordability burdens, particularly in the rental realm. Incomes may be increasing throughout the state, but for renters earning minimum wage, those small increases often equate to the increases in monthly housing costs, especially as demand for rental units remains high.

Slide06

RentMoreHHI (1)
Slide08

Despite renters throughout the region experiencing income increases, these increases were not equal to or more than their housing costs in several communities. In St. Clair County all of the communities experienced housing cost changes above those of the renters’ monthly income. This was not unique to just St. Clair County though. Rather every county in the region, with the exception of Livingston and Oakland, had renters whose income changes weren’t keeping up with their housing cost increases. With increases in Oakland County’s renters’ income outpacing their monthly housing cost increases this could mean a number of things, including: rental prices are not increasing as quickly as places such as Detroit or Warren because demand is lower; these renters’ incomes are growing as the economy stabilizes (for places like Ferndale, Royal Oak and Rochester we see their income increases are above that of non-renters) while in areas like Detroit the median household income is lower, income growth can’t keep up with cost of housing increases.

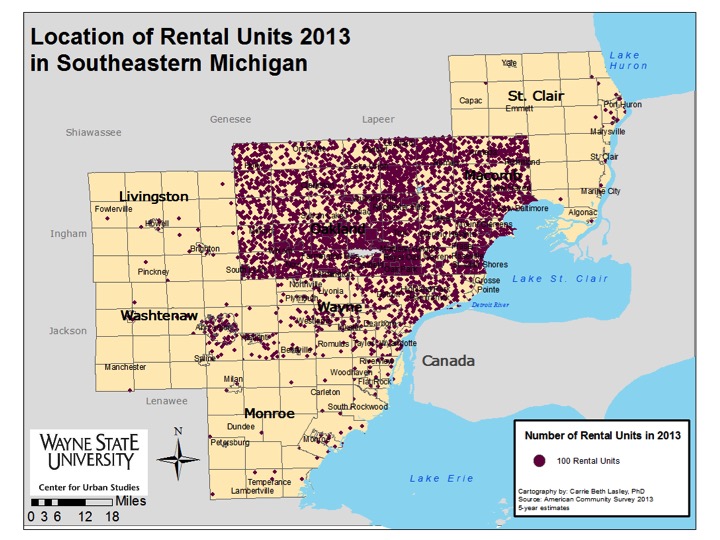
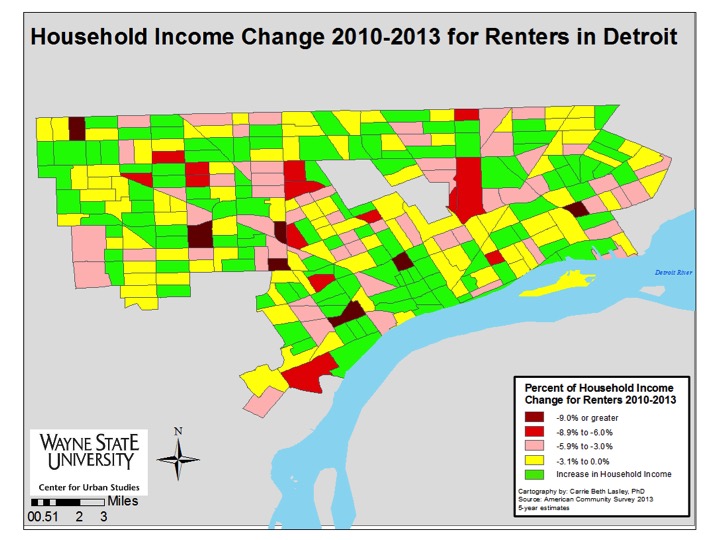
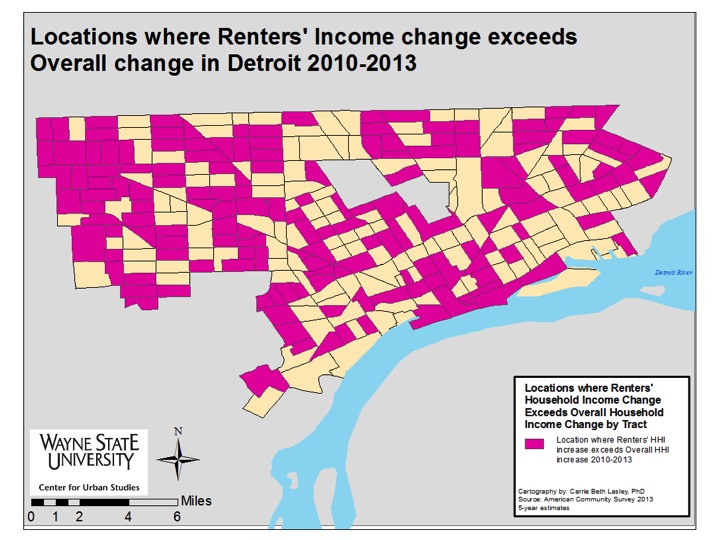
A series of five maps drilling down into the City of Detroit (presented below) shows that pockets of the city experienced household income growth between 2010 and 2013. While there was some overlap between overall income growth and renters’ income growth, this wasn’t true for every Census Tract. One area where there was such a difference was just east of Hamtramck. Here we see that Census Tract experienced overall income growth between 2010 and 2013 but the renters there did not see their incomes increase. Renters in that area also experienced monthly housing cost increases that exceeded their income changes. In this area of the city, homeownership also appears to be more prevalent than in other areas of the city.

Throughout other parts of the city we see that the majority of Census Tracts experienced an increase in renters’ household income between 2010 and 2013. But, the increases in monthly housing cost offset most income increases. This could indicate a shift toward gentrification in some areas as long-term, lower-income renters cannot afford increasing monthly housing costs as demand for rental units in Detroit continues to grow. With a current vacancy rate of 5 percent and a desire for many suburbanites to live in areas such as Downtown, Midtown and Corktown, housing costs in the city continue to grow, according to the MetroTimes (link). It is these areas where renters experienced income growth well above the overall changes in the City of Detroit. Not every Census Tract in these neighborhoods though had renters with income changes above the overall change experienced by the city as whole.

Slide11

Slide12

Slide13

Slide14

Slide15

Detroit rental units

More than half of region’s housing units are mortgaged

With majority of the housing units in the region are reported to have a mortgage, it is important to understand what cost of mortgages are for homeowners. In this post we examine the median monthly housing cost for homeowners with and without a mortgage, along with what percentage of a homeowner’s income the mortgage makes up.

Housing units with a mortgage

There were 22 communities out of 227 in Southeastern Michigan where more than 80 percent of the housing units reported having a mortgage according to the American Community Survey 5-year estimates for 2013. While this is only equivalent to about 10 percent of the region, it should be noted that many of these areas also have some of the newest housing units .

In the majority of the communities in the region 65 percent or more of the housing units were mortgaged. Detroit was on the low end of this spectrum with 51.1 percent of housing units having a mortgage. There was a handful of communities near Detroit where less than 60 percent of the owners reported having a mortgage. In addition, there were two in Monroe County and five in St. Clair County that were reported to be below 60 percent.

OwnerCostsWMortgage

There are groups of households who have mortgage costs three or more times higher than households with the lowest cost mortgages. As one might expect, the highest median monthly owner costs for mortgaged housing units were located in the communities with some of the highest median incomes (link to past post). Those communities with the highest monthly owner housing unit cost were:

  • Bloomfield Hills: $4,000+
  • Northville: $2,478
  • Webster Township: $2,289
  • West Bloomfield: $2,200
  • Grosse Pointe Farms: $2,189
  • Grosse Ile: $2,126
  • Addison Township: $1,749
  • Ann Arbor Township: $1,540

Most of the region, though, had median costs ranging between $1,300.01 and $1,900.

Detroit was only one of 18 other communities in the region where the median monthly cost was $1,300 or below. Pontiac was the only community in Oakland County in this category, and there were none in Livingston, Monroe, or Washtenaw counties.

OwnerCostsWOMortgageHomeowners actually have substantial costs above and beyond their mortgage. The Census Bureau includes: the U.S. Census bureau includes the sum of real estate taxes, various insurance costs, utilities, fuels, mobile home costs and condominium fees. The monthly median housing cost for units without a mortgage are notably smaller, ranging between $365 and $1,000. Additionally, many of the same communities with high median monthly housing unit costs with a mortgage also had high median monthly housing unit costs without a mortgage.

OwnerCosts35pctorHigher

In the city of Detroit, about 65 percent of homeowners reported selected monthly owner costs (mortgage, taxes, utilities) between $700 and $1,499. These housing costs took up between 32 percent and 68 percent of the average Detroiter’s income, which was $26,325 in 2013. This is why more than 43 percent of Detroiter’s with a mortgage reported that it took up more than 35 percent of their income.

Only Marine City, Hamtramck and Bloomfield Hills also had more than 43 percent of their homeowners report that 35 percent or more of their income went to monthly owner costs.

In general many of the highest income communities had some of the lowest overall housing costs relative to income.

OwnerCostsLessthan20pctincome

Effectively this is inverse of the previous map. Here we show the percent of homeowners who are paying less than 20 percent of their income for housing costs. There are five communities where more than 43 percent of homeowners reported their monthly housing costs to be less than 20 percent of their income. Many of these are, again, higher income communities. Some, however, including, Marine City, Port Huron, Plymouth and Ann Arbor are among the communities with the oldest housing stock, meaning that while their utility fees and taxes may not have decreased since the house was built, the mortgages could have been paid off by some of the owners due to the extended time they have owned the home.

High rental burden evident through Southeastern Michigan

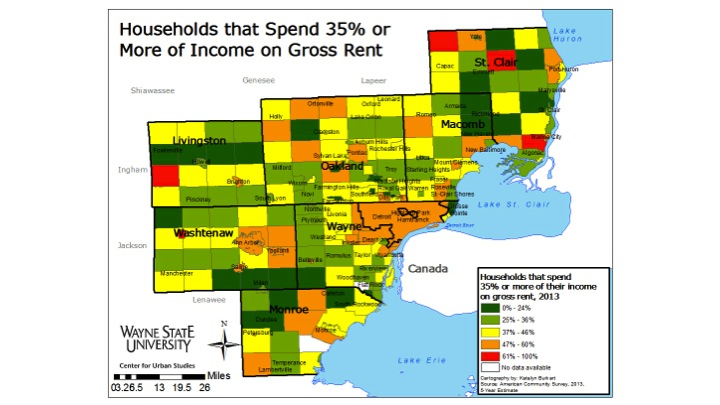
In Southeastern Michigan, there were 11 communities with a median rental cost above $1,200 per unit, yet none of these municipalities had more than 46 percent of their tenants paying more than 35 percent of their income on gross rent. Regionally, the median household income ranges between about $75,000 and $100,000 at the municipal level. According to the U.S. Department of Housing and Urban Development, no more than a third of a household’s income should go toward rent. To highlight how a community’s median income compares to the percentage of rent of that income a household pays we have made three different maps:

  • Households that spend 35 percent or more of income on rent
  • Households that spend 50 percent or more of income on rent
  • Households that spend 10 percent or less of income on rent


First though, two basic maps showing median gross rent at the municipal level and median income at the municipal level are below. Gross rent is defined by the U.S. Census Bureau as the “amount of the contract rent plus the estimated average monthly cost of utilities (electricity, gas, and water and sewer) and fuels (oil, coal, kerosene, wood, etc.) if these are paid for by the renter.”

Overall, Lodi Township in Washtenaw County had the highest median gross rent in Southeastern Michigan at $1,571. Two other Washtenaw County townships, Dexter and York, also had median rental costs above $1,200. At the county level, though, it was Livingston County with the highest median rental costs at $917. Howell and Genoa townships in Livingston County had median rental costs of $1,202. Only one community in Wayne County, Grosse Ile Township, had a median rental cost above $1,200 ($1,201). Wayne County had the lowest overall median rental cost at $777.

When looking at the median-income map we see the same communities, with the exception of those in Livingston County, with the highest median rental costs also have some of the highest median incomes. For example, the median income in Lodi Township is about $107,000 a month. A third of that would be about $36,000 a year spent in rent, or close to $3,000 a month. While Lodi Township did have the highest median rental cost in the region at $1,571, that is nearly half of what that one-third threshold would be. In the city of Detroit though, the median household income is $26,325 annually, or about $2,200 a month. With a median gross rent cost of $761, that is almost exactly a third of the average renters’ income. The difference between the highest median income and lowest median income in the region is 100 percent while the difference between the highest median gross rent and lowest median gross rent is 138 percent. This shows us that average rent prices are not in proportion to average incomes.

Slide03

Slide04

In Southeastern Michigan there are 22 communities, or about 10 percent of the region, in which 24 percent or fewer of renters pay less than 35 percent of their income to gross rent. We see that majority of the region’s renters set aside between 25 percent and 46 percent of their income for gross rent costs. There were only five communities in the region where 61 percent or more of the renters spent 35 percent or more of their income on rent. When increasing that threshold to 50 percent, there were only three (Groveland Township, Salem Township and Columbus Township) communities in the region where 45 percent or more of renters spent more than half of their income on rent. When an individual or a family spends for than 30 percent of their gross income on rent this is called rent burden and according to the National Center for Children in Poverty about 80 percent of low income households with children experience it.

Excluding Columbus Township because of the small sample size, the median income for both Groveland and Salem townships range between $75,000 and $100,000 while the median rent ranges between $650 and $1,000.

Slide06

Slide07

Only four communities in Southeastern Michigan had 14 percent of more of renters paying less than 10 percent of their income toward rent in 2013, according to the American Community Survey. Lyndon Township in Livingston County had the highest percentage at 23 percent and Northville, which is on the border of Wayne and Oakland counties, had 22.64 percent. The other two communities were located in Monroe Township.

Slide09


According to the National Center for Children in Poverty urban areas typically experience higher rates of rental burden. However, in Southeastern Michigan we see that there were also several rural communities, such as Groveland Township, where tenants also experienced rental burden.


Lowest median housing costs concentrated in Detroit, surrounding communities

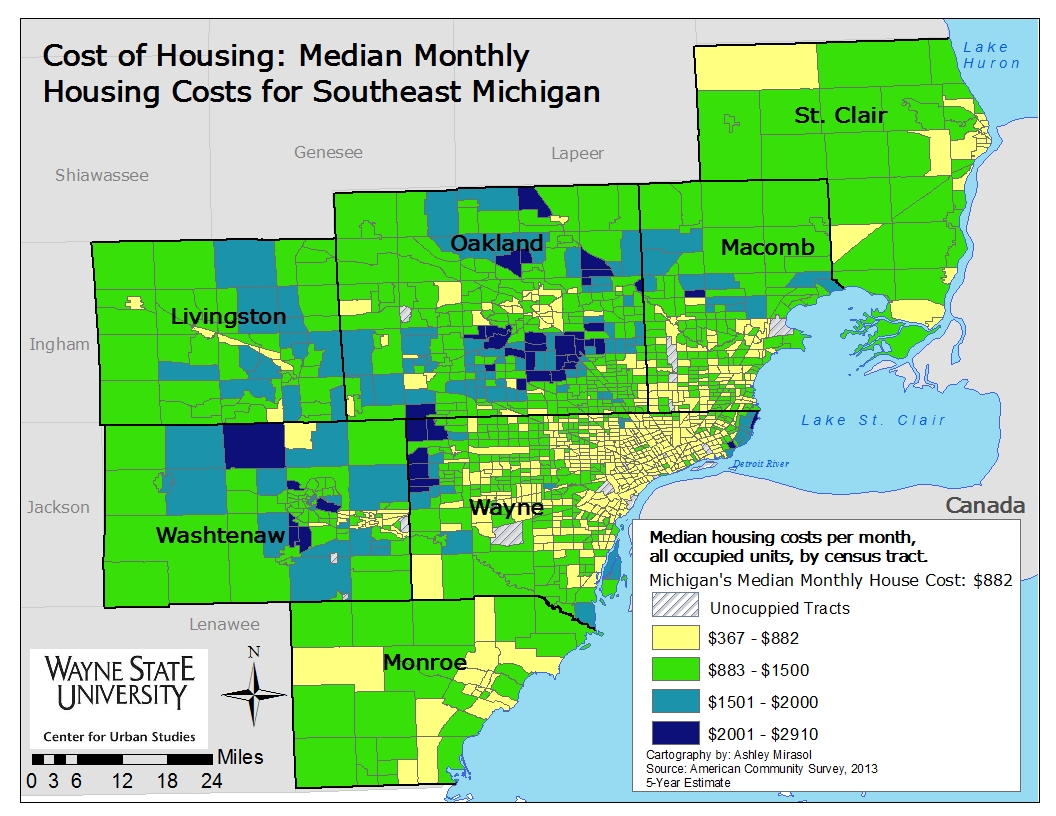
In Michigan, the median monthly housing cost in 2013 was $882, but in the Southeastern Michigan region that cost ranged from about $3,000 a month in areas of Oakland County to about $360 a month in areas of Wayne County.

In the map below we see that Detroit, some of the inner-ring suburbs, and areas along major highways (I-94, I-96) had the highest concentration of median monthly housing costs below that of the state’s in 2013. On the opposite end of the spectrum, the areas with the highest median monthly housing costs were primarily located throughout Oakland County (Bloomfield, Birmingham, etc.) and Washtenaw County (Ann Arbor, Dexter, Lyndon Township).

According to the 2013 American Community Survey, which provided the data for this post, the median monthly housing costs were calculated by dividing “the monthly housing costs distribution into two equal parts: one-half of the cases falling below the median monthly housing costs and one-half above the median. Medians are shown separately for units ‘with a mortgage’ and for units ‘not mortgaged.’ Median monthly housing costs [were] computed on the basis of a standard distribution.”

SE Michigan

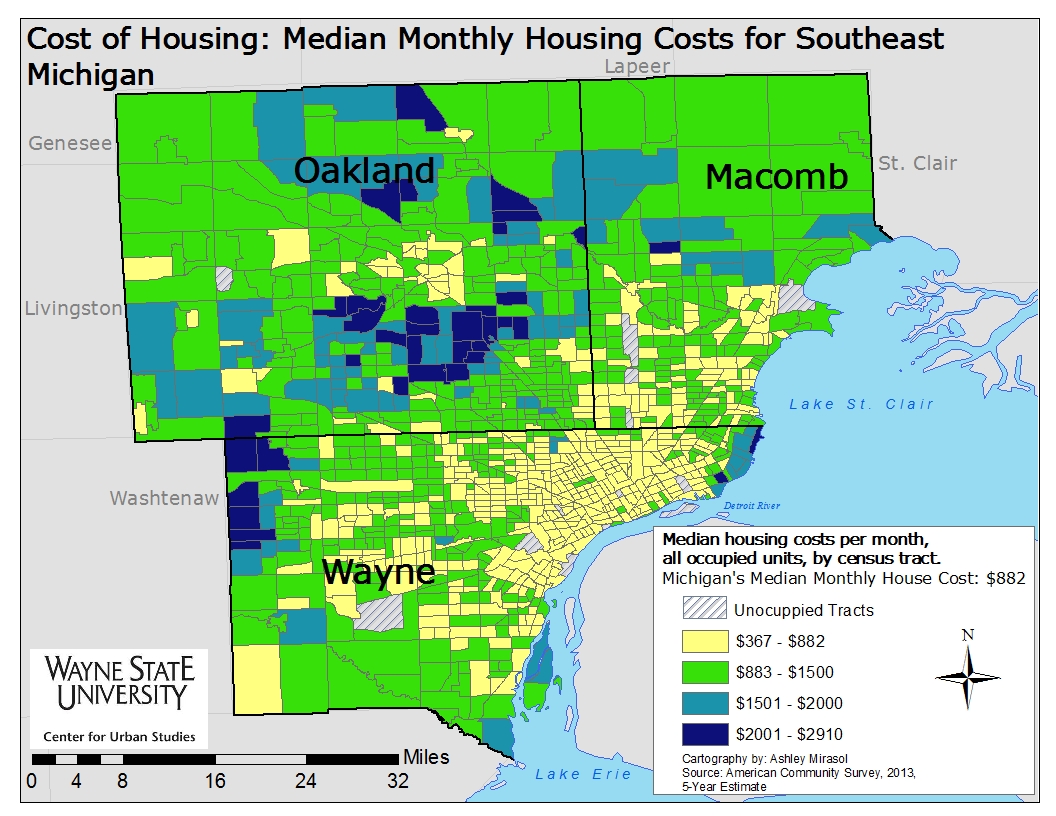
In taking a closer look at the tri-county region, we see that 679 census tracts had a median monthly housing cost below $882 in 2013. And, while this trend spanned out into the southern portion of Macomb County (Warren-Eastpointe areas) and southwest of Detroit, there were only about a handful of census tracts in the portion of Oakland County that borders Wayne County where the median monthly housing cost was $882 or less. These areas in southern Oakland County are located in the Hazel Park-Ferndale-Oak Park area.

housingcostTRICOUNTY

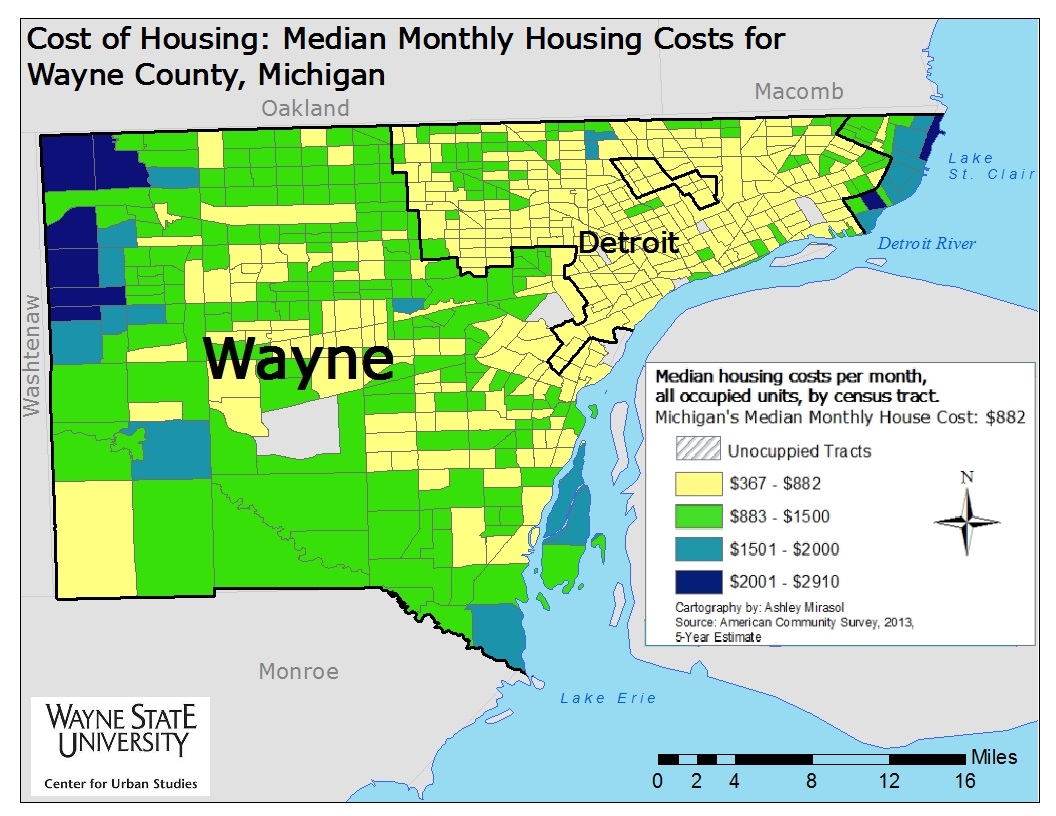
Detroit had the largest number of census tracts where the median housing cost per month was at or below the state average of $882 in 2013. There was one census tract in Detroit (Palmer Woods area) where the monthly median housing was nearly double the state average (this tract includes Palmer Woods).

As seen below, median housing costs of $882 and below also spanned into the central portion of Wayne County, in areas such as Inkster, Dearborn and Romulus. With the exception of Sumpter Township, the most western portions of Wayne County had median monthly housing costs of $883 and more. Areas such as Northville and Canton had amongst the highest median housing costs in the county, ranging between $2,001 and $2,709. The only other area in the county with such high median housing costs were the Grosse Pointes.

This week, we took a look at overall median housing costs in region. In the following weeks, we will begin to explore what percentage of an individual’s income goes toward their rent or mortgage.

housingcostWAYNE

Refocusing Housing Policy in Detroit: Moving to Healthy Housing

The majority of families in Detroit face the risk of death, injury, illness and loss of their children’s mental capacity every day because of hazards in their homes. Based upon highly detailed analyses of homes, it is clear that homes are causing burns, falls, asthma, allergies and lead poisoning.

A detailed survey of Detroit homes, conducted by the Center for Urban Studies at Wayne State University, found that over 62 percent of nearly 500 randomly selected homes have at least one high risk hazard that is likely to lead to poor health outcomes. [1] Of these, 4.2 percent of the homes have three or more hazards in these high risk categories. These dangerous housing conditions, combined with high unemployment and continued crime, are driving people to leave the city in droves.

Recent estimates show Detroit is continuing to lose residents at fast clip, about 1,155 residents[2] a month.

The City is working hard on unemployment (and the improvement of the economy as a whole is helping) and on increased and smarter policing. But on housing for existing residents, far more needs to be done, not just by the City, but by the State and the Federal Government.

To stop this decline and avoid the health consequences of dangerous homes, Detroit and policy makers need to focus far more efforts on providing safe and healthy homes.

As of July 2014, Detroit had a total of 252,173 occupied housing units.[3] However, our best estimates—very generous–are that only around 500 a year are being substantially improved to make them healthy and safe places to live, while just over 800 new housing units were built last year.[4] This is an estimated total of 1,300 homes being produced per year. At this pace, it will be many decades before vast majority of Detroit’s residents can live in safe and healthy homes.

What is a reasonable goal for creating healthy homes for Detroit’s children? A modest goal would be to house all of Detroit’s 193,150 children[5] in safe housing within 10 years. Approximately 3 percent of households (or around 6,000 children) already reside in housing built later than 1980[6] and, in most cases, this is relatively safe housing.[7] A total of about 79,400 households with children live in pre-1980 housing, and we estimate 38 percent are in houses that have only minor hazards[8]. That means 49,259 households are living in homes where one or more major hazard puts them at risk every day. Having nearly 50,000 households plagued with one or more hazards is unacceptable, which is why the families residing in these homes need either new or rehabilitated housing, and they need it soon.

Within 10 years—a short time in the policy world—policy makers should be able to address these needs. To avoid deaths, injuries, illness and loss of mental capacity caused by home environments, Detroit needs at least 4,900 new or rehabilitated homes a year. That is 3.8 times the number we estimate that is being produced now. And this is only the number necessary to protect families with children, not other vulnerable populations such as the elderly.

We need to massively expand renovation and construction, specifically, in these ways:

  • First, concentrate on housing with children, the most vulnerable among us, for rehabilitation;
  • Let’s give families with children a priority to relocate to subsidized housing that has been built after 1980 or that has been re-built and remediated, including lead abatement.
  • Make homes healthy through small investments. Some homes can be made healthy for an investment of substantially less than $5,000. The Green & Healthy Homes Initiative Detroit-Wayne County has shown this can be done. We need to do more of this.
  • Work to improve and remove hazards from current houses, rather than new construction. In cases where the abatement of lead hazards is necessary, the work can cost an average of $20,000,[9] still a fraction of the cost of a new construction.
  • Use code enforcement to force rental owners to substantially improve homes. Progress is being made here, but the number of code inspectors, cut sharply in the midst of Detroit’s fiscal difficulties, needs to be expanded substantially.
  • Ensure all new construction in Detroit includes affordable units.
  • Increasingly the private sector is rehabilitating homes in Detroit. These rehabilitations should pass all standards, especially including the removal of asbestos and lead-based paint. Currently, private sector rehabilitations do not have to pass all standards among governmental and lending organizations that control the sale and rehabilitation of many of these homes.
  • Leverage local and state resources, ranging from public entities to non-profit and for-profit organizations, to develop a robust rehabilitation program. Mayor Duggan has made a good start here with his zero interest loan program, but many families cannot meet the income and other requirements required by this program. We need grant programs to assist these low income homeowners.
  • Many thousands of families are living in homes that have black mold and other major damage from the August, 2014 floods across Detroit and other communities in Southeast Michigan. FEMA and other agencies need to invest in these homes to protect people from major health problems.

Healthy Homes Risk Assessments 

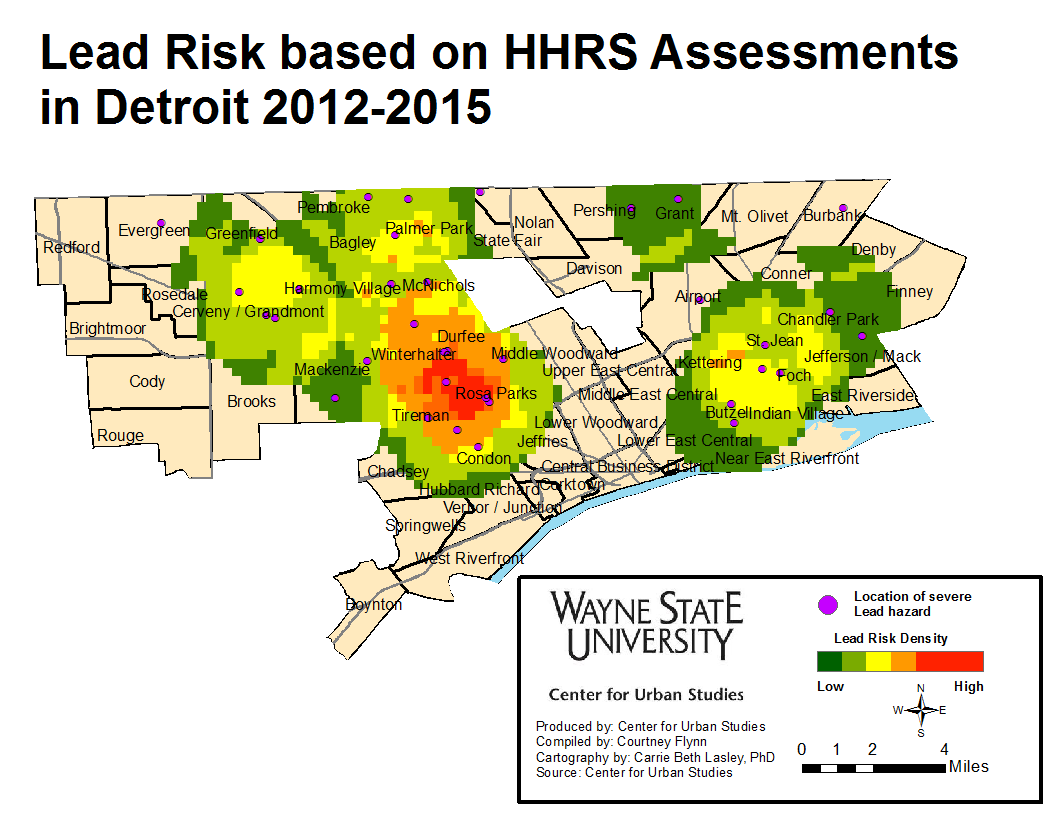
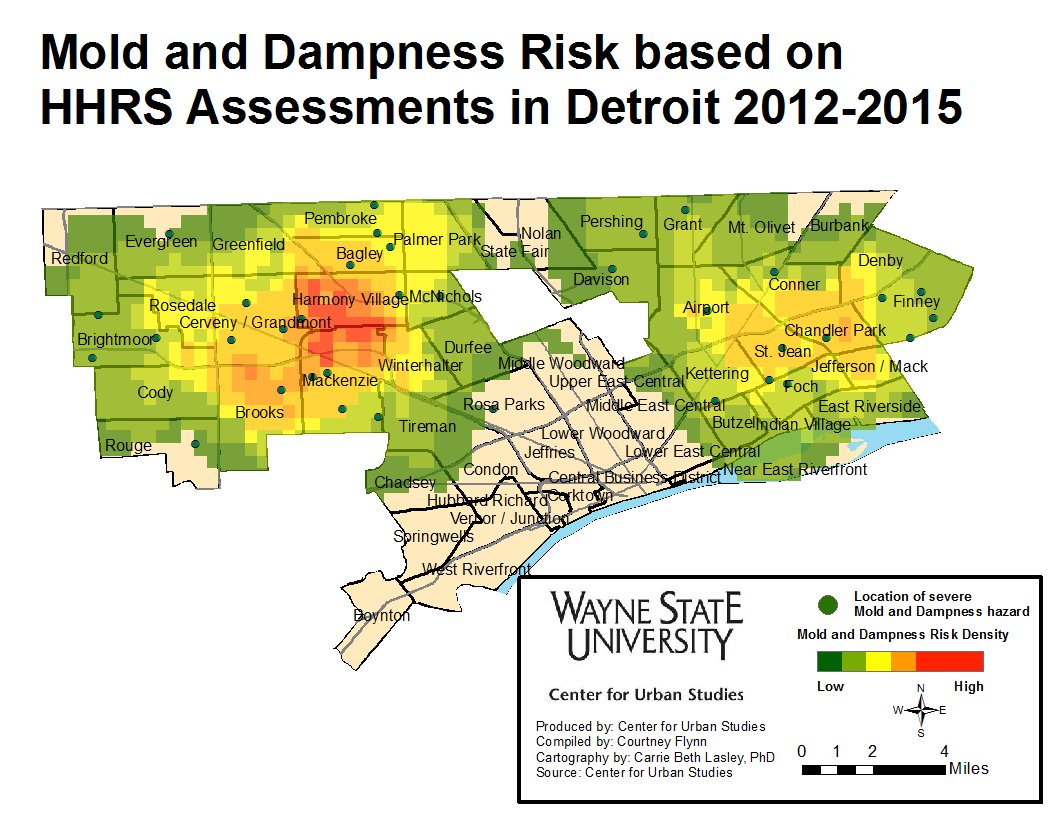
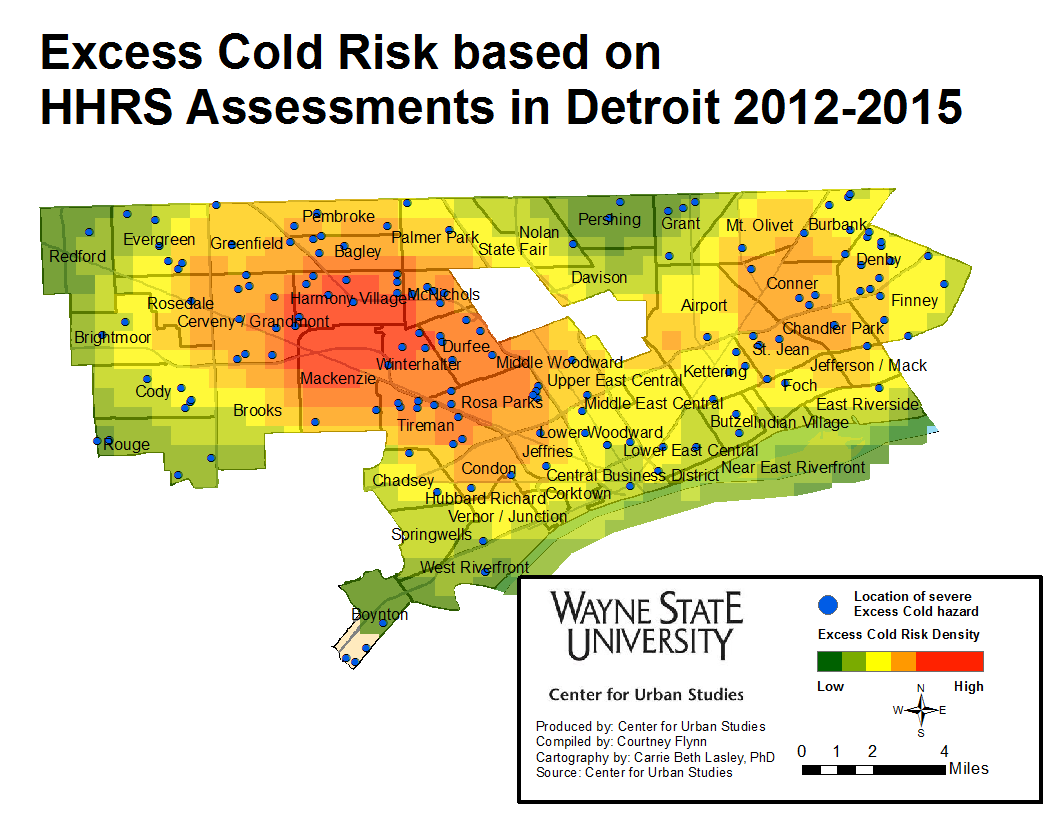
These maps below are based on a random sample of 500 homes spread broadly across Detroit. At each house assessors completed a Healthy Homes Rating System assessment that examined 29 potential hazards. This rating system is a HUD-endorsed rating instrument that assesses both the probability of injury and extent of injury from a hazard.  Three of the most frequently occurring and severe hazards were excess cold, mold and dampness and lead paint. The following three maps portray of the areas of Detroit that had the highest levels of hazards.

Lead

HHRSMold Cold


[1] This data is collected using the Healthy Homes Rating System (http://portal.hud.gov/hudportal/HUD?src=/program_offices/healthy_homes/hhrs). According to this system, a “high-risk” hazard is identified by a rating of A, B or C on a scale of A-J, A being highest likelihood of serious injury or death and J being minimal risk.

[2] This calculation is based on the April 1, 2010 estimate based on the Census and a 2014 estimate from SEMCOG, broken down into a monthly estimate by simple division across the months.

[3] SEMCOG Community Profile, City of Detroit (http://www.semcog.org/Data/Apps/comprof/people.cfm?cpid=5)

[4] At best only several hundred houses a year are being improved to systematically reduce health hazards. It is important to note, however, that about 806 new housing units were constructed in Detroit last year.

[5]U.S. Census Bureau, Demographic and Housing Estimates, 2013 American Community Survey 1-Year Estimates, Detroit city, Michigan (http://factfinder2.census.gov/faces/tableservices/jsf/pages/productview.xhtml?pid=ACS_11_5YR_DP04)

[6] U.S. Census Bureau, Households and Families, 2013 American Community Survey 1-Year Estimates, Detroit city, Michigan (http://factfinder.census.gov/faces/tableservices/jsf/pages/productview.xhtml?pid=ACS_13_1YR_S1101&prodType=table), U.S. Census Bureau, Households and Families, 2013 American Community Survey 1-Year Estimates, Detroit city, Michigan (http://factfinder.census.gov/faces/tableservices/jsf/pages/productview.xhtml?pid=ACS_13_1YR_DP04&prodType=table) This is probably an underestimate as we were unable to obtain of precise occupancy data for post-1980 housing.

[7] It is also important to know that lead paint was banned for use in residences in 1978 and taken off the shelves in 1980.

[8] This estimate is based on the results from the Healthy Homes Rating System being conducted in Detroit.

[9] This cost may include the replacement of all windows within the home as this is a major source of lead.