Ten Things Joe Biden and Kamala Harris Should Do for Detroit

There are two reasons Detroit should have a special place in President-elect Joe Biden’s heart. First, because Detroit needs real help–now. And second is because Detroit is one of the key places that brought his victory. Detroiters voted in massive numbers for him and Vice President-elect Kamala Harris, and Democrats will need Detroit voters to win again. As the saying goes, you need to dance with the ones who brung you.

Here, then, are ten agenda items Biden and Harris should prioritize—giving back to a City that helped bring them into office.

1.Make plenty of vaccine doses available. Unemployment linked to COVID-19 closures have hit the poor and those in service jobs far harder than other industries. Unemployment numbers are more than double in Detroit than in Michigan. More vaccines mean it’s safer to go back to work, and Detroiters need that work and the accompanying income now. That will improve many other things mentioned here, including reducing violence.

2. Reduce the violence. We’ve seen major increases in murders and shootings. On surveys through the years, Detroiters have consistently said public safety is at the top of their agenda, but that does not translate to a desire for heavy duty police enforcement across the board. Rather than defund the police, Biden should talk about demilitarizing the police and making them responsive to the true needs of the community. Detroit citizens want tough action against the repeated violent offenders, but they want first time offenders and others diverted out of stigmatizing court process into community service, education and job training programs. For example, police regularly stop hundreds of people and arrest them for carrying illegal weapons. We need to divert these citizens into training programs that teach them about the risks of violence. We need to use conflict deflectors and de-escalators to reduce violence. Increased participation in youth sports and utilization of open community centers will also help deter violence. While many of these outlets have been closed and cancelled due to COVID restrictions, we must find ways to continue to offer such opportunities.  

3. Reduce domestic violence. Domestic violence, already high in Detroit, has increased under COVID-19, and the enforcement of parole violations for domestic violence offenders by Michigan Department of Corrections has declined.

Detroit has far fewer shelter beds than surrounding communities for survivors of domestic violence (DV) or intimate partner violence (IPV). This needs to be corrected immediately. Beyond that, survivors need to have far more access to advocates who can help them navigate the complex legal and support systems that do exist. They need more financial help to pay for things like moving to safe locations and serving Personal Protection Orders that are intended to help shield survivors from further violence.

4. Increase jobs for youth.  Detroit youth have extraordinary unemployment levels, well above the already high adult unemployment levels. This is a crisis, especially because we know that this will affect their lifetime earnings and connection to the workforce. Such high levels have led to challenges to democracy itself in other times and countries.

We need broad, youth employment programs funded by the federal government and operated by non-profits that do real work to help improve Detroit.  These jobs must create job ladders for youth so they have a future in which to invest.

5.Increase support for youth to go to college, apprenticeships, and training at community colleges. Many youth have no real way to pay for college.

We need to increase Pell Grants very substantially so youth who want higher education can get it without having a lifetime of debt, as so many do now. Apprenticeships and training in the skilled trades also often lead to good jobs with benefits and high wages—sometimes higher than college-educated jobs. These opportunities also need more funding so the youth have access to an even wider range of skills and jobs.

6.Fully fund special education. In Michigan, charter schools are implemented in a manner where they generally recruit higher performing students from the public schools, leaving the public schools with fewer higher performing students—who tend to cost less to educate. In major urban areas, charter schools proliferate and the public schools end up with a disproportionate share of special education students, which the charter schools avoid. These students cost more to educate. Because special education is not fully funded by the federal government, the costs are off loaded onto urban school districts in Michigan. These costs drive urban school districts into debt and decline. None of this makes it onto the debate stage, but this is the crucial work that needs to be completed to help Detroit and other cities like it. More federal funding is needed for special education students.

7.Invest massively in home repair. Detroit’s housing is crumbling with 63% of the housing units having at least one major health hazard. Lead paint, lack of heat, flooding, asbestos, Volatile Organic Compounds (VOCs), structural hazards, fire hazards—these are all present across the range of homes in Detroit both for homeowners and renters.

Detroiters don’t have the money to pay for all these repairs, and Community Development Block Grant dollars continue to decrease. Money for repairs of existing homes is needed to make them safe and to protect existing residents from disease, injuries and break-ins. This will also protect them from gentrification.

8.Protect homeowners from foreclosure. This is a perennial issue in Detroit that turns into a crisis with every recession. In the Great Recession, many thousands of homes were wrenched from homeowners. Now foreclosures are high again.

Short term cash and longer term re-writing of mortgage agreements are critical to short circuiting this endless cycle of foreclosures that has already made Detroit a majority renter city. This too will protect existing homeowners from gentrification.

9.Invest heavily in weatherization. One the highest costs that Detroiters face are their utility bills, both for renters and homeowners. Leaky old houses mean huge heating bills that often take up a large part of the budgets of low and moderate income households. In neighborhoods like Southwest Detroit, where industry and traffic pollute the air, this weatherization should also include air filters to clear the air that people breathe most of the time (Americans typically spend 80% of their time in their homes).

The Obama Administration initiated a large weatherization program but the budget for that got nixed by the GOP in Congress. Now is the time to move forward with this both for the sake of everyday Detroiters and the sake of the planet.

10.Build Community Solar. Unlike many cities, Detroit has lots of open space that could be used for solar energy production. DTE, our local utility, mainly produces electricity from coal, which hurts the planet and the lungs of Detroiters. And, Michigan produces none of this coal. Another way to help Detroiters reduce their utility cost is use some of the massive amount of vacant land in the city for building community solar installations. With investment from the federal government, these could be owned by Community Development Corporations or others who could sell the solar power at cost to homeowners nearby. Investing in these small-scale production facilities would produce installer jobs for Detroiters, increase reliance on alternative sources of electricity, cut costs for citizens and make appropriate use of vacant land.

Communities with Higher Non-White Populations Tend to Remain Democratic

Several of the areas that flipped from Democratic to Republican from the 2012 to 2016 Presidential Elections had populations composed of 15 percent or less non-white populations. There were exceptions to this though in areas in Southern Macomb County and Romulus in Wayne County. The Southeastern Michigan regional map below also highlights that Republican areas, in both elections, almost exclusively had populations where 15 percent or less of the residents were non-white.

Detroit, Highland Park and Royal Oak Township, had the highest percentages of non-white residents and also went Democratic in both elections.

Slide03

In Warren the non-white population is 26 percent, and it was here and in Sterling Heights were several precincts flipped from Democratic to Republican in Macomb County. Sterling Heights’s non-white population is 16 percent. Portions of Roseville also flipped from Democratic to Republican and here the non-white population is 23 percent.

Of the Macomb County communities with several of precincts that flipped, St. Clair Shores had the lowest percentage of non-white residents at 8 percent. These communities that flipped also had middle-class incomes, as shown in our previous post.

Slide05

In the areas in Oakland County that flipped from Republican to Democratic (Birmingham, Bloomfield Hills) the percentage of the non-white population typically ranged between 10 and 25 percent. Of those communities, West Bloomfield had the highest percentage of non-whites at 25 percent.

As shown in our previous post, these areas also had some of the highest median incomes in the region.

Of the communities in Oakland County that had several precincts that remained Republican in both elections, Novi and Troy had the highest percentage of non-white populations, 14 and 31 percent, respectively.

Communities that remained entirely Republican across both elections varied substantially from many that had less than ten or even 5 percent non-white to a few precincts that had between 10 and 50 percent non-white residents.

The City of Southfield had the highest percentage of non-white populations of the communities that remained Democratic at 75 percent.

Slide07

Highland Park and Detroit had among the highest non-white populations in both the region and the state. Both of these communities, along with several others surrounding them (River Rouge, Ecorse, Redford, etc.) went Democratic in the 2012 and 2016 elections. As we’ve highlighted throughout this series, the Downriver area had several communities flip from Democratic in 2012 to Republican in 2016. These communities have mid-range incomes, and the majority, with the exception of Brownstown and Taylor, had non-white populations below 15 percent. Brownstown had a non-white population of 16 percent and Taylor had one of 23 percent.

Slide09

Pittsfield, Superior and Ypsilanti had the highest percentages of non-white populations in Washtenaw County, with the City of Ypsilanti having the highest at 38 percent. It was Lima, Sylvan and portions of Dexter, Webster, Lodi and Pittsfield townships that flipped from Republican to Democratic between the two elections. Pittsfield had the highest percentage of non-white populations of these communities at 37 percent and Webster had the lowest at 3 percent.

While there were portions of Dexter that flipped Democratic, there were also portions that flipped Republican. The township’s non-white population stands at 3 percent. However in Augusta and Lyndon, two communities that flipped entirely Republican, the non-white population percentages were 14 and 10 percent, respectively.

Slide11

Our last post showed that majority of the communities that flipped from Democratic to Republican had mid-range incomes. In this post the data does not show a consistent trend on the racial makeup of communities that flipped. For example, in Southern Macomb County, Warren, Roseville, Sterling Heights and Clinton Township all had non-white populations above 15 percent while in the Downriver communities in Wayne County majority had non-white populations below 15 percent (Taylor and Brownstown were the exception).

One trend this post did show though was that communities with non-white populations above 25 percent went Democratic in both elections. On the opposite end of the spectrum, areas that stayed Republican across both elections almost always had populations where 15 percent or less of the residents were non-white.


Majority of Metro-Detroit’s Communities that Flipped Republican have Middle Class Incomes

In our last post regarding the 2016 Presidential election we highlighted what areas in Southeastern Michigan flipped from Democratic to Republican, or Republican to Democratic. The most notable switch occurred in Macomb County where, much of the southern portion of the County went from voting Democratic in 2012 to Republican in 2016. This switch was also noticeably evident in the Downriver area of Wayne County.

In the 2016, Detroit and its inner-ring suburbs (Ferndale, Royal Oak, parts of Warren, etc.), along with Ann Arbor and its surrounding cities to the east and west, had Democratic Candidate Hillary Clinton as the winning candidate. However, a large share of the region went to now President Donald Trump, including all of Livingston and St. Clair counties and majority of Macomb and nearly all of Monroe counties.

To shine additional light on the 2016 Presidential election, we will now be looking at the socioeconomic characteristics of the region, alongside which Presidential candidate won where. For this post, we will be discussing median income, particularly of the areas that flipped between the 2012 and 2016 elections.

When examining the region overall, the map below shows that majority of the areas in Southeastern Michigan that flipped from Democratic to Republican have a mid-range ($45,000-$70,000) median income. As we get further into the details of the region, we see this to be a defining factor for this group of precincts. Of the areas that have remained Republican, median incomes range from between $45,000 and to over $100,000. Of the areas that remained Democratic the median incomes range from about $17,000 to $100,000.

Slide03

A deeper look at Macomb County shows that majority of the areas that switched from voting Democratic in 2012 to Republican in 2016 have a median income between $45,000 and $70,000. This is true for St. Clair Shores, Sterling Heights and parts of Chesterfield, Lenox, Harrison and Clinton townships, all of which had at least one precinct flip. In the northern part of Macomb County, which voted Republican in 2012 and 2016, the median income is above $70,000.

While portions of Warren also flipped from Democratic to Republican, it is categorized as having a median income below $45,000. But, as noted earlier, the city’s median income is $44,000.

Slide05

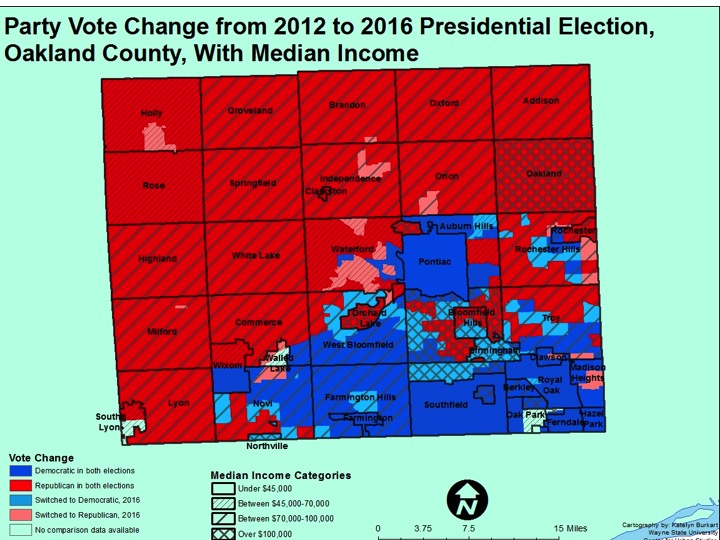
In Oakland County, there were some high income areas-Bloomfield Township, Bloomfield Hills and Birmingham-that flipped to Democratic. However, we see that majority of the County went Republican in 2012 and 2016, and majority of these communities have median incomes above $70,000. The communities in the southeastern portion of Oakland County (Ferndale, Royal Oak, Oak Park) have remained Democratic communities for both elections and their median incomes top out at $70,000. Pleasant Ridge and Huntington Woods are two higher income (above $70,000) communities in that portion of the County that have traditionally gone Democratic.

Slide07

As noted earlier, it was the Downriver portion of Wayne County that flipped from Democratic to Republican for the 2016 election. In this portion of the County (Trenton, Woodhaven, Riverview, Flatrock, Gibraltar, Rockwood, etc.) 10 of the communities have a median income between $45,000 and $70,000. Parts of Taylor (median income below $45,000) and Brownstown (median income between $70,000 and $100,000) also switched.

Throughout Wayne County, median incomes vary greatly, with communities located on the County’s north eastside (Detroit, Hamtramck, Highland Park and Ecorse, etc.) having a median incomes below $45,000 and communities on the northwest side (Northville, Canton, Livonia) having median incomes above $70,000. Communities with median incomes between the two extremes are also scattered throughout the county. In Wayne County, of the 14 communities with median incomes above $70,000, 10 had a large Republican turnout. Of that 10, four showed precincts that flipped from Democratic to Republican, while the rest remained Republican between 2012 and 2016.

Slide09

In Washtenaw County, there are no communities that have a median income less than $45,000. Of the four that had precincts flip from Democratic to Republican between the two elections, the median incomes range between $67,000 (Northfield) and $94,000 (Dexter).

Of the communities that with precincts that flipped from Republican to Democratic, five had median incomes above $70,000 and one had a median income at $69,000.

Slide11

By examining the election data alongside median income data, we are able to determine there were 32 communities with median incomes between $45,000 and $70,000 with at least one precinct that flipped from Democratic to Republican between the 2012 and 2016 elections. When the opposite occurred-an area flipped from Republican to Democratic-the median income of that area was above $70,000.

Next week we will look at the election outcomes while also looking at the racial makeup of Southeastern Michigan’s communities.

Where Did the RTA Fail in Southeastern Michigan?

In November 2016 the concept of regional transportation in Southeastern Michigan lost again. On the Nov. 8 ballot was a question asking residents of Macomb, Oakland Wayne (including Detroit) and Washtenaw counties if they would fund a 1.2 mill tax (about $120 a year for a homes with a taxable value of $100,000) for 20 years.

If passed, the millage would have created main transportation routes along Woodward, Gratiot and Michigan avenues (some of which would have eventually used Bus Rapid Transit), along with connector lines going east to west throughout Wayne, Oakland, Macomb and Washtenaw counties. However, only Wayne and Washtenaw counties supported the millage overall. In Oakland County the millage fell short of approval by 1,109 votes (50.1 percent of voters voted against it) and in Macomb County the measure failed with 60 percent of voters voting against it.

Slide2

Currently in Southeastern Michigan, public transportation is fragmented, at best. Parts of Wayne, Oakland and Macomb counties are serviced by the Suburban Mobility Authority of Regional Transit (SMART), a transportation system that was created in 1967. However, in Oakland and Wayne counties communities can opt-out of the system, meaning they do not need to support its funding or have routes accessible in their community. Macomb County, through legislation passed by the County Board of Commissioners, is an entirely opt-in community. This means either the majority of the county supports SMART funding when it goes up for renewal and/or increases or it doesn’t; the county as a whole has historically supported SMART.

RTA Vote - Municipality Level - SMART Communities_Borders&Labels_JPEG

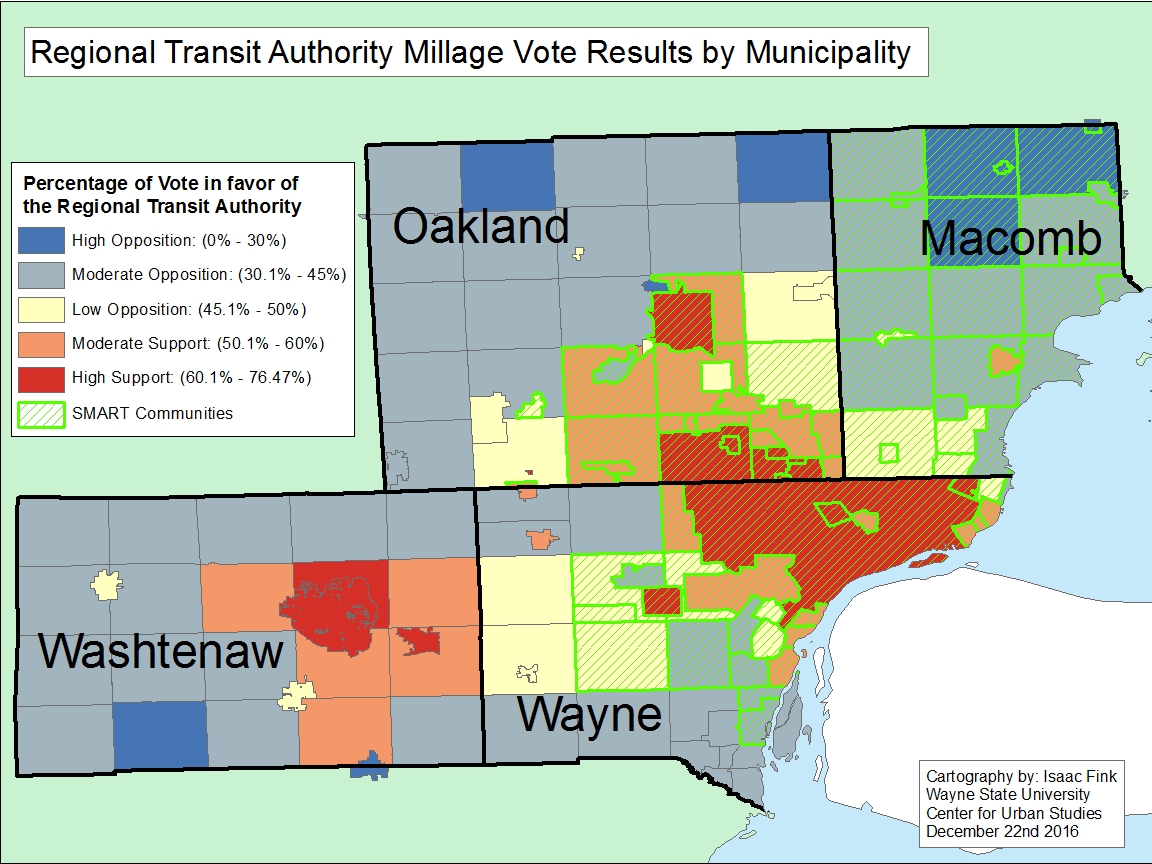
Despite Macomb County being completely opt-in for SMART, only one municipality supported the RTA millage in November; it was Mount Clemens-the county seat. According to the Macomb County Clerk’s Department 55 percent of voters in Mount Clemens supported the millage and 45 percent voted against it.

In Oakland County, 23 of the 51 municipalities in the region supported the RTA millage, with the inner-ring suburbs like Ferndale (72% yes), Pleasant Ridge (74% yes) and Huntington Woods (76% percent yes) showing the highest support. Unlike Macomb County, Oakland County is not an entirely “opt-in” community for SMART, meaning individual municipalities decide whether they want to fund/participate in the region’s current form of public transportation. Ferndale, Pleasant Ridge and Huntington Woods all opt-into SMART, as do some of the Oakland County communities that were just above 50 percent of voters supporting the RTA millage; these communities include Bloomfield Township and Birmingham. Troy and Bloomfield Hills are two communities in Oakland County though that participate in SMART but did not approve the RTA millage.

In Wayne County, where there are SMART routes and where the Detroit Department of Transportation (DDOT) operates, communities like Detroit, Hamtramck, Highland Park, Dearborn and Redford Township (which all participate in SMART) voted to approve the RTA millage. However, communities on the western side of the county and a majority of the downriver communities (despite some participating in SMART-like Trenton) did not approve of the transportation millage. Overall, 53 percent of Wayne County voters voted to approve the RTA millage.

Washtenaw County does not participate in SMART (the transit system is limited to Macomb, Oakland and Wayne counties) but it does have the Ann Arbor Transit Authority (AATA). Of those who voted on this measure, 53 percent supported the millage in the county. Overall, eight of the 27 communities in the county supported the millage. However, those with the highest populations (Ann Arbor and Ypsilanti) showed high support for the regional transportation tax.

Despite not having a long-term funding mechanism, the RTA currently operates RefleX, which is a supplemental ride system along Woodward and Gratiot avenues; these services did not eliminate any SMART or DDOT stops/lines. However, the RTA is only funded by the State through Sept. 30, 2017. After that though, its future is uncertain. With the regional transportation millage failing, the RTA is left without a solid funding source and cannot go to the voters with another tax proposal until 2018. According to Public Act 387 of 2012 (which created the RTA), the RTA can receive money through voter approved millage funding and/or an additional fee that may accompany state driver registration fees. Ballot initiatives can only be placed on ballots during presidential or gubernatorial elections.

Members of the RTA Board of Directors or Executive Staff have not publicly stated their future plans or ideas for funding mechanisms. While funding mechanisms would need to be identified, negotiating interlocal agreements between communities that want transit might be an incremental means of supplementing the fragmented systems currently in place. For example, there are no direct public transportation routes between Ann Arbor and Detroit[1] even though Ann Arbor, Detroit and DTW are the most desired routes, according to surveys. Both Wayne and Washtenaw Counties voted for the RTA, so it seems feasible that enterprising public officials in those two counties could negotiate an agreement to move forward on creating services, knowing both that their residents voted for services and that they want those routes.

[1] It might be possible for an ambitious soul to take a bus from Ann Arbor to the Detroit Metropolitan Airport (DTW) and then shift to a SMART bus and transfer to a DDOT bus into Detroit.
[1] It might be possible for an ambitious soul to take a bus from Ann Arbor to the Detroit Metropolitan Airport (DTW) and then shift to a SMART bus and transfer to a DDOT bus into Detroit.

Change Evident in Southeastern Michigan for Presidential Election

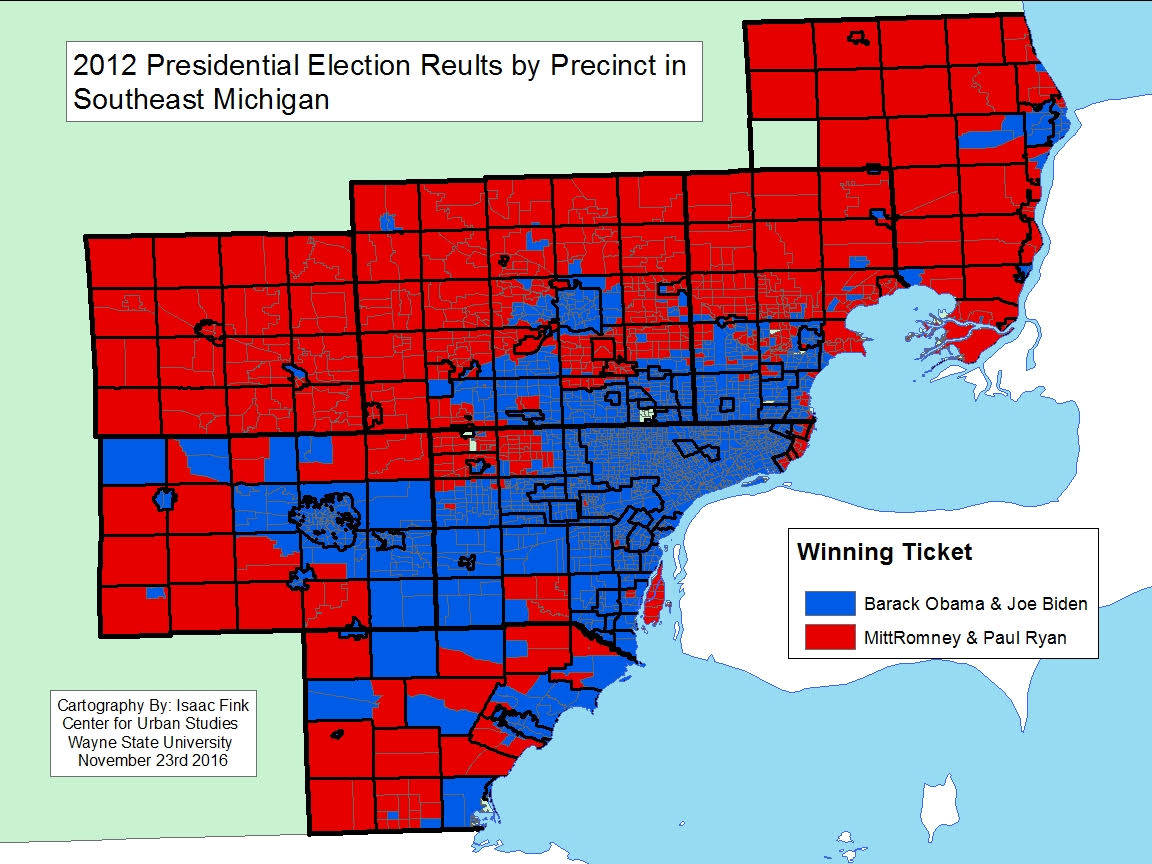
On Nov. 8, 2016 election results showed that then Republican nominee Donald Trump was elected to serve as the nation’s 45th President; Michigan was one of the states that went red for President-Elect Trump. In 2012 though President Barack Obama, the then Democratic candidate up for re-election, won Michigan, helping assure his second term in the White House. To show exactly what locations swung from Democratic to Republican or Republican to Democratic in the 2016 Presidential Election, voting results by precinct were taken from the Michigan Secretary of State and the County Elections offices and mapped. Even just a glance at the maps shows where significant change occurred-Macomb and Monroe Counties-but our deeper look at the precincts also shows precisely where change occurred throughout Oakland, Washtenaw and Wayne counties. In many cases, the change shown is of an area where residents voted Democratic in 2012 and Republican in 2016, but there were instances of the opposite as well.

november-8th-2016-presidential-election-reusts-by-precinct-in-southeast-michigan_01032017_jpeg

2012-election

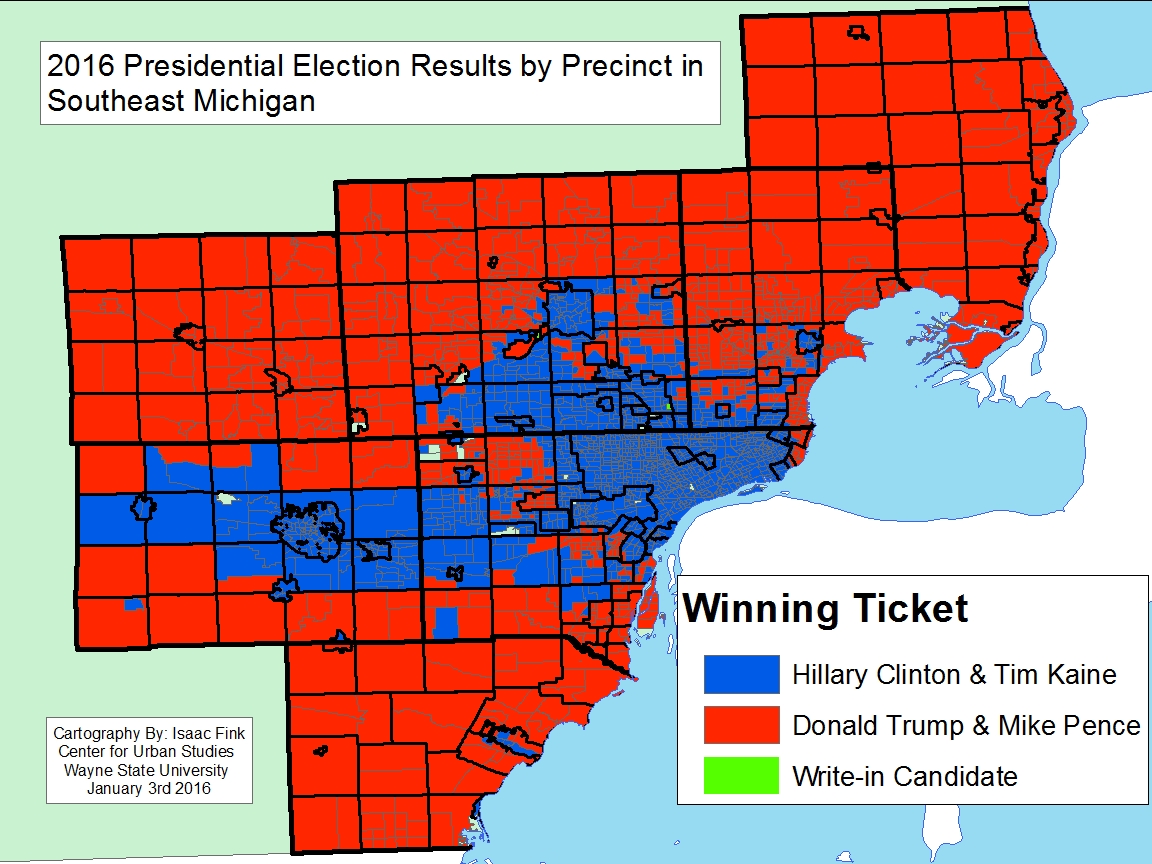
In the 2016 map we see that Detroit and its inner-ring suburbs (Ferndale, Royal Oak, parts of Warren, etc.), along with Ann Arbor and its surrounding cities to the east and west, had Democratic Candidate Hillary Clinton as the winning candidate. There was also a pocket in the City of Monroe that went to Clinton. However, a large share of the region went to President-Elect Donald Trump, including all of Livingston and St. Clair counties and majority of Macomb and nearly all of Monroe counties.

semcogchangemap

The two counties in the region that had the largest number of precincts switching from Democratic to Republican from the 2012 to 2016 election were Macomb and Monroe counties. In 2016 53.6 percent of the votes went to the Republican nominee (President-Elect Trump) in Macomb County while in 2012 47.5 percent of the vote went to then Republican nominee Mitt Romney, according to the election results. In Monroe County in 2016 58.4 percent of the votes went to the Republican nominee (President-Elect Trump) in Monroe County and in 2012 that number was 48.9 percent for the Republican nominee, according to the election results.

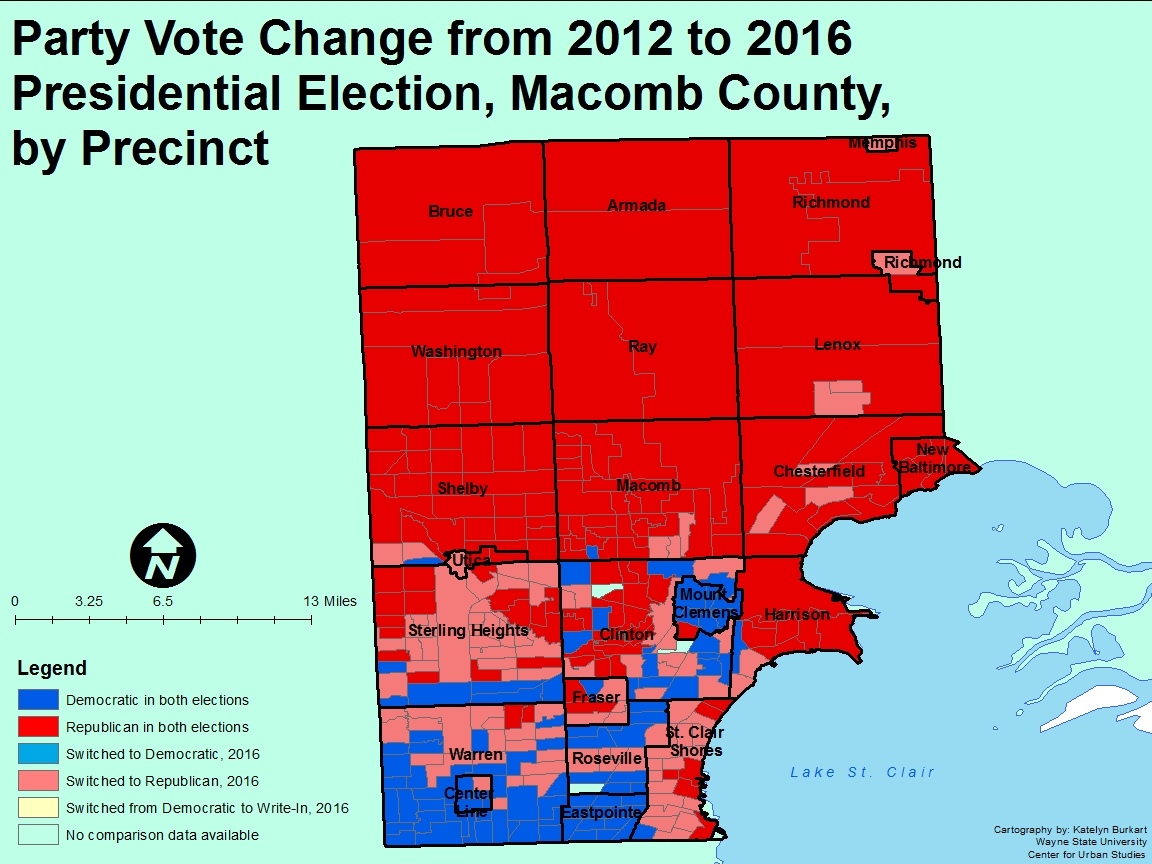
When drilling down into Macomb County we see that the central portion of Sterling Heights, the northern portion of Warren, majority of St. Clair Shores and pockets of precincts in Lenox, Chesterfield, Clinton, Harrison, Richmond and Shelby townships and in the cities of Fraser, Utica and Roseville flipped from Democratic to Republican precincts between the 2012 and 2016 elections. There was not one precinct in Macomb County that switched from Republican to Democrat between the 2012 and 2016 elections, according to county election results.

macombmap

In Monroe County we see that the city of Monroe and Dundee, London, Erie, Exeter, Berlin and Rainsville townships switched from Democratic in 2012 to Republican in 2016. Similar to Macomb, there were no precincts in Monroe County that had the reverse switch, going from Republican in 2012 to Democratic in 2016.

While overall, Wayne County remained Democratic in the 2016 election, a drill down on the municipalities and precincts shows that nearly all of the Downriver region
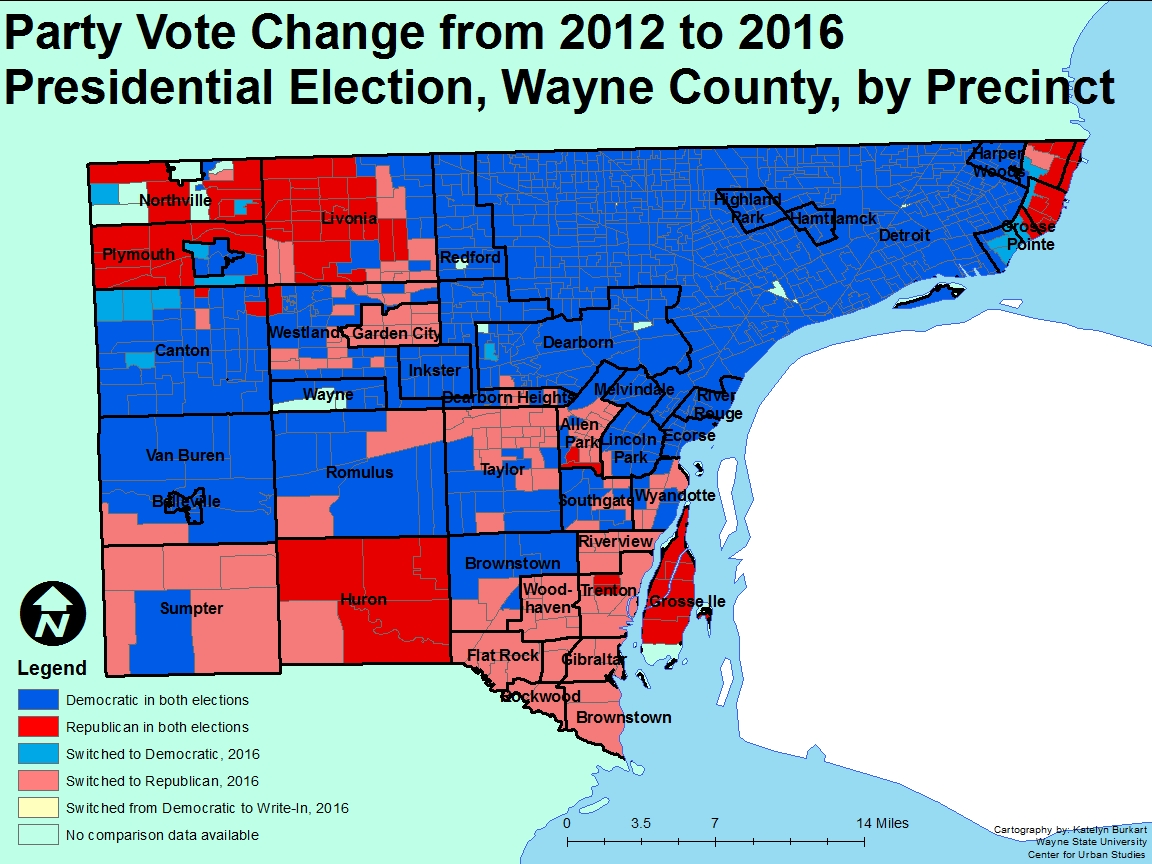
(Trenton, Woodhaven, Flat Rock, Gibraltar, Rockwood, Brownstown, Riverview and portions of Wyandotte, Southgate, Taylor and Allen Park) switched from voting Democratic in the 2012 election to going for the Republican Presidential nominee in 2016. Additionally, all of Garden City made that switch, as did portions of Huron, Sumpter and Van Buren townships, along with areas in Westland, Romulus and Livonia. Overall in Wayne County in 2016, 66 percent of the vote went to Democratic nominee Clinton and 29 percent went to Trump, according to the official Wayne County election results. In 2012 though 73 percent of the vote went to the Democratic nominee (Obama) while 26 percent went to the Republican nominee (Romney), according to election results.

waynemap

Washtenaw County, unlike Macomb and Monroe, had several precincts in 2016 that switched from being Republican in 2012 to being Democratic in 2016. All precincts in Lima and Sylvan townships switched from Republican in 2012 to Democratic in 2016, and about half of the precincts in Dexter and Lodi townships did the same. Augusta and Lyndon townships did the opposite, switching from Democratic to Republican between the two elections.

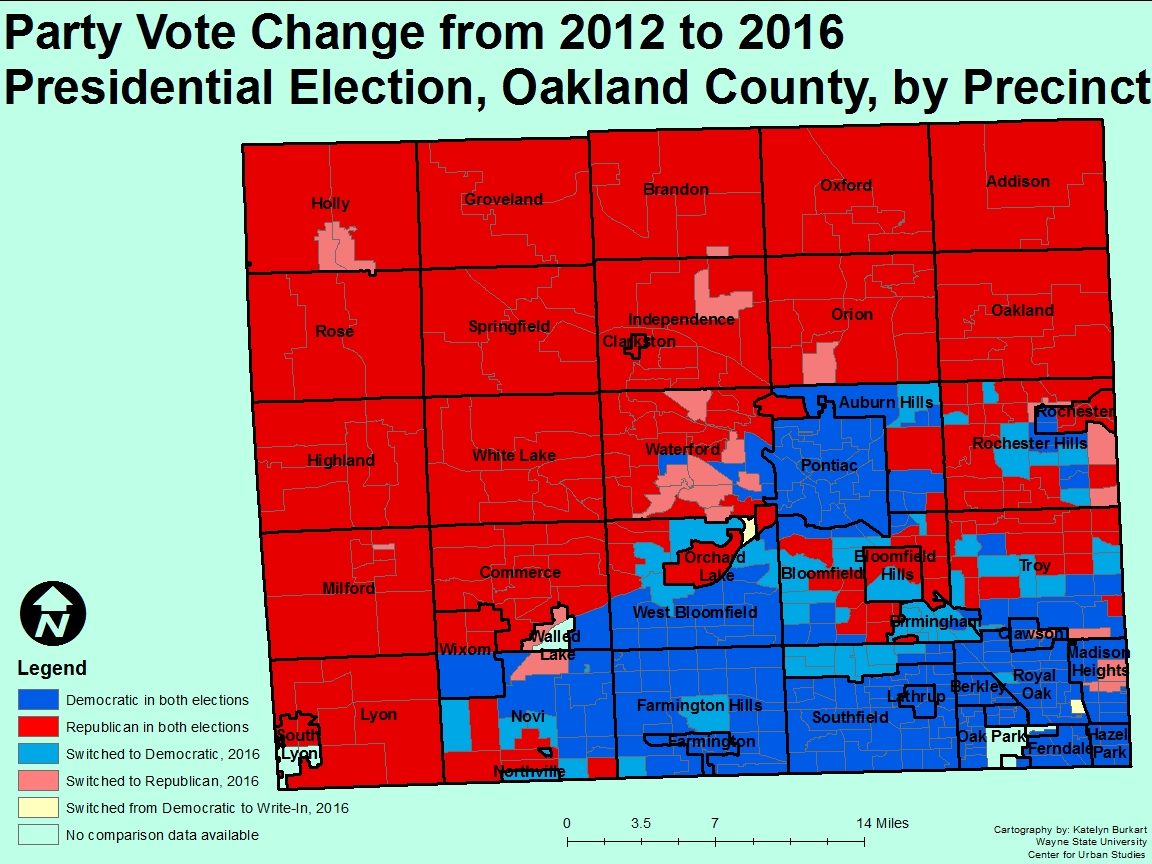
In Oakland County, overall, 44 percent of the voters voted for the Republican nominee (Trump) and 52 percent voted for the Democratic nominee (Clinton) in 2016, according to county elections results. In 2012 though there was a higher percentage of votes cast for both the Republican and Democratic nominees. In 2012 the Republican nominee (Romney) received 45 percent of the vote and the Democratic nominee (Obama) received 54 percent of the vote, according to county election results. In 2016, there were pockets of precincts-primarily in the Bloomfield-Birmingham area-that switched from Republican to Democratic. Birmingham though was the only municipality that switched nearly in its entirety. There were also about a dozen precincts that made the opposite switch (from Democratic to Republican) between the two most recent Presidential elections; those switches primarily occurred in the municipalities that have remained Republican in both elections.

oaklandmap

With the evident change between the 2012 and 2016 Presidential elections in Southeastern Michigan, we will embark on a detailed series showing not only where the change occurred, as we did in this post, but also how it relates to socioeconomic data, voter turnout and third party votes. Stay tuned for another post related to the 2016 election in the coming weeks.

Michigan’s gubernatorial voter turnout lowest since 1990

Slide02

Michigan’s voter turnout on Nov. 4, 2014 was the lowest in 24 years–41.6 percent. In 1990, voter turnout was 38.6 percent. Four years ago, during the previous gubernatorial race, turnout was 42.9 percent. Considering the data above, it is clear that more voters turn out during presidential elections than during gubernatorial elections—which, in Michigan, occurs during mid-term election years. Within the last 24 years, the highest voter turnout (50.7%) for a mid-term year was recorded during the 2006 general election, in which Gov. Jennifer Granholm, a Democrat, won a second-term.

Voter turnout in primary elections is even lower than in gubernatorial elections. For example, during this year’s primary election, statewide voter turnout was 17.5 percent. The last time it fell below that was in 2006, when only 16.9 percent of voters turned out in the primary.

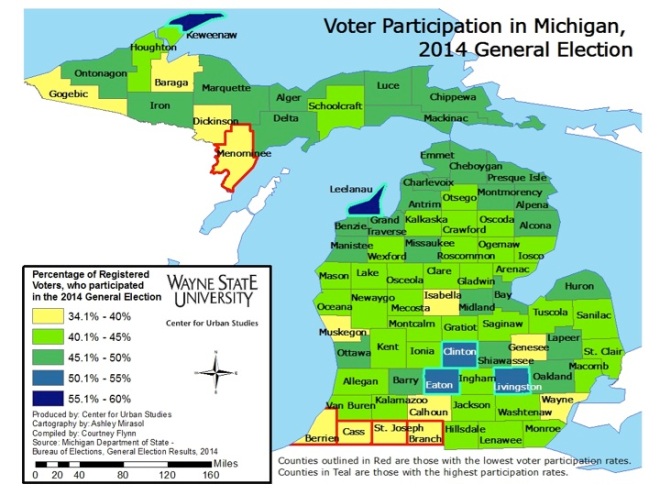
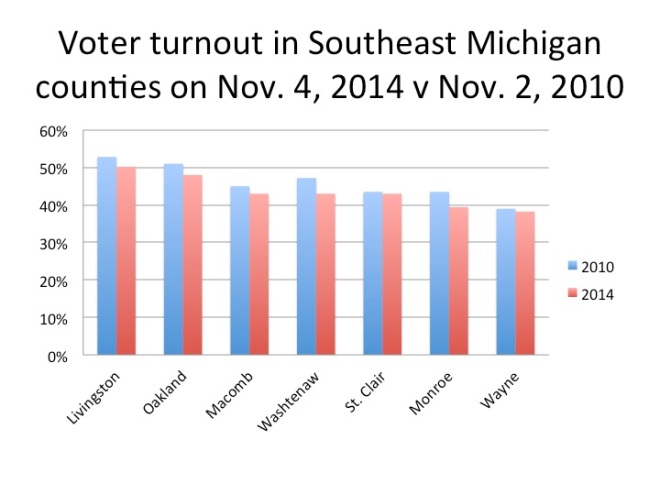
As shown in the map (below), though 2014 general election voter turnout for the entire state of Michigan was 41.6 percent, five of the seven counties in Southeast Michigan had a higher voter turnout. Of those seven counties, Livingston County had the highest voter turnout at 50.2 percent, and also one of the highest percentages of turnout in the state.

According to the Michigan Secretary of State, turnout in only five counties exceeded 50 percent. These top five counties are:

Keweenaw – 59.56% Leelanau – 56.52%   Clinton – 52.72%   Eaton – 50.81%   Livingston – 50.26%

Wayne County had the lowest percentage of voters turnout in the Southeast Michigan region for the 2014 general election (39.2%), but it did not make the list of one of the five counties with the lowest voter turnout in 2014 (it did in 2012 though). According to the Michigan Secretary of State, the five Michigan counties with the lowest voter turnout this November were:

Cass – 34.11%   Menominee – 34.16%   St. Joseph – 34.37%   Berrien – 34.95%   Branch – 35.94%

As seen in the map below, there were 13 total counties where voter turnout was below 40 percent on Nov. 14, 2014. This map also shows that majority of the state fell in the 40.1 to 45 percent range for voter turnout. In the northern part of the state (particularly the Upper Peninsula and the tip of the Lower Peninsula), the average was in the 45.1 to 50 percent range. Of course there were a few exceptions.

Slide04Slide05

Voter turnout in Wayne County and all the other counties in the Southeast Michigan region was lower than it was in 2010.

For Wayne County, the difference was rather minor, despite the fact the overall voter turnout was low. In 2010, 39 percent of registered voters cast a ballot, compared to the 38.23 percent who voted in 2014, according to records from Michigan Secretary of State.

Monroe County experienced the largest percentage difference. In 2010, 44 percent of registered Monroe County voters cast a ballot and in 2010, 39.4 percent did so—a 4.6 percent difference.

Washtenaw County had the second largest difference: voter turnout was 47 percent in 2010 and 43 percent in 2014, according to the Michigan Secretary of State.

Slide07

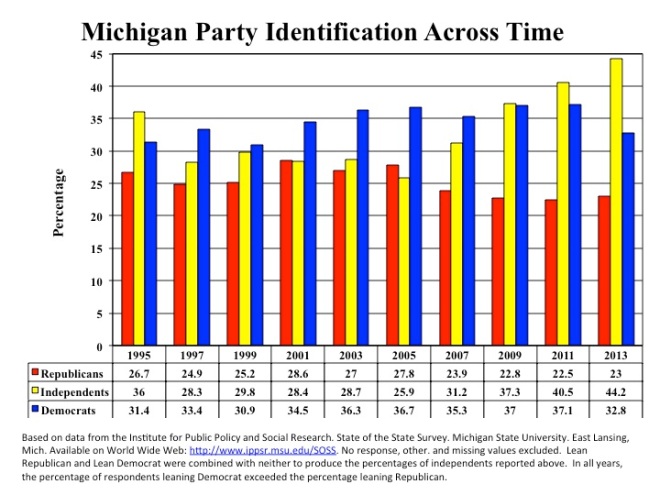
The above chart shows Michigan party identification from 1995-2013. When just comparing Democratic and Republican party identifications, Democrats have maintained an edge over Republicans for nearly two decades. For the decade between 1997 and 2007, Democrats outnumbered Independents as well as Republicans.

In 2013—the most recent non-election year for which data are available—the percentage of registered Michigan voters who identified with the Democratic Party remained higher than those who identified themselves as Republicans. That year, 33 percent of registered voters identified as Democrats; 44 percent identified as Independents, and 23 percent identified as Republicans.

The above chart is based on data from the Institute for Public Policy and Social Research. State of the State Survey. Michigan State University. East Lansing, Mich. Available on Web: http://www.ippsr.msu.edu/SOSS. The variables used were PartyID and sossyr and the data file used is the Longitudinal SOSS Data File. No response, other, and missing values are not included, hence totals do not equal 100%.

Turnout data demonstrate that young voters are among those least likely to vote in mid-term elections. We illustrate this effect in Michigan using Ann Arbor precinct data. (presented below) We have identified the Ann Arbor precincts with an especially high proportion of young, educated voters near the University of Michigan. (These show both the 2012 and 2014 turnout.) Ann Arbor’s precinct-level data reveals that these precincts where large populations of students live had exceptionally low turnout on November 4, 2014. Some of these precincts had 30 percent or more voter turnout in the 2012 presidential election, then had single-digit percent turnout in the 2014 general election. Each of these precincts with high concentrations of students had turnout of less than 15 percent.

There are confounding variables in using these data. Students who registered to vote in the 2012 election may have graduated and moved. But, it should be possible to register new student voters to replace those who have moved away if mobilization efforts are targeted effectively.

Slide10Slide11

In addition to examining the voter turnout near the U of M campus, we explore information from a Web site, CIRCLE, run by Tufts University that reports on research about young voters. According to Tufts, the takeaways related to young voters in this year’s election were:

Slide13

Changes in Detroit and tri-county State Representative characteristics after the 2012 Election

One of our recent posts examined several characteristics of the State Representatives who represented Detroit and the tri-county region (Oakland, Macomb, and Wayne) during the 2011-12 term.  In this week’s post, we compare the characteristics for legislators in the 2011-12 term to those who are currently serving.  This will illustrate some effects of the November election and the new apportionment plan for the state House. The other unique aspect of Michigan’s 2012 election was the transition to the state’s new apportionment plan.  As a result of this election, many new representatives now sit in the state House, 42 of whom represent districts in Detroit and the tri-county area. Here we will examine some characteristics of these 42 officials.

The tri-county area lost three districts as a result of the new apportionment plan (a district is considered to be in Detroit or the tri county area if the majority of the district is geographically within Detroit or one of the tri-county’s boundaries, respectively).  Detroit did not gain or lose any districts, although under the new apportionment plan, several Detroit districts no longer represent Detroit exclusively, and now contain portions of surrounding areas. According to the new plan there are now five districts that represent Detroit exclusively; last term there were nine.

Rep1

The chart above compares all 42 of the current representatives in the tri-county area to their 45 predecessors on the basis of four criteria: party affiliation, gender, membership in the legislative Black Caucus, and committee leadership (a legislator is considered a committee leader if he or she is the chair, vice chair, and minority vice chair on one or more state House committees.  This definition allows members of the minority party to be included).  Overall, the percentage of Democratic tri-county representatives has remained roughly the same, declining only somewhat after the 2012 election.  This slight decline occurred despite President Barack Obama’s electoral strength in the tri-counties.   A smaller percentage of women now represent the region compared to the previous term.  Furthermore, a smaller percentage of tri-county representatives are members of the legislative Black Caucus.  In contrast to these declines, however, a greater percentage of this region’s representatives serve as committee leaders during the 2013-14 term. Oakland, Macomb and Wayne counties, along with Detroit, all saw an increase in the number of representatives who entered their third term after the 2012 election; in turn there were fewer freshman entering. This means we can expect substantial turnover in the next term.

•A considerable majority (64%) of representatives are Democrats;
•Women constitute 24% of tri-county representatives;
•Only 21% are members of the legislative Black Caucus (membership in the legislative Black Caucus does not necessarily reflect racial identification;)
•The majority (57%) of tri-county representatives hold committee leadership posts during the 2013-14 term;
•Just over one third of Detroit’s representatives are now serving their third terms and exactly half are in their second terms.  The proportions are very similar for representatives in outlying tri-county districts, except that a greater percentage of freshman representatives (21%) are serving the region outside of Detroit.

In this chart, and the remainder of the charts in this post, the percentage of representatives that represent the specific criteria being examined correspond with the height of the bar. When looking at the number above each bar, that represents that number of representatives that make up each percentage.

Reps2

The increase in committee leadership is driven by the higher percentage of state representatives from Detroit who are now committee leaders. The chart above reveals the magnitude of this increase.  The chart also reveals that, as with the tri-county region as a whole, a smaller percentage of Detroit’s state representatives are women and members of the legislative Black Caucus.  As with the previous term, all state representatives of Detroit are Democrats.

Last term, Detroit had 12 representatives, three of whom served districts that were only partially in Detroit.  Of those three districts, one was not “majority-Detroit,” so there were 11 “Detroit districts” last term. This term, Detroit has 10 representatives, five of whom serve districts that are only partially in Detroit.  Of those five districts, two are not “majority Detroit,” so there are eight “Detroit districts” this term.

reps3

reps4

reps5

When we examine each of the counties individually, we observe additional changes.  The charts above show some exceptions to the broader shifts noted above.  They illustrate, for example, that Wayne County districts outside of Detroit lost committee leaders after the 2012 election.  They also show Oakland County is the only county to have lost Democratic representatives, and Macomb County remains the only area in the tri-county region not represented by a member of the legislative Black Caucus.

reps6

reps7

Another characteristic of state representatives is their length of service.  Michigan state representatives are constitutionally limited to three terms; therefore all representatives are in one of three stages of their state House careers.  After the 2012 elections, the percentage of first-term representatives from Detroit districts dropped substantially from 55 percent to 13 percent, while the percentage serving their third terms increased from 9 percent to 38 percent.  Half of the city’s state representatives are now in the second terms.

This situation is parallel to the one depicted for those tri-county representatives whose districts are outside of Detroit.  Here again, the percentage of freshmen dropped 20 percentage points, while the proportion of third-termers increased by 23 percentage points.

reps8

reps9

reps10

The charts above demonstrate that term of service proportions have moved in the same direction for Detroit and each of the counties in Metro-Detroit.   The percentages move in the same direction even when broken down by county.  The main exception is Macomb County, which saw an increase in second-term representatives after the 2012 election.  Taken together, the tri-county region will see a higher rate of retirement in 2014 than it saw in 2012 due to the higher proportion of third-term representatives.

Characteristics of Michigan State Representatives from the Metro Detroit Tri-County region

Michigan voters elect all 110 members of the state House of Representatives every two years.  Of these 110 members, 45 represent districts within the geographic boundaries of Macomb, Oakland, and Wayne counties.  One way to consider these legislators is to look at several key characteristics that reflect their demographics, political inclinations, and seniority.  This post examines five characteristics in particular: political party, gender, membership in the legislature’s Black Caucus, length of service, and committee leadership.


The chart above reveals that, of the 45 representatives from the region, 30 (two thirds) are Democrats and 14 (31.1%) are women.   Twelve representatives (26.7%) from the tri-county area are members of the legislative Black Caucus (which is not synonymous with racial identification, but rather certain ideological principles.), and 22 (48.9%) serve in a committee leadership position.  A legislator is considered a committee leader if s/he is a chairperson, vice chairperson, or minority ranking member of a committee.  This definition allows members of the minority party to be considered despite their inability to serve as committee chairs.

The chart above shows the length of service breakdown for the 45 tri-county representatives. The great majority (88.8%) of them are serving their first or second term(s), and are thus eligible to seek re-election in 2012 (The Michigan Constitution limits each member of the State House to three terms).

Another way to examine the characteristics of state representatives is to distinguish between those representing Detroit’s districts and those representing the other State House districts in the tri-county area.  The charts below consider this relationship.  (Note: a district is considered to be a “Detroit” district if the majority of the district is geographically within the boundaries of the city; the same reasoning is used for tri-county districts.)

All of Detroit’s 11 state representatives are members of the Democratic Party and the legislative Black Caucus. In the other tri-county districts, Democrats outnumber Republicans as well (55.9% to 44.1%),but only one representative is a member of the legislative Black Caucus.  A greater percentage of Detroit’s state representatives are women (44.5%,) compared to the outlying tri-county districts (26.5%,) and only two of Detroit’s state representatives (18.2%) serve as committee leaders, as opposed to 20 (58.8%) of their counterparts from the rest of the tri-county area.

The two charts above show that 54.5% of Detroit’s state representatives are serving their first term; that is, they were first elected in 2010.  A smaller percentage of representatives of other tri-county districts are “first-termers.”  In addition, only one Detroit state representative is serving a third term.  This represents 9.1% of the Detroit delegation, compared to the 11.8% of other tri-county state representatives who are serving their third term.

A third way to examine this data is to compare Detroit’s state representatives to those of Macomb, Oakland, and ‘outer’ Wayne counties individually, as seen below.

Democrats constitute a majority of state representatives in Detroit and outer Wayne County, but this is not so in Macomb and Oakland counties.  Women do not represent a majority of state representatives in any of these four geographical areas, although women constitute nearly half (45.5%) of state representatives in Detroit.  All of Detroit’s state representatives are members of the legislative Black Caucus, but only one Oakland County representative and no Macomb and outer Wayne county representatives are members of the caucus.  Of the four areas, outer Wayne County and Oakland County currently have the greatest number and percentage of committee leaders in the State House (66.7% and 61.5%, respectively), whereas only two committee leaders (18.2%) represent Detroit.

The above charts show the percentage of representatives from each of the four areas by their number of terms in the State House.  More than half of Detroit and Macomb County’s representatives are serving their first term, meaning they were first elected in 2010.  An earlier chart showed third term representatives are relatively rare in the tri-county area for the 2011-13 term.  The above charts reveal most of these third term representatives represent Oakland and outer Wayne Counties, although the absolute number (two representatives each) is small for both.