Southeastern Michigan’s Charter Authorizers rank below state averages academically

In Southeastern Michigan there were 15 charter school authorizers during the 2013-14 that were included in the state’s Top-to-Bottom (TtB) list; only one of which was ranked among the best (above 80). The TtB list is an accountability system that ranks Michigan schools based on student performance in math, reading, writing, science, social studies and graduation rates (24 total charter school authorizers were included throughout the state). This list allows for schools to be compared on the same scale, regardless of size. The charts below presents each authorizer’s portfolio as a single entity, rather than by individual schools, by a methodology developed by the Michigan Department of Education’s Bureau of Assessment and Accountability. Like schools and districts throughout the state the charter school authorizers are ranked on a scale of 1-100, 100 being the highest ranking.

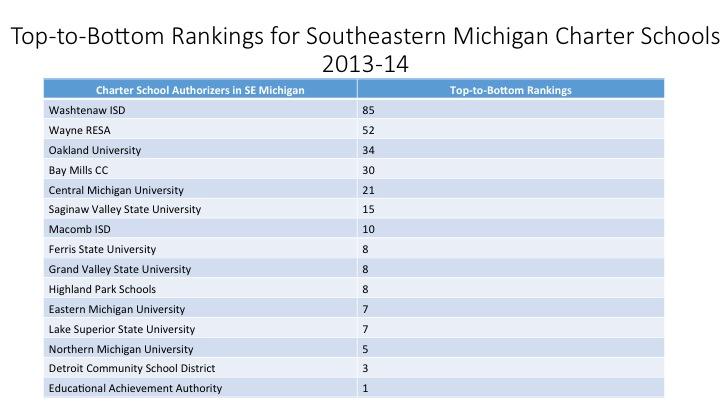
It was the Washtenaw Intermediate School District (ISD) that ranked at 85, being the only charter school authorizer to rank above 80 in the region. The only other charter school authorizer to even rank of above 50 in the region was Wayne Regional Education Service Agency (RESA), which ranked at 52.

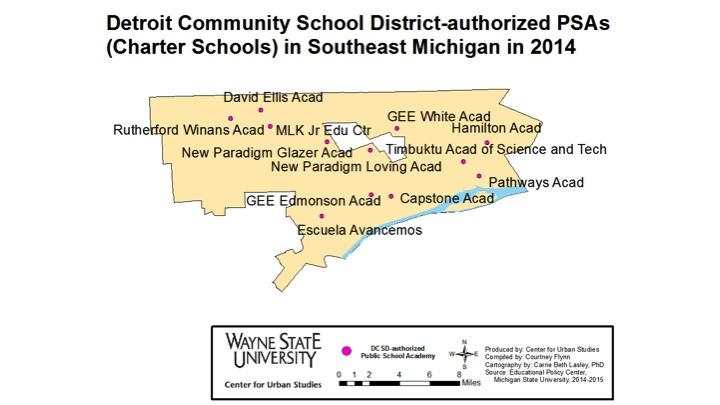
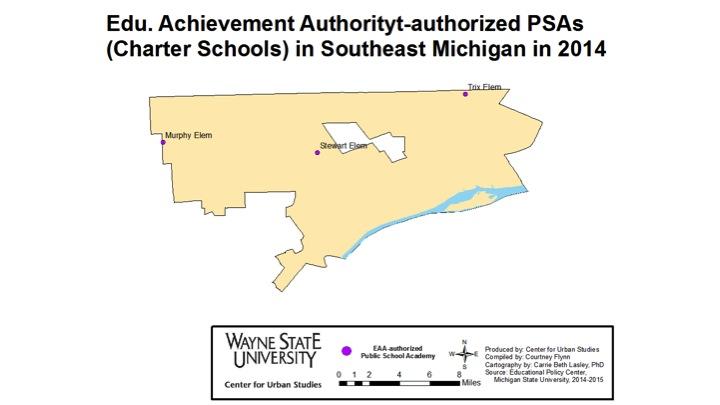
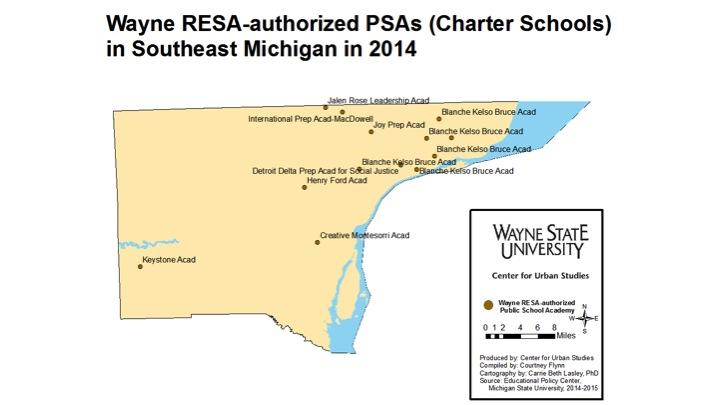
The Educational Achievement Authority, which authorizes several schools is the city of Detroit (click here for locations) was ranked the lowest authorizer in the region and among the lowest in the state with a ranking of 1 (Kellogg Community College and Muskegon Heights School District also received a 1).Top-to-Bottom Rankings
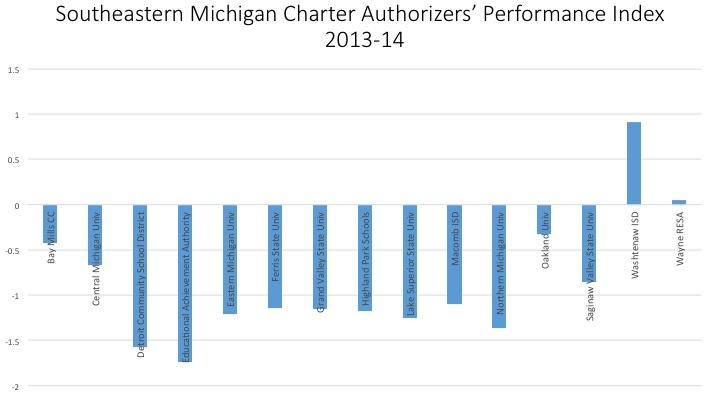
The Overall Performance Index uses an achievement index, which is a weighted average of two years of achievement data, and achievement gap index, which is a weighted average of two years of top/bottom 30 percent of students’ achievement data, according to the 2014 Michigan’s Charter School Authorizer Reporter. The negative scores show that authorizers whose performance index fell below the state average.

The only two authorizers that performed above the state average in the region were the Washtenaw ISD and Wayne RESA. The Washtenaw ISD ranked the third highest for its performance index score (.91) among the 24 authorizers. On the other end the Education Achievement Authority (-1.74) and the Detroit City School District (-1.57) ranked among the lowest authorizers, both in the region and throughout the state. The Muskegon Heights School District (-1.83) and Kellogg Community College (1.75) had the lowest performance index scores in the state.
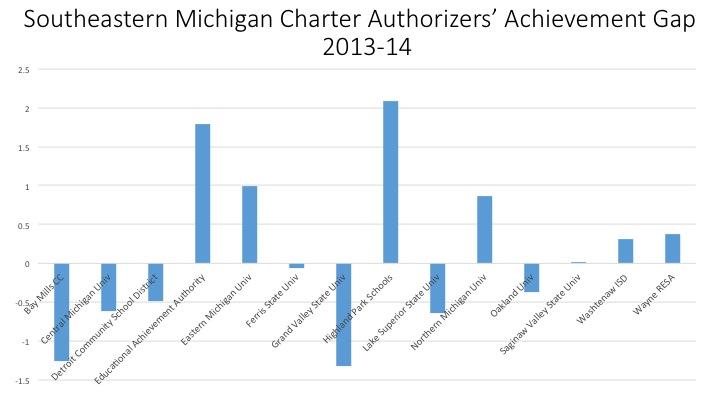
An achievement gap smaller than the state average is represented by a positive number and means that students in the top 30 percent of state standardized test scores perform at levels closer to the bottom 30 percent, according to Michigan’s Charter School Authorizer Report. It has also been described as the performance gap in a subject between the top 30 percent and bottom 30 percent of a student body. A positive number means that gap is smaller than the state average and a negative gap means that number is larger than the state average.

The achievement gap accounts for 25 percent of the TtB rankings and below we see that six of the authorizers with charter schools in the region have an achievement gap smaller than the state average. Authorizers with small achievement gaps, such as the Education Achievement Authority and Highland Park City Schools, are more likely to have a concentration of low or high proficiency rates, according to Michigan’s Charter School Authorizer Report.
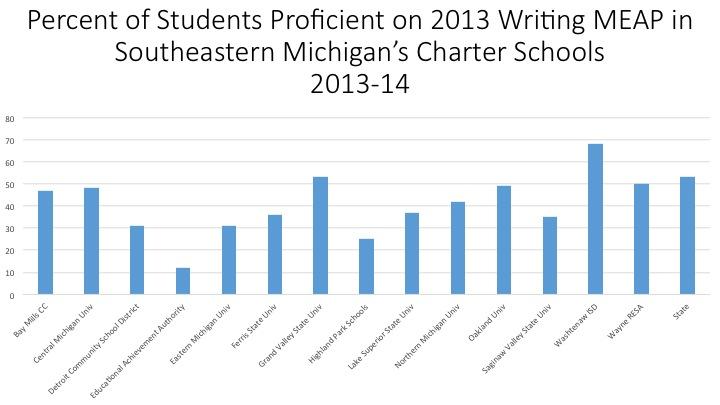
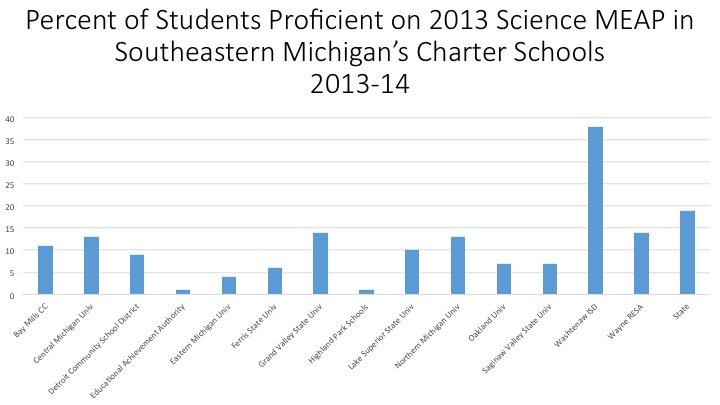
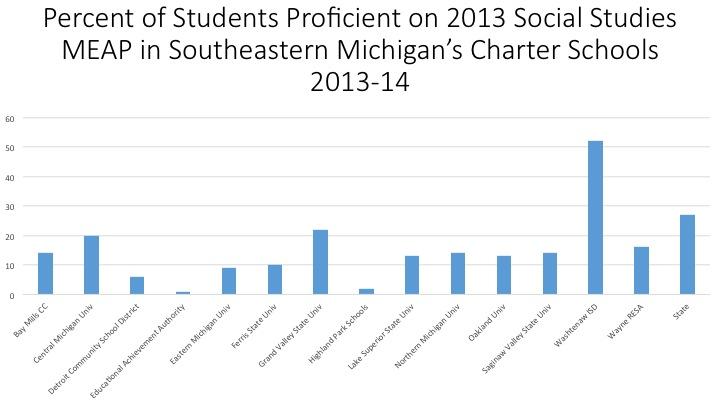
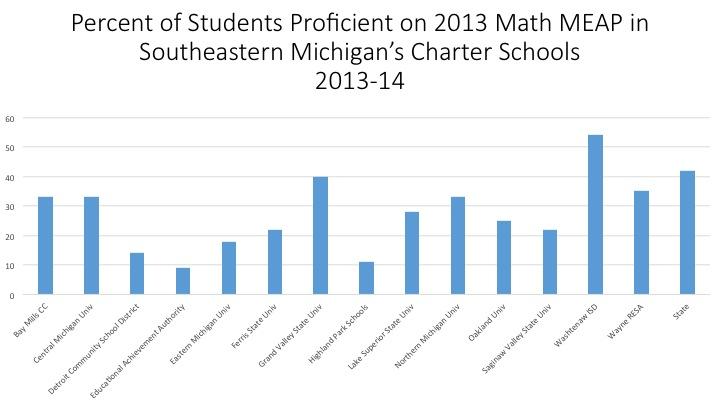
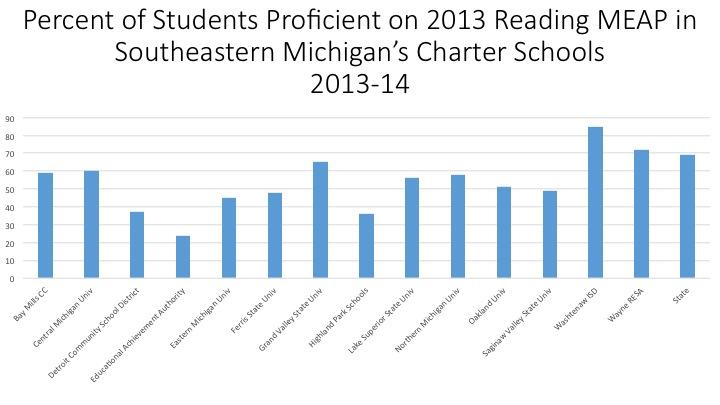
In the five charts below we see the percentage of students deemed proficient on the 2013 Michigan Education Assessment Program for the five subject areas students are tested on (math, reading, writing, science and social studies). The authorizers represented above all had charter schools existing in the region during the 2013-14 academic year. The Washtenaw ISD was the only authorizer in the region with students outperforming the state in all subject areas. Wayne RESA was the only other authorizer in the region with students outperforming the state on the 2013 MEAP; this authorizer outperformed the state average in reading.
The Detroit Community School District had the highest percentage of economically disadvantaged students at 88 percent. Eighty-five percent of students in the Highland Park, Educational Achievement Authority and schools authorized by Saginaw Valley State were economically disadvantaged. Schools authorized by Northern Michigan University had the lowest percentage of economically disadvantaged students at 27 percent.

The Michigan Authorizer report references the correlation between poverty and the percentage of African American students to proficiency rates on state standardized tests. There were no authorizers with schools in the region where more than 10 percent of the student population was economically disadvantaged that ranked above 50 on the TtB list.
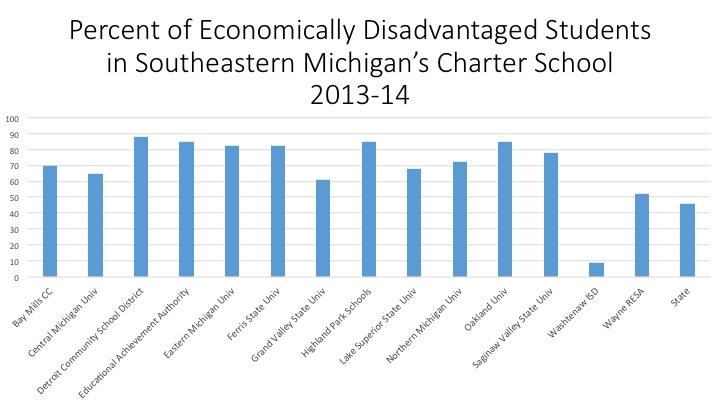
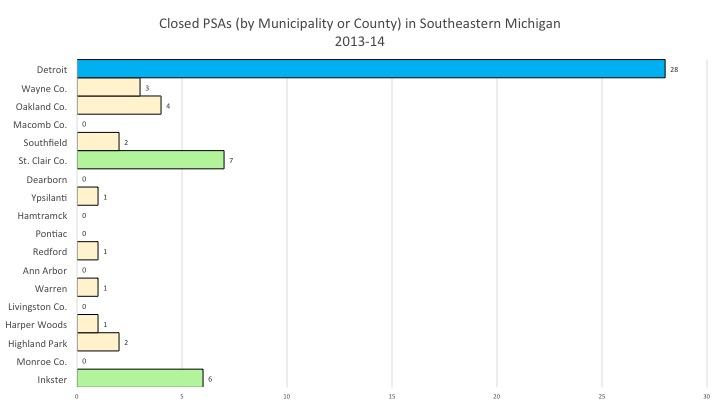
When reviewing the above information with our previous post we know that majority of charter schools in the 2013-14 academic year in the region were located in the City of Detroit and that the city also had the highest number of closed charter schools at 28. Additionally, we know Central Michigan University had the largest number of schools closed in the region. Although Central Michigan University didn’t rank lowest on the TbT list, it didn’t rank high. With a TbT ranking of 21 Central Michigan’s MEAP proficiency rates were all below the state average (9% below state average for math and reading; 5% below the writing average; 6% below the science average; 7% below the social studies average). Central Michigan University was 19 percent above the state average for economically disadvantaged students.

Of the authorizers with schools in the city only Wayne RESA had students outperformed the state standard, and that was in math. Still, when only looking at authorizers in the city of Detroit Wayne RESA had the largest number of shuttered charters at 8.

While standards for Michigan charter schools have gained more attention in recent years, the above information highlights that the charter school authorizers in the region fall below state standards when it comes to educational assessment. Former State Superintendent Mike Flanagan did say the state would suspend charter authorizers if they did not offer “high quality education options and cultivate better outcomes, especially for low income children.”

In June of 2014 it was announced that 11 charter authorizers were at risk of being suspended by the Michigan Department of Education. These authorizers were: Detroit Public Schools, Eastern Michigan University, the Education Achievement Authority, Ferris State University, Grand Valley State University, Highland Park Schools, Kellogg Community College, Lake Superior State University, Macomb Intermediate School District, Muskegon Heights Public Schools and Northern Michigan University. In 2015, 7 of those authorizers were removed from the list; those remaining are: Detroit Public Schools, the Education Achievement Authority, Highland Park Schools and Eastern Michigan University. What qualifications those authorizers had to meet to be removed from the list are unknown though, according to a Free Press article.
 

Michigan’s charter schools concentrated in Detroit

Michigan’s charter school system is widely becoming known as a for-profit business venture as well as another option for students to receive high quality education. With over 30 charter school authorizers and management companies throughout the state of Michigan, there is no question that the choice to send students to charter schools is there. However, there are questions over whether or not the academic foundations students need to in order to become successful are also there.

This is a two part post, and this week we will lay the foundation on charter schools in Southeastern Michigan, by showing where they were located in the 2013-14 academic year and detailing where and why others closed. Next week we will look further into the overall academic progress of some of Michigan’s charter school authorizers.

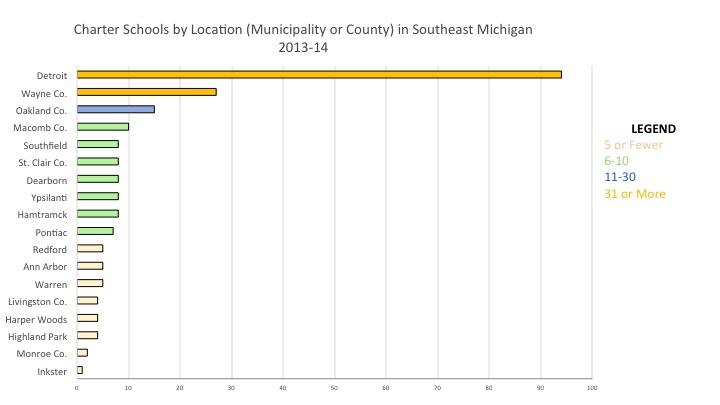
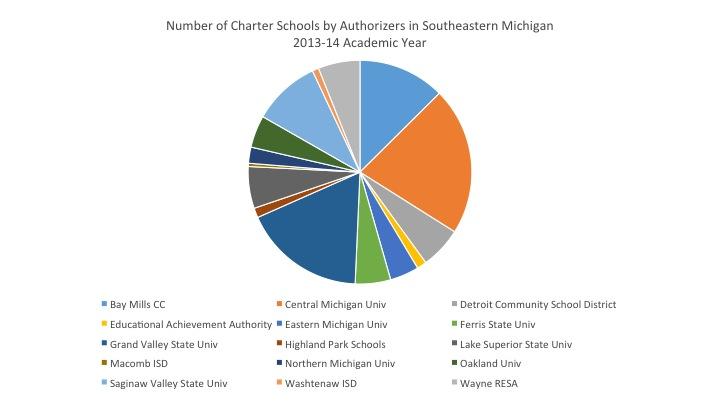
Of the 298 charter schools in Michigan during the 2013-14 academic school year. In total, there were 223 charter schools in the region during the 2013-14 school year. Of all the charters in the state, 31.5 percent (94 schools) were located in the city of Detroit, according to information from the State of Michigan and the Michigan Association of Public School Academies. Within Detroit itself, the majority of these schools were authorized by Grand Valley State University. Throughout the state of Michigan, the most common charter school authorizers are universities; regionally Central Michigan University operates the largest number of charter schools. As the oldest charter school authorizer in the state, CMU oversaw 46 charter schools in 2013-14, according to Michigan’s Charter School Authorizer Report from November 2014. Grand Valley State University had the second highest number at 38.

It wasn’t until 2012, the year following the state’s decision to remove the cap on the number of charter schools a university could authorize was removed, when several local school districts, intermediate school districts and community colleges also opened charter schools, according to Michigan’s Charter School Authorizer Report.

The for-profit and non-profit organizations that operate charter schools are known as Education Management Organizations (EMOs). Although exact information on the number of charter school management companies for the 2013-14 school year wasn’t available, we do know that there were more than 35 during the 2011-12 academic year, according to a 2013 report (link) by the National Education Policy Center at the University of Colorado. In this report, it states that Michigan had 33 for-profit EMOs operating charter schools, which operated 79 percent of Michigan’s charter schools. Non-profit organizations can also manage schools, as can the authorizers themselves. In July of 2014, former Michigan State Superintendent Mike Flanagan took a stance against charter school authorizers, stating he would exercise his authority to suspend them if they did not live up to the mission originally intended for charter schools, which is “to provide high quality education options and cultivate better outcomes, especially for low income children.”

Flanagan’s statement against charter school authorizers was prompted by the 2014 Detroit Free Press series that took a look at the state’s charter school authorizers, management companies and the way in which both utilize public tax dollars and educate children. The series showed that charter schools lack accountability, despite their use of public funds. This series was published following the 2012-13 academic year, and this post reflects on data from the 2013-14 academic year. However, the Free Press series was used for background purpose.

Below is a breakdown of the number of charter school authorizers in the region for the 2013-14.

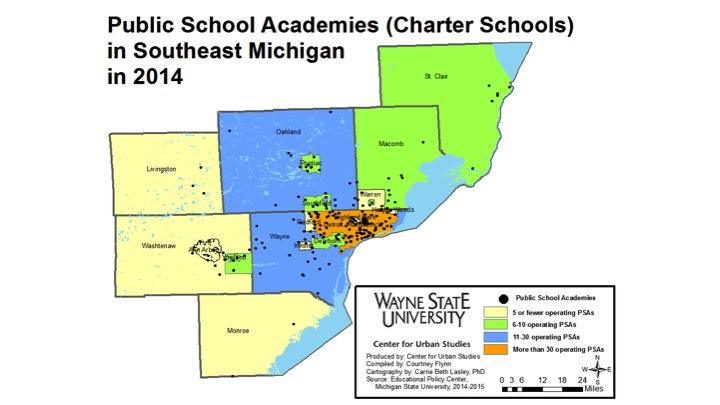
As noted, in Southeastern Michigan, the city of Detroit had the highest concentration of charter schools, with 94 (31.5%) operating in the city during the 2013-14 academic year. That year, 24 charter schools closed in Detroit, the highest number for any municipality in the state. Overall, 24.4 percent of all closed charter schools in the state of Michigan were located in the Detroit. Regionally, 42 percent of all charter schools in the state were located in Southeastern Michigan during the 2013-14 academic year, while 57.1 percent of the closed charter schools were from the region.

Southeastern Michigan Charter Schools by location

Just as the city of Detroit had the highest concentration of charter schools during the 2013-14 school year, it also had the highest number of closed charter schools at 28. Of the closed charter schools, Central Michigan University was the largest authorizer with 13 of its charter schools being shuttered in Southeastern Michigan for the 2013-14 school year. When looking at authorizers for just the city of Detroit though, Wayne RESA had the largest number of closed charters at 8. The reasons charter schools close ranges from lack of financial stability and enrollment to poor academics. For example, following the 2013-14 school year the closure of the Catherine Ferguson Academy, authorized by Wayne RESA, made headlines (add MI Public Radio link) because the academy, as the city’s dedicated high school to pregnant teens and moms, was closing because of lack of enrollment and funding. When examining a document produced by the state of Michigan listing all closed charters in the state, other reasons for charter schools closing include: poor academics, reorganization, lack of governance, leadership viability, the contract not being renewed, or the authority of an authorizer being revoked.

Despite charter schools closing for a variety of reasons, the 2014 Detroit Free Press report on charter schools shows that many authorizers leave poor performing schools open for a number of years. The focus of the DFP’s particular report was on schools authorized by Central Michigan University, and it highlighted how during a spot check of seven different charter schools during the 2012-13 academic year five were reauthorized despite a history of poor academic progress.

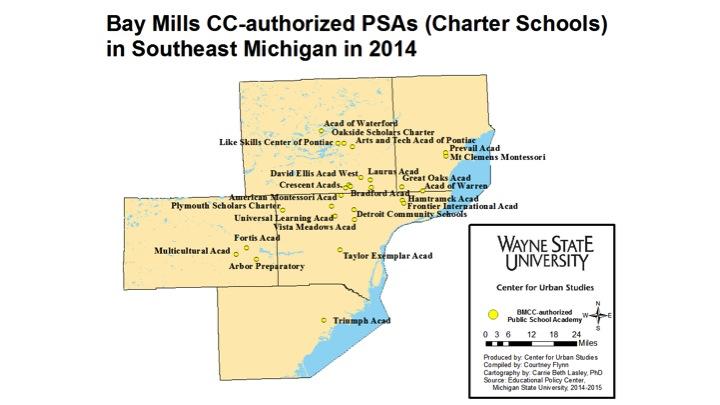
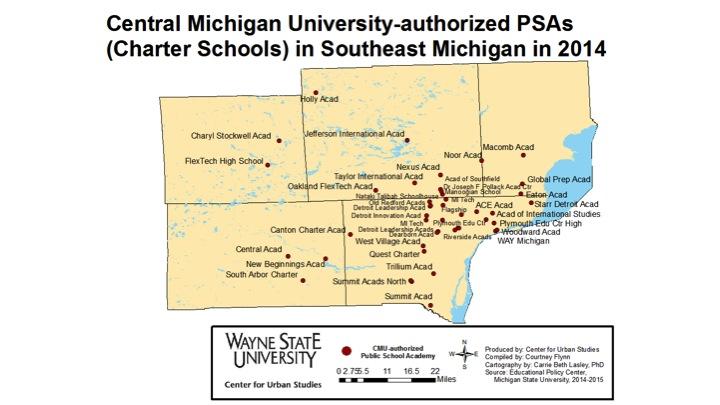
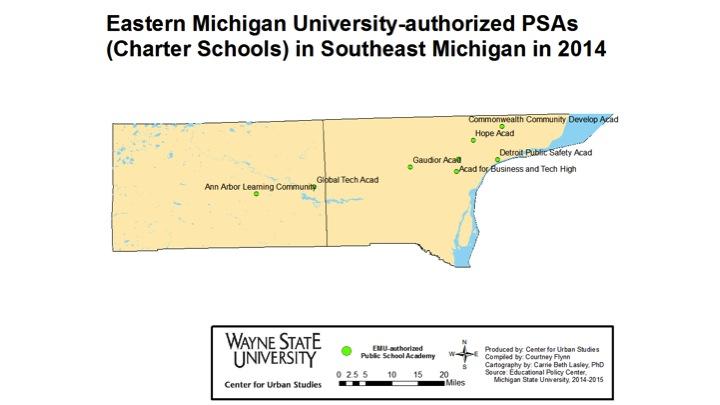
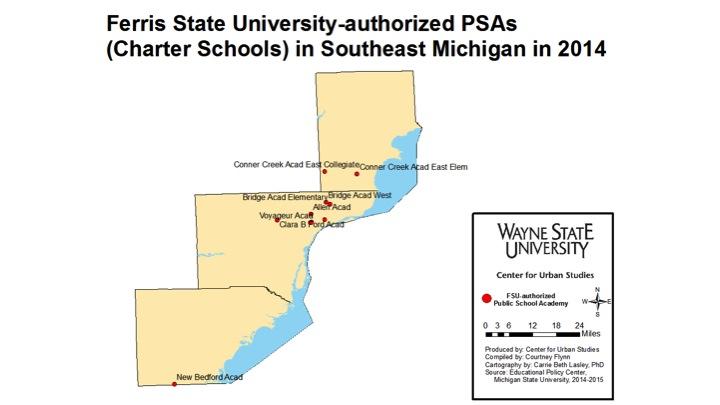
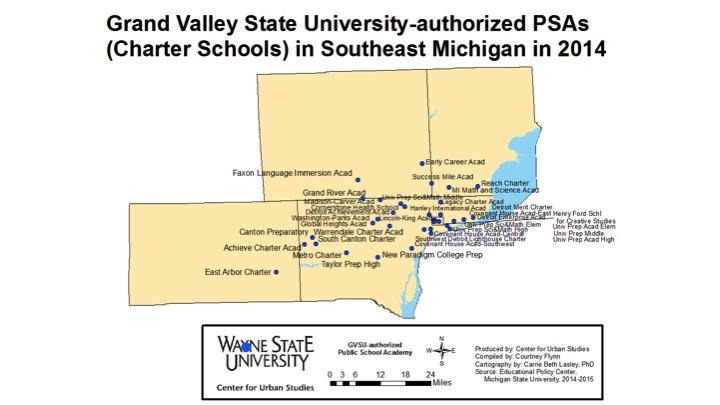
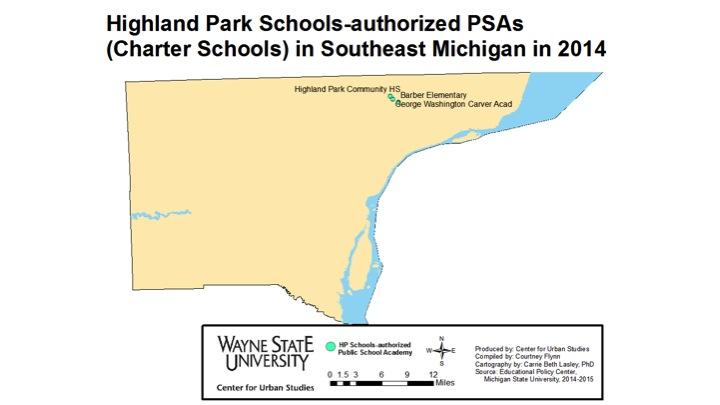
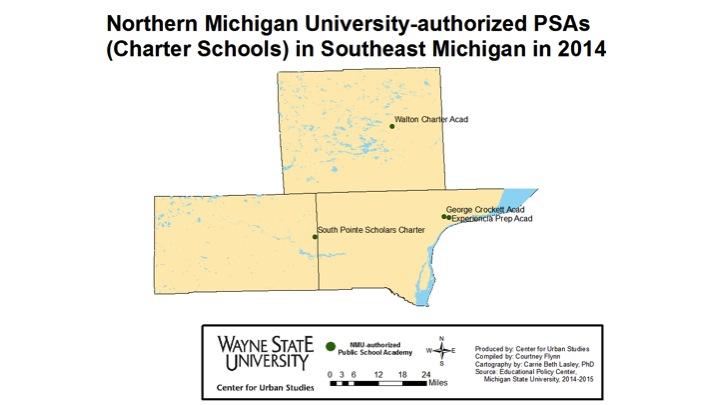
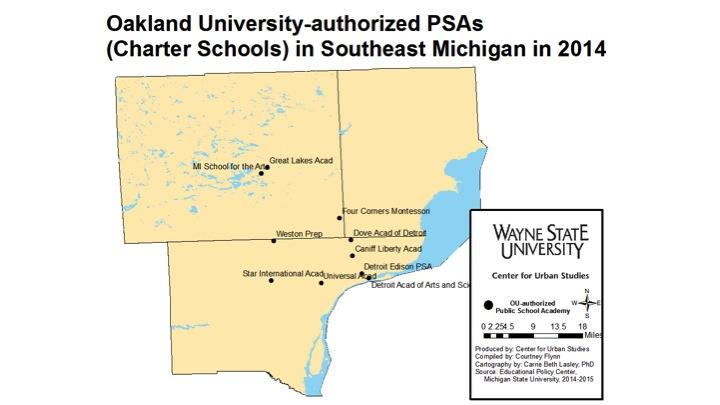
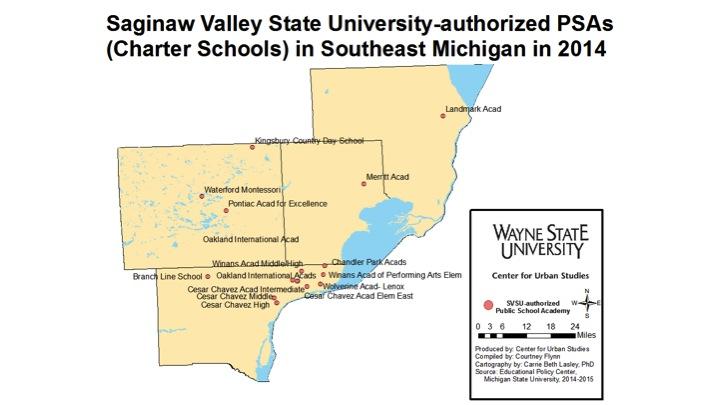
Below are individual maps for each charter school authorizer in the state that had schools operating during the 2013-14 academic year in Southeastern Michigan. As noted early on in this post, majority of the charter schools in the region were concentrated in Detroit, with Grand Valley State University being the largest authorizer in the Detroit.

Central Michigan University was the largest authorizer regionally, and throughout the state. Charter schools authorized by regional education services authorities (Wayne County) , an intermediate school district (Macomb and Washtenaw counties) or a city based educational authority (Highland Park, Detroit) remain only in that particular county/municipality. The charter schools authorized by public universities and community colleges, however, can stretch across counties.

Bay Mills CC Charter Schools in Southeastern Michigan Northern Michigan University Charter Schools in Southeastern Michigan Oakland University Charter Schools in Southeastern Michigan Saginaw Valley State University Charter Schools in Southeastern Michigan Wayne RESA Charter Schools in Southeastern Michigan

Charter schools were created as a means to provide additional educational choices to students. While the number of charter schools has increasingly grown throughout the state of Michigan and regionally (particularly after the cap for the number of charter schools a university can authorize was removed in 2011) the question on what type of choice these charter schools bring remains. Throughout this post we already saw schools are both shut down and kept open, despite poor academic performances. The Detroit Free Press series referenced in this post discusses charter schools’ lack of accountability, despite the fact they use public dollars to operate. Next week, we will look into the academic performances of Southeastern Michigan’s charter school authorizers and how these performances are associated with certain socioeconomic backgrounds.

Pontiac schools have lowest percentage of third-graders meeting state reading proficiency levels in 7-county region

Today kicks off “March is Reading Month” and with that comes a focus on the foundation that proficient reading skills can provide a person. A great deal of attention by educators and policymakers is often placed on third grade reading levels because experts believe a child’s ability to read at that time in their life can be a crucial indicator for their future success.

Additionally, in Michigan, Gov. Rick Snyder announced during his State of the State Address a $468 million proposal meant to increase reading proficiency in the State of Michigan. Part of this proposal includes a reading proficiency test for third-graders to better determine how their cumulative instruction has affected their reading skills, which would be separate than the Michigan Education Assessment Program (MEAP). However, the Governor has yet to release all the details behind this plan but in spring of this year we do know that the Michigan Test of Education Progress will replace the MEAP.

Currently in the State of Michigan, the Michigan Education Assessment Program (MEAP) is used to determine how students in grades three through 11 measure up to the educational expectations set by the State Board of Education. For all grade levels the state’s goal is to have 80 percent of all of Michigan’s third-graders reading at a proficient level, according to the State of Michigan.

With the extra attention currently being placed on reading proficiency in the State of Michigan, we chose to examine the percent of third and fourth-grade students who were deemed proficient on the MEAP reading exams in 2013-2014. The MEAP tests are given in the fall of every academic year, so we show both the third and fourth-grade reading proficiency percentages to provide readers a better understanding of where students’ reading skills, in accordance with state standardized testing levels, were at the beginning and end of third and fourth grade. On the state’s education website, mischooldata.org, fourth-grade reading MEAP scores are used on the dashboard for each school as a student outcome measure.

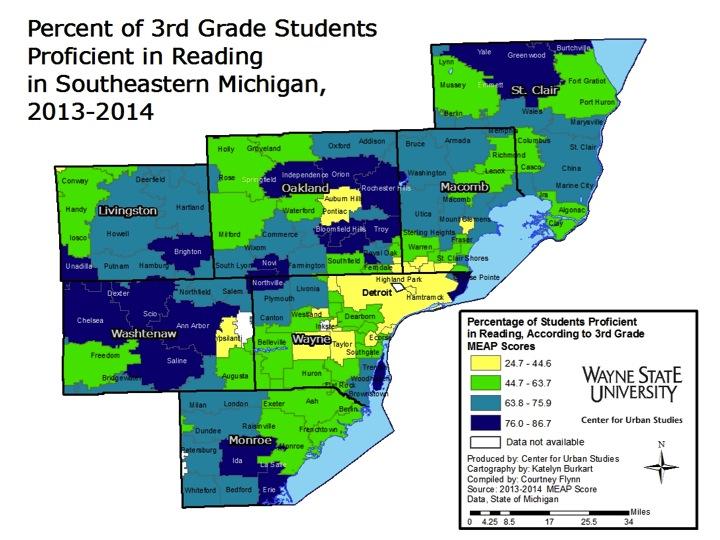
For the 2013-14 school year, 61.3 percent of Michigan’s third-graders were deemed proficient in reading. When looking at this map we see several pockets of school districts where third-graders either performed at this level or below. In total, there were 53 school districts where less than 61.3 percent of the third-grade students were deemed proficient in reading. According to the Michigan Department of Education proficiency levels for the 2013-14 MEAP exam are determined as follows: “the 2011-2012 proficiency rate for each school and district in every subject [is] subtracted from the end 85 percent proficiency target rate for the 2021-2022 school year. That number [is] then divided by ten (the number of years between the 2011-2012 and 2021-2022 school years) to determine the annual increment for the subject target rate. This increment is added to the 2011-2012 subject proficiency rate and then again each year leading up to the 2021-2022 school year.” The proficiency rate varies from district to district but the percent deemed proficient, which is shown in the maps in this post, presents the percentage of students we met these standards.

Pontiac School District in Oakland County had the lowest percentage of third-graders who met the proficiency standards at 25.7 percent. Detroit City School District had the eighth lowest percentage at 35.3 percent.

On the opposite end of the spectrum during the 2013-14 school year, Grosse Ile Township Schools had the highest percentage of third-graders deemed proficient on the reading portion of the MEAP; 86.7 percent of those students were considered proficient.

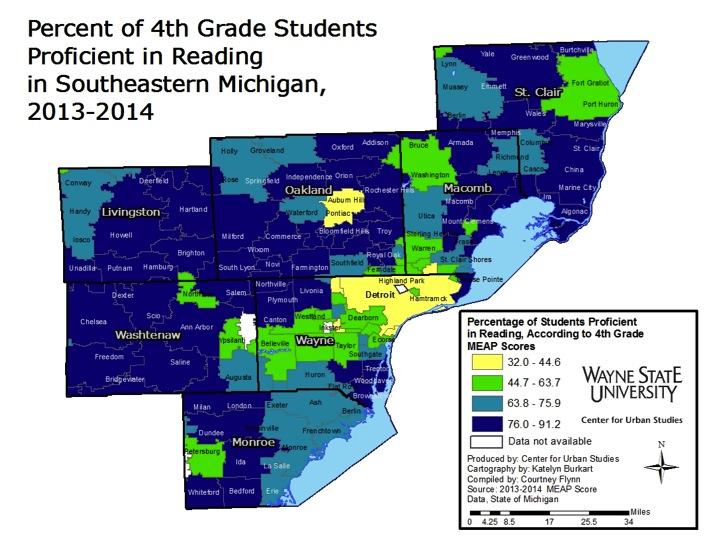
Seventy percent of Michigan fourth-graders were deemed proficient in the 2013-14 school year on the MEAP reading examination. In total, there were 49 school districts below the state’s proficiency level during the time frame examined.

Again, the Pontiac School District had the lowest percentage of students deemed proficient in reading in the region (32%). The Detroit City School District had the sixth lowest percentage of all the districts in the region, with 42 percent of its students meeting the proficiency level.

Northville Public Schools had the highest percentage of students who met the reading proficiency levels (91.2%). Grosse Ile Public Schools came in third in the region, with 90.3 percent of their fourth-graders meeting proficiency levels.

Wayne and Macomb counties have highest percentage of students eligible for free and reduced lunch

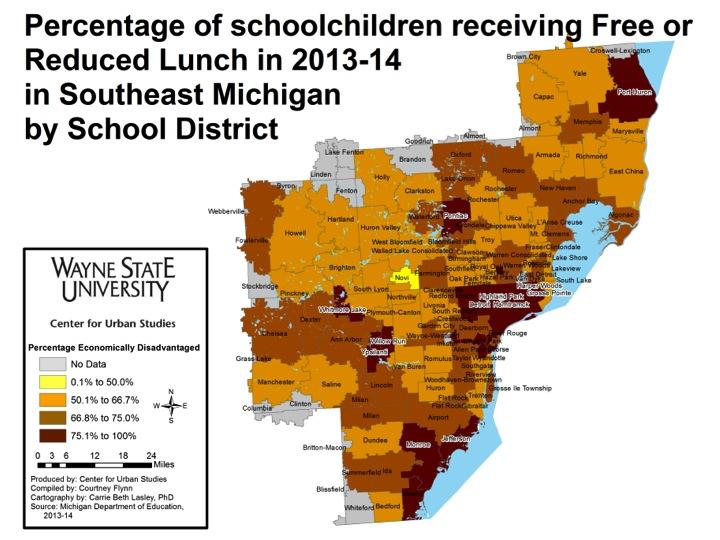
Just as individuals in Michigan are eligible for the U.S. Department of Agriculture’s Supplemental Nutritional Assessment Program (SNAP) program, children in economically disadvantaged families are eligible for nutritional assistance while attending school. Based on the annual income of a child’s family, he or she is eligible for such nutritional assistance through the free and reduced lunch program. In this post, we examine the percentage of students who are eligible for this program in each district and the percentage of students who actually receive the benefit.

First though, we outline what those eligibility standards were in the state of Michigan for the 2013-14 school year. According to the Michigan Department of Education, economically disadvantaged students are those who are eligible, according to the chart shown below, to receive free and reduced lunch benefits through the U.S. Department of Agriculture.

Scale for Free Meals or Free Milk Scale for Reduced Price Meals
Total Family Size Annual Monthly Annual Monthly
1 $14,937 $1,245 $21,257 $1,772
2 $20,163 $1,681 $28,694 $2,392
3 $25,389 $2,116 $36,131 $3,011
4 $30,615 $2,552 $43,568 $3,631
5 $35,841 $2,987 $51,005 $4,251
6 $41,067 $3,423 $58,442 $4,871
7 $46,293 $3,858 $65,879 $5,490
8 $51,519 $4,294 $73,316 $6,110
For each additional family member add:
$5,226 $436 $7,437 $620

Slide03 Slide04

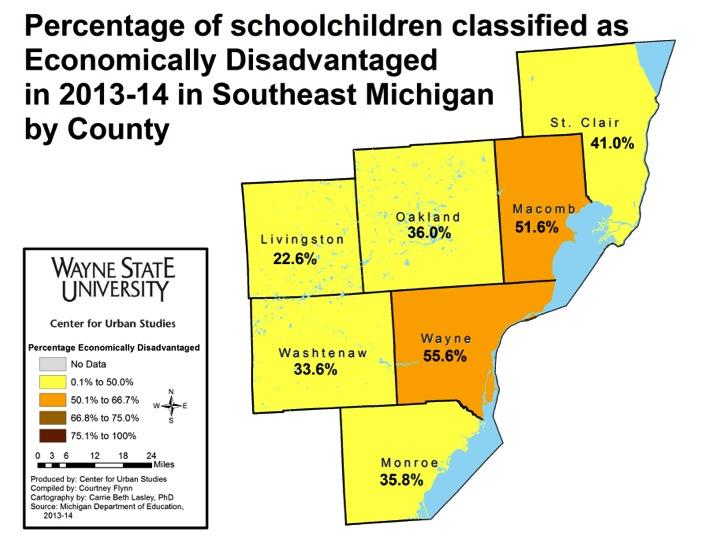
In the region, Wayne County had the highest percentage of students eligible for free and reduced lunch at 55.6 percent.

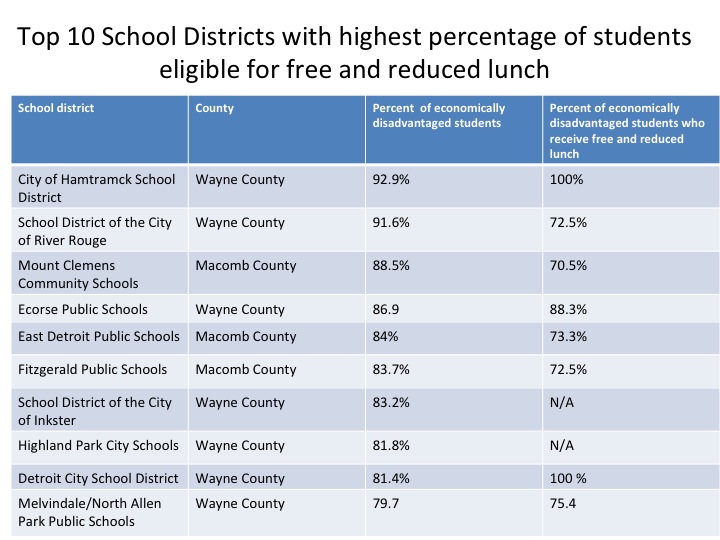
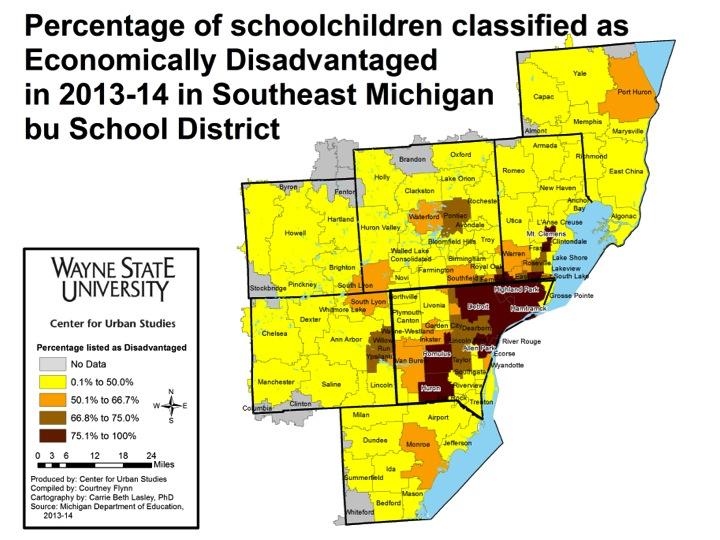
Within Wayne County, the School District of the City of Hamtramck had the highest percent of eligible students at 92.9 percent.

Overall, 19 of the 34 public school districts in Wayne County had 55.6 percent or more of their student populations eligible for free and reduced lunch during the 2013-14 school year. Of those 19, eight of the school districts had 80 percent or more of the students eligible for free and reduced lunch benefits and of those eight, two districts had 90 percent or more of the students eligible.
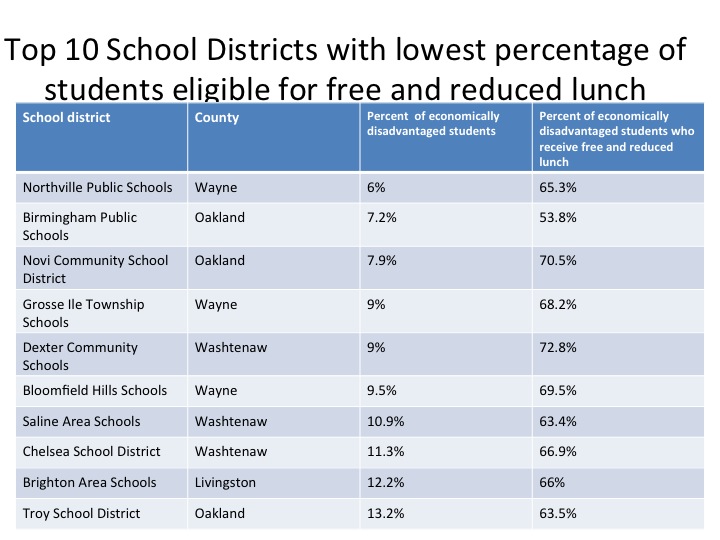
On the opposite end of the spectrum, Northville Public Schools had the lowest percent of students eligible at 6 percent, followed by Grosse Ile Township Schools at 9 percent. There were only four school districts in Wayne County where 20 percent of less of the student population was deemed economically disadvantaged.

In Macomb County, which had the second highest percentage of free and reduced lunch eligible students in the region at 51.6 percent, there was not one district where 20 percent or less of the student population was eligible for free and reduced lunch. Ten of the 21 school districts were above 51.6 percent county average though, with Mount Clemens Community Schools having the highest percentage at 88.5 percent.

Livingston County had the lowest county average of eligible students at 22. 6 percent. With only five public school districts, Howell Public Schools had the highest percentage of eligible students at 29.6 percent and Brighton Area Schools had the lowest at 12.2 percent.

Overall, Wayne County had the most number of school districts in the top 10 with the highest percent of students eligible for free and reduced lunch while Wayne, Oakland and Washtenaw counties each had three districts in the top 10 with the lowest percent of eligible students. It is notable that among those districts with lowest percentages of eligible students, a substantially lower percent of those eligible actually received benefits.

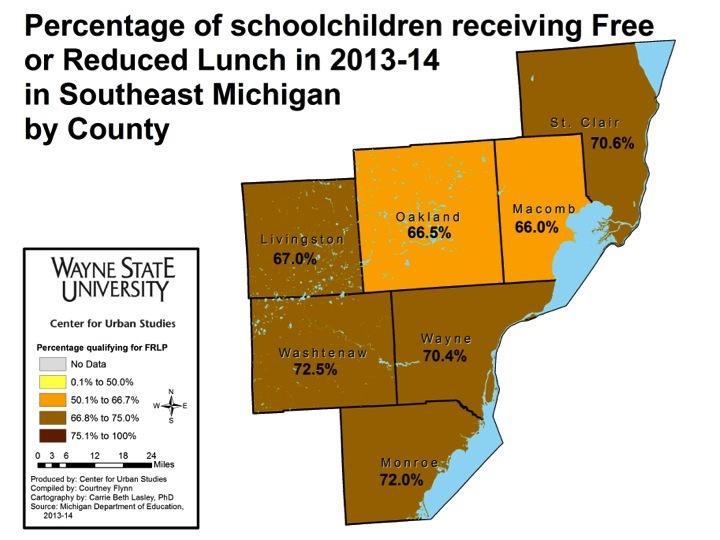
Although a student may be eligible for free and reduced lunch benefits, it does not mean they receive them. The two maps above show the percentage of eligible students who collected these benefits.

For this, Washtenaw County had the highest percentage of students who collected these benefits. In Washtenaw County, 33.6 percent of the student population was considered economically disadvantaged and of that, 72.5 percent of the students collected the benefits they were eligible for. Students in Ypsilanti Public Schools had the highest percentage of eligibility in the county at 68.9 percent and the second highest collection rate at 78.9 percent. In Willow Run Community Schools 100 percent of the eligible students (68.3 percent of the student population) received free and reduced lunch.

In Macomb County, although it had the second highest percentage of students eligible for free and reduced lunch benefits, it had the lowest percentage of students who received the benefit (66 percent). Armada Area Schools, which had the lowest percentage of students eligible for such benefits in the county (21.4 percent) also had the lowest percentage of students who received them (54.9 percent). East Detroit Public Schools had the highest percent of students who collected free and reduced lunch benefits at 73.3 percent although 84 percent of the student population was eligible for such benefits.

The School District of the City of Hamtramck, which had the highest percentage of eligible students in the region at 92.9 percent, had 100 percent of those students receive benefits. In Wayne County, the only other district where 100 percent of the eligible students collected free and reduced lunch benefits was Westwood Community School District; 69.9 percent of these students were eligible.
 

Wayne State, UofM and MSU draw most students from local regional

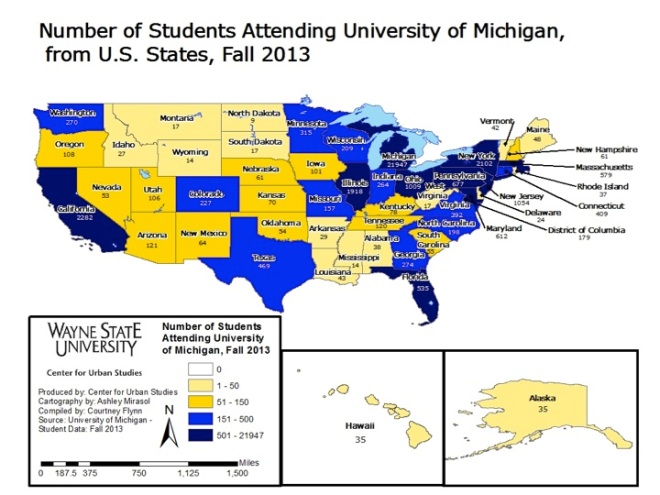
There are three universities in the state of Michigan that make up the University Research Corridor, an alliance committed to transforming and diversifying the state’s economy. These three universities are the only public universities in the state to have their governing bodies appointed by the voters of the State of Michigan. These universities are Wayne State University (WSU), the University of Michigan (UofM) and Michigan State University (MSU). This post aims to show where students who attend these universities come from within the state, country and across the nation.
Slide03Slide04Slide05

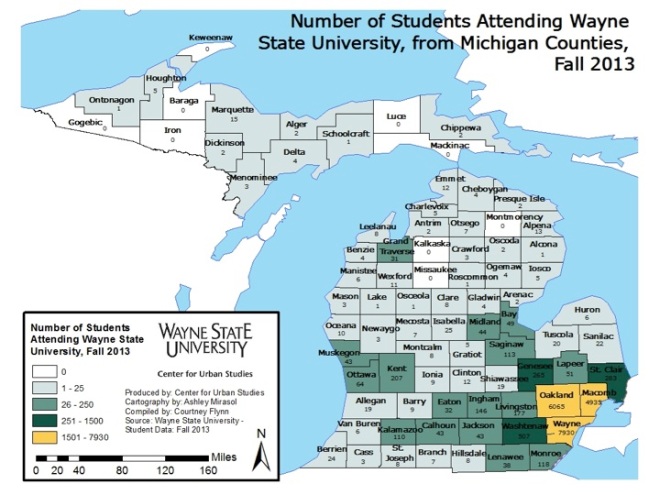
In looking at all three maps, it becomes obvious that WSU’s population is largely representative of residents from the tri-county area (Wayne, Oakland and Macomb Counties). As WSU is historically a commuter school centered in Detroit, this reflects what one would expect. In fall of 2013, about 7,900 of the students who enrolled at WSU lived within Wayne County. During that same time, there were about 6,000 students from Oakland County and about 4,900 from Macomb County. Although Washtenaw County is still within the Southeastern Michigan region, only 507 students were from there; Washtenaw County residents represented the fourth largest population in the state.

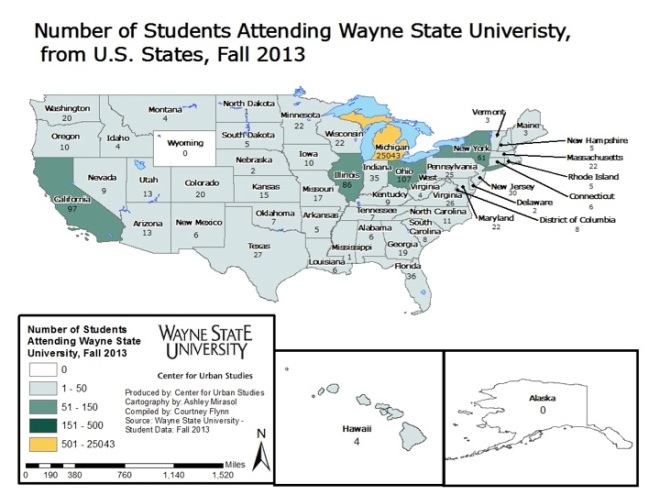
Just as geographic representation decreased the farther away one got from Wayne County within the state, the same continued for states outside of Michigan. Ohio and California were the two states mostly highly represented in fall of 2013 with 107 and 97 students, respectively, coming from each. These two states, individually, had more representation at WSU than some counties in Michigan, such as Jackson and Ionia to name a few.

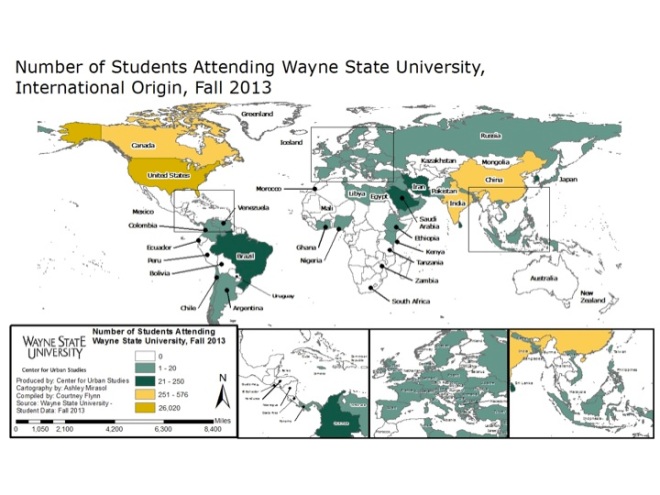
When looking at the geographic makeup of WSU on a global scale, aside from the United States, Canada had the largest population with 576 students and China had the second largest representation with 332 students. There are 26,020 students, including both graduate and undergraduate students, who attended Wayne State in fall of 2013 who were from the U.S.

Overall, enrollment in fall of 2013 was recorded at 27,897 students. Of that, 25,043 (89%) were from within the state of Michigan, 977 (4%) were from another state and 1,877 (7%) were from another country.

Slide07Slide08Slide09

Similar to Wayne State University, much of the University of Michigan’s student population came from Wayne, Oakland, Washtenaw or Macomb Counties. For UofM, however, the representation of Washtenaw County residents, where UofM is located, was five times higher than those who attend WSU. Conversely, WSU had more than twice the number of Wayne County residents than UofM.

Although both universities largely drew from the same geographic locations in state, UofM had a much greater overall representation of students from across the state. At WSU, there were some counties with no representation, but at UofM, every Michigan county was represented. Keeweenaw and Oscoda Counties had the lowest in-state representation at 1 student.

When looking at the representation from across the country, UofM out-did both WSU, and as you will see below, Michigan State University. In fall of 2013, UofM enrolled 15,704 students from across the country (not including Michigan); this represented 36 percent of the student population. Illinois was the state with the largest representation; 1,918 students from there attended UofM in fall of 2013. Only nine students from the state of North Dakota enrolled in UofM at the state time, making it the state with the least representation.

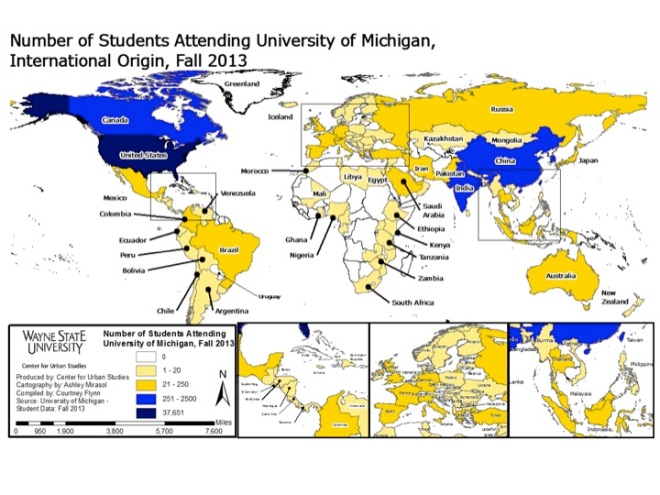
On an international scale, China was the most represented with 2,334 students enrolled at UofM for fall of 2013. The international population at UofM during this time represented about 14 percent of the student body.

Overall enrollment at UofM during this time was 43,710; 37,651 of those students were from the U.S.

Slide11Slide12Slide13

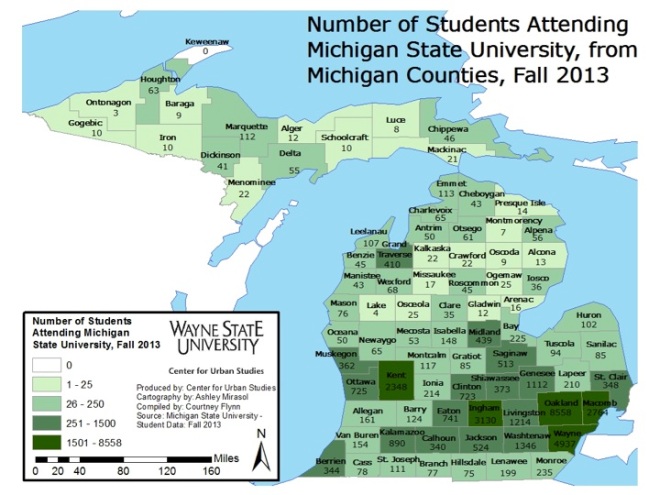
Unlike UofM and WSU, where the largest geographic representation comes from the universities’ home counties, Michigan State University drew the majority of students from outside of the region it is located in (Ingham County). Like its sister schools, Wayne, Oakland, Macomb and Washtenaw counties were heavily represented. From in-state, Oakland County was the most represented with 8,558 students. There were 4,937 students from Wayne County who attended MSU in fall of 2013, 2,764 from Macomb County and 1,364 from Washtenaw County. There were 3,130 students from Ingham County, where MSU is located, who attended the university; this was more than those sent from Macomb and Washtenaw Counties. Kent County was also highly represented with 2,348 students attending MSU in fall of 2013.

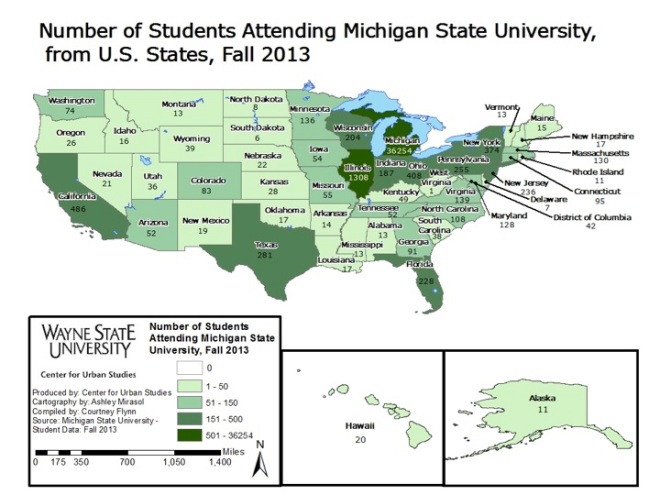
When looking at enrollment from out-of-state residents, Illinois again had the highest representation with 1,308 students. West Virginia had the lowest with one student. Overall, the out-of-state student population at MSU in fall of 2013 represented 11.6 percent of the student body.

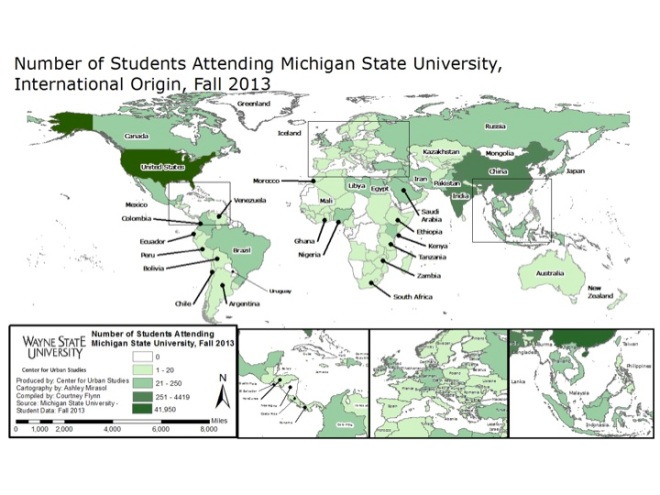
In 2013, 4,419 students from China attended MSU, making it the country with the highest representation, aside from the U.S. The international population at MSU during fall of 2013 represented about 15 percent of the student body.

Overall, in fall of 2013 enrollment at MSU was 49,292; the number of full-time students from the U.S. was 41,950.

For this data set, MSU only counted all full-time students.

Slide15Slide16

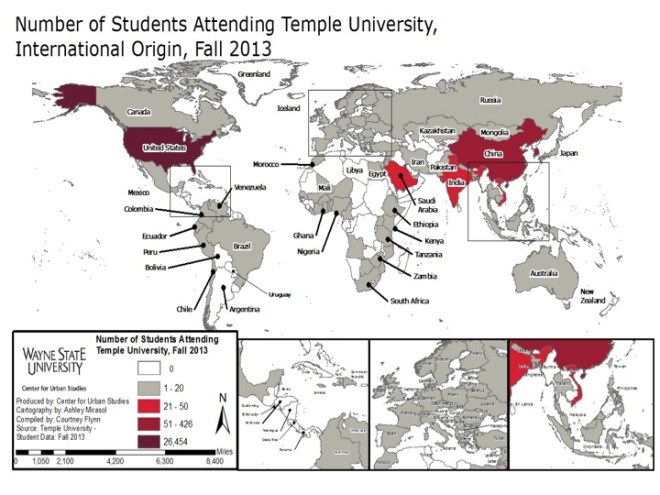
In comparison, above is a map that shows where students who attended Temple University in Philadelphia, Pennsylvania in fall of 2013 originally resided. This university was chosen because it is located in a similar environment as WSU and typically has similar enrollment numbers.

Temple University had 38,148 students enrolled in fall of 2013, of whom 22,318 were from Pennsylvania. The state of New York had the highest out-of-state representation with 564 students.

Overall, the Temple student population of only undergraduate students was 26,454 and the overall student undergraduate population was 27,514.

For the purpose of this post, Temple was the only school to only count undergraduates for its student population.

Gap exists between pre-k and kindergarten in Southeastern Michigan

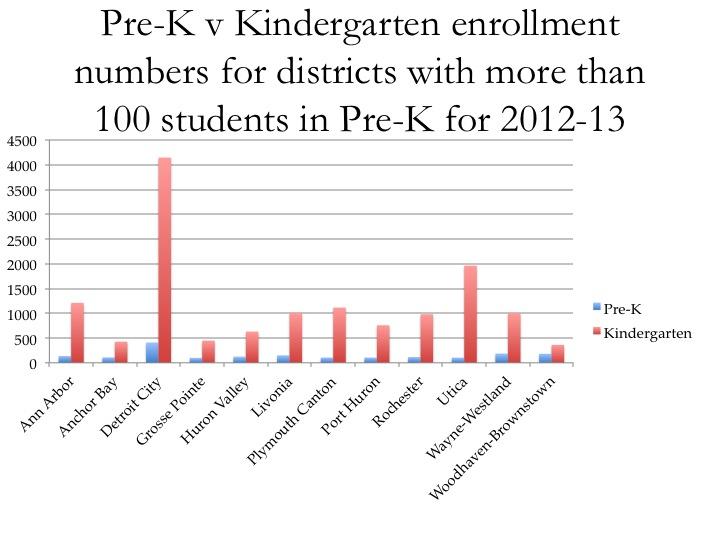
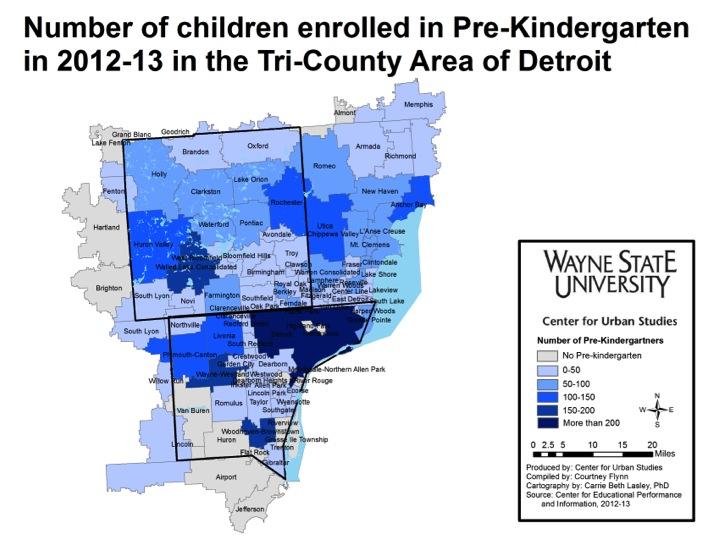
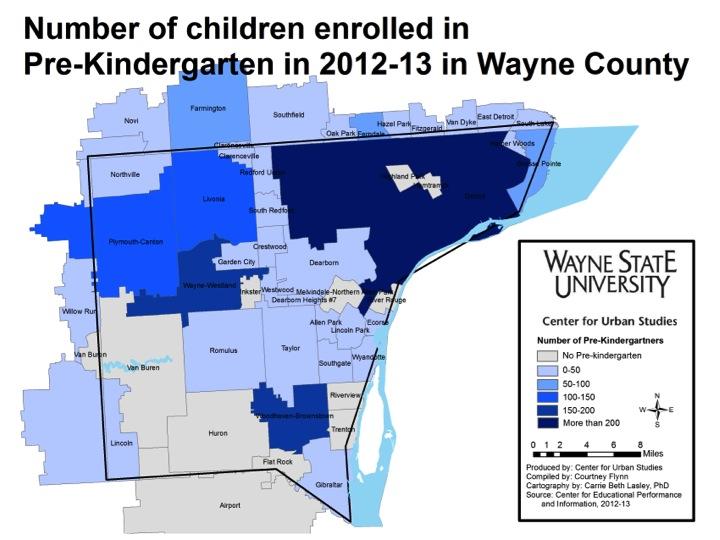
A quick glance at the numbers seems to state the obvious: pre-kindergarten (pre-k) numbers are highest in areas with the highest population. However, a closer look shows in certain circumstances, this is not the case. Rather, the larger issue appears to be the gap that exists between the number of children enrolled in pre-k versus the number of children enrolled in kindergarten.

It should also be noted there are several school districts throughout the region that do not offer pre-kindergarten through the public school district. This occurs not only in the region, but throughout the state because Michigan does not mandate pre-k, despite the positive effects shown by participation in the program.

In this post we examine the number of students enrolled in pre-k classes and kindergarten classes across the region to show where gaps exist.

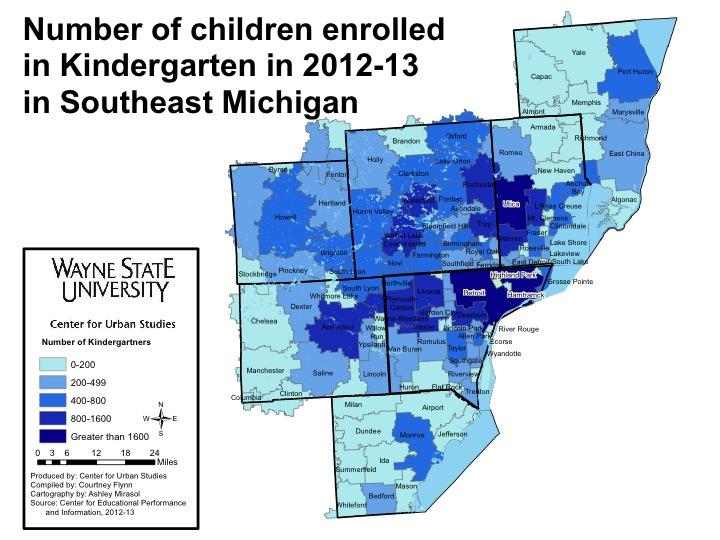
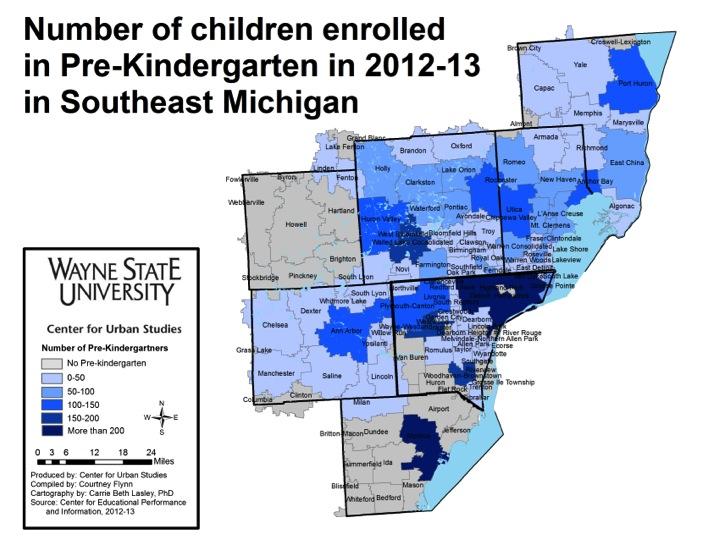
As noted above, there are several districts in the region that do not offer pre-kindergarten classes. The majority of these districts are located in the more rural areas, such as Monroe and Livingston counties. St. Clair County, which is also rural, has low participation in pre-k. The Port Huron and East China school districts are the only districts within St. Clair County with more than 50 children enrolled in pre-k. The Port Huron School District covers both the city of Port Huron and Port Huron Township, while the East China School District welcomes students from Marine City, the city of St. Clair, St. Clair Township, China Township, East China Township and Cottrelleville Township. Even though the East China district covers so many communities, it only had about 25 more children participate in pre-kindergarten than larger single community school districts like Dearborn City Schools. In Dearborn, 30 students were enrolled in pre-kindergarten from 2012-13 and in East China 56 students were enrolled.

The Village of New Haven, which has a smaller population than the City of Dearborn and many of the townships encompassed by the East China School District, had 85 students enrolled in pre-kindergarten. The Great Start Readiness Program, which is a larger feeder for pre-k programs, is based on income eligibility. According to the guidelines, households trying to enroll children in the pre-k through this program need to be at at least 100 percent of the poverty level. This shows why districts such as the New Haven Schools enroll more students per capita than places such as Anchor Bay School District (both are located in Macomb County).

Both the chart and map above show how large the gap is between pre-k and kindergarten enrollment. Even in the Detroit City Public Schools, which had the highest pre-k enrollment in the region at 409, kindergarten enrollment (4,144) was 90 percent higher.

The importance of pre-k enrollment cannot be overstated. Research has shown that it has effects on students’ readiness to learn in elementary school and beyond. According to the Center for Public Education, children who participated in pre-k, rather than being in daycare, scored better on math and reading exams later in life. As noted before, pre-k is not mandated in the State of Michigan.

In 2012, The Bridge Magazine wrote a series of stories for their feature piece “The Forgotten 30,000.” These articles detail the importance of pre-k education and discuss the gap between pre-school and kindergarten attendance. Even with Michigan’s $65 million reinvestment in the Great Start Readiness Program, it is clear that hundreds of children in Southeast Michigan are not receiving the early education that many feel is necessary for greater academic success later in life.

A closer look at the National Assessment of Education Progress (NAEP)

We noted in a previous post that students in Michigan and Detroit post weaker performances on the National Assessment of Educational Progress (NAEP) than states across the country, particularly Minnesota. For many years, researchers have attempted to identify factors associated with NAEP scores, which would be of considerable interest to stakeholders who want to address Michigan and Detroit’s NAEP performance. Here, we will briefly summarize some of these factors and selected research addressing them.

For several reasons, NAEP scores in mathematics and reading have been of primary interest to researchers. Much of the research on NAEP score predictors, therefore, focuses on performance in these two subject areas.

Given the primacy of demographic factors such as race, ethnicity, and gender in education research, researchers have also asked whether these variables might predict students’ NAEP performance. For example, Vanneman et al. (2009) and Hemphil & Venneman (2011) noted achievement gaps in NAEP mathematics scores between African-American and White students and between White and Hispanic students. A number of peer-reviewed studies also identify race as a factor in NAEP results (Tate, 1997; Fuchs & Reklis, 1994; Thomas & Stockton, 2003). Some studies explore this factor at a greater depth; for example, Card & Rothstein (2007) attribute the race/ethnicity gap (though using SAT, not NAEP scores) to racial segregation of particular geographic areas, while Lubienski (2006) finds that varying test modes for NAEP mathematics appears to have little or no impact on performance.

There is less evidence for the influence of gender on NAEP scores (Abedi & Lord, 2001; Tate, 1997; Hyde & Linn, 2006; Guthrie et al., 2001), though Thomas and Stockton (2003) identify a small positive relationship between female students and NEAP reading scores and McGraw and colleagues (2006) find a negative relationship between female students and NAEP mathematics scores.

The results are also fairly consistent for socioeconomic status (SES). Biddle (1997) and McQuillan (1998) find a negative relationship between poverty and NAEP scores while Abedi & Lord (2001) and Nelson et al. (2003) find a negative relationship between Free lunch/Aid to Families with Dependent Children (AFDC) status and NAEP scores. Byrnes (2003) and Fuchs & Reklis (1994) find a positive association between parental education levels and students’ 12th and 8th grade NAEP math scores, respectively. Using 1996 NAEP data, Lubienski (2002) finds that SES factors such as parent education and number of literary resources in the home do not explain the African-American/White achievement gap discussed above. Inherent in these studies is, of course, the selection and validity of individual-level or school-level (e.g., Title I designated school) definitions of SES (Thomas & Stockton, 2003).

Some researchers have also considered other literacy-related factors and their possible effect on NAEP scores. For instance, Abedi et al. (2001) and Abedi and Lord (2001) find that English Language Learner (ELL) and Limited English Proficiency (LEP) statuses are negatively related to NAEP mathematics performance. Length of stay in the United States appears to be positively associated with NAEP mathematics performance (Abedi et al., 2001). Access to printed reading material (McQuillan, 1998) and access to school and public libraries (Krashen et al., 2012) also appear to be positively associated with NAEP reading scores.

In general, coursework and related preparation seem to be consistent predictors of NAEP scores. Tate (1997), Abedi & Lord (2001), and Abedi et al. (2001) find that advanced mathematics preparation and coursework are positive predictors of NAEP math scores. Guthrie et al. (2001) and Pinnell et al. (1995) find that reading opportunities and reading prosody, respectively, are positively associated with NAEP reading performance. Abedi et al. (2001) find evidence of a positive association between students’ overall grades since 6th grade and NAEP mathematics performance.

Some authors have considered more systemic or institutional factors in their NAEP research, though this research is less consistent and (less?) extensive. Lubienski (2006) finds a positive association between NAEP math scores and (1) collaborative problem-solving instruction, (2) teacher knowledge of National Council of Teachers of Mathematics (NCTM) standards, and (3) certain ‘reform-oriented’ teaching practices such as non-number math strands. Guthrie (2001) finds that balanced reading instruction is positively associated with Grade 4 NAEP Reading Comprehension in Maryland. Grissmer et al. (2000) and Fitzpatrick (2008) find that greater levels of Kindergarten and pre-Kindergarten participation are positively associated with NAEP scores. Carnoy & Loeb (2002) find a positive association between gains in NAEP mathematics results and strength of state accountability (based on high-stakes testing to sanction and reward schools), but no effect on 9th grade retention rates. In a study supported by the American Federation of Teachers (AFT), Nelson et al. (2003) find that charter school attendance, especially in autonomous charter schools in urban areas, are negatively associated with NAEP math and reading test scores. Nevertheless, institutional factors such as these are not definitive in the literature, and their results should be viewed with caution.

Those who are interested in understanding why Michigan and Detroit students lag behind the rest of the nation in NAEP scores might explore some of the variables discussed above. There is not, however, any one variable or combination of variables that appears to serve as a sole and consistent predictor of NAEP performance, and this will pose a challenge for both understanding and devising solutions to the matter.

Bibliography

Abedi, J. & Lord, C. (2001). The language factor in mathematics tests. Applied Measurement in Education 14(3), 219-234.

Abedi, J., Lord, C., & Hofstetter, C. (2001). Impact of selected background variables on students’ NAEP math performance. Center for the Study of Evaluation, University of California, Los Angeles.

Biddle, B.J. (1997). Foolishness, dangerous nonsense, and real correlates of state differences in achievement. Phi Delta Kappan 79(1), 8-13.

Byrnes, J.P. (2003). Factors predictive of mathematics achievement in white, black, and Hispanic 12th graders. Journal of Educational Psychology 95(2), 316-326.

Card, D. & Rothstein, J. (2007). Racial segregation and the black-white test score gap. Journal of Public Economics 91(11) 2158-2184.

Carney, M. & Loeb, S. (2002). Does external accountability affect student outcomes? A cross-state analysis. Educational Evaluation and Policy Analysis 24(4), 205-331.

Fitzpatrick, M.D. (2008). Starting school at four: The effect of universal pre-kindergarten on children’s academic achievement. The B.E. Journal of Economic Analysis & Policy 8(1) 1-38.

Fuchs, V.R. & Reklis, D.M. (1994). Mathematical achievement in eighth grade: Interstate and racial differences. National Bureau of Economic Research. Working Paper No. 4784.

Grissmer, D., Flanagan, A., Kawata, J., & Williamson, S. (2000). Improving Student Achievement: What state NAEP test scores tell us. RAND Corporation.

Guthrie, J.T., Schafer, W.D., & Huang, C.W. (2001). Benefits of opportunity to read and balanced instruction on the NAEP. Journal of Educational Research 94(3), 145-162.

Hemphil, F.C. & Vanneman, A. (2011.) Achievement gaps: How Hispanic and white students in public schools perform in mathematics and reading on the national assessment of educational progress. Statistical Analysis Report. NCES 2011-459. National Center for Education Statistics.

Hyde, J.S. & Linn, M.C. (2006) Gender similarities in mathematics and science. Science-New York Then Washington 314(5799), 599.

Krashen, S., Lee, S., & McQuillan, J. (2012). Is the library important? Multivariate studies at the national and international level. Journal of Language & Literacy Education 8(1), 27-36.

Lubienski, S.P. (2002). A closer look at the black-white mathematics gaps: Interactions of race and SES in NAEP achievement and instructional practices data. Journal of Negro Education 71(4), 269-287.

Lubienski, S.P. (2006). Examining instruction, achievement, and equity with NAEP mathematics data. Education Policy Analysis Archives 14(14), 1-33.

Mcgraw, R., Lubienski, S.P., & Strutchens, M.E. (2006). A closer look at gender in NAEP mathematics achievement and affect data: Intersections with achievement, race/ethnicity, and socioeconomic status. Journal for Research in Mathematics Education 37(2), 129-150.

McQuillan, J. (1998). The literacy crisis: False claims and real solutions. Portsmouth, NH: Heinemann.

Nelson, F.H., Rosenberg, B., & Van Meter, N. (2003). Charter school achievement on the 2003 National Assessment of Educational Progress. American Federation of Teachers, AFL-CIO.

PInnell, G.S., Pilulski, J.J., Wixson, K.K., Campbell, J.R., Gough, P.B., & Beatty, A.S. (1995). Listening to children read aloud: Data from NAEP’s integrated reading performance record (IRPR) at grade 4. National Center for Education Statistics.

Thomas, J. & Stockton, C. (2003). Socioeconomic status, race, gender, & retention: Impact on student achievement. Essays in Education 7.

Tate, W.F. (1997). Race-ethnicity, SES, gender, and language proficiency trends in mathematics achievement: An update. Journal for Research in Mathematics Education 28(6), 652-679.

Vanneman, A., Hamilton, L., Anderson, J.B., & Rahman, T. (2009). Achievement gaps: How black and white students in public schools perform in mathematics and reading on the National Assessment of Education Progress. Statistical Analysis Report. NCES 2009-455. National Center for Education Statistics.

Middle school students also show slow progress in MEAP testing

Last week, we examined the MEAP scores for students in grades three through five in the intermediate school districts located within the seven-county region as well as the Detroit Public Schools. This week, we will examine the MEAP scores for students grades six through nine within the same region. As our earlier post showed, progress for students in grades three through five was slow. This week’s post, however, shows more promising results, with the exception of seventh-grade reading and sixth- and ninth-grade social studies.

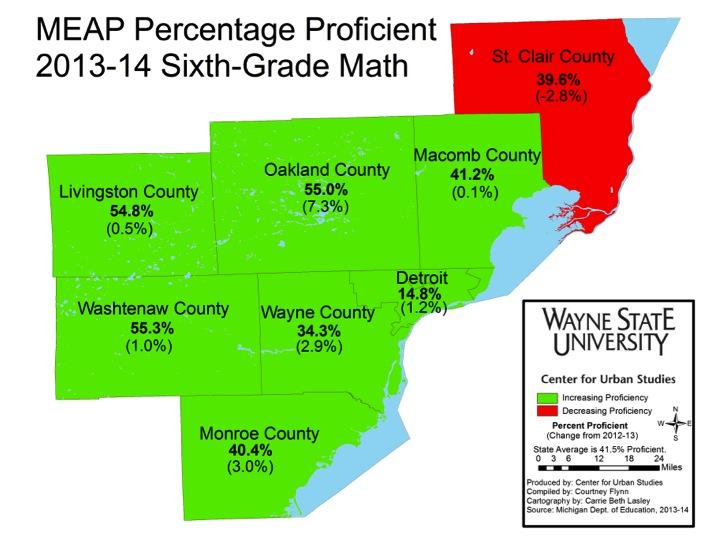
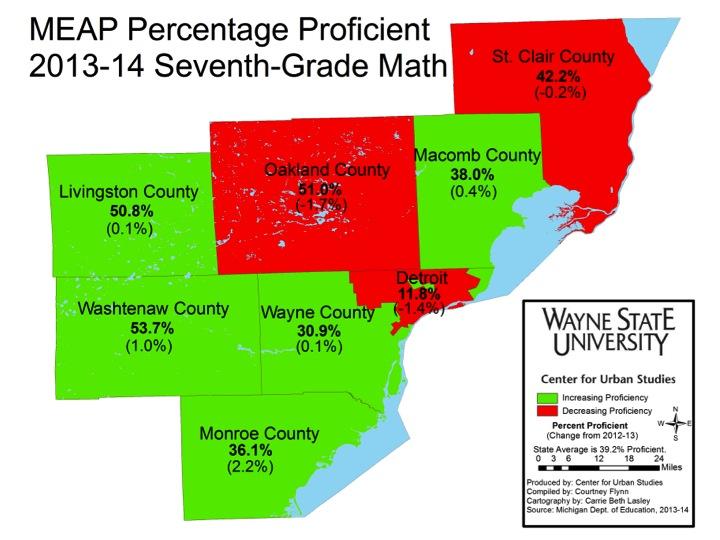
In St. Clair County, the St. Clair Regional Education Service Agency (RESA)  experienced a decrease in MEAP math scores for sixth- and seventh-grade students from fall 2012 to fall 2013. For the sixth-graders, there was a 2.8 decrease in the percent of students proficient in math, and for the seventh-graders, it was a 0.2 percent decrease.

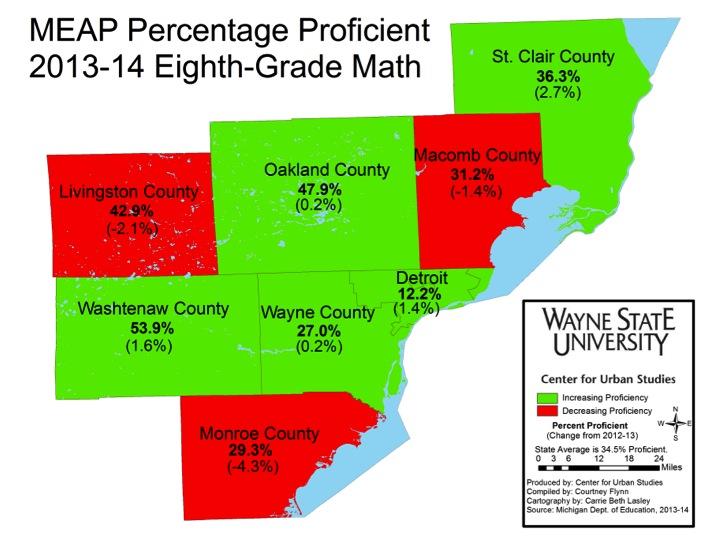
Overall in the region, the percent of students proficient in math increased the most among sixth-graders. The Oakland ISD had both the highest percent of sixth-graders proficient in math (55%) and the highest percent increase of sixth-graders proficient in math (7.3%). Washtenaw County had the highest percent of seventh- and eighth-graders proficient in math (53.7 and 53.9%, respectively) while Detroit Public Schools had the lowest percent proficient across all three grade levels (6th: 14.8%, 7th: 11.8%, 8th: 12.2%).

The eighth-grade map is currently not available; please check back soon. 

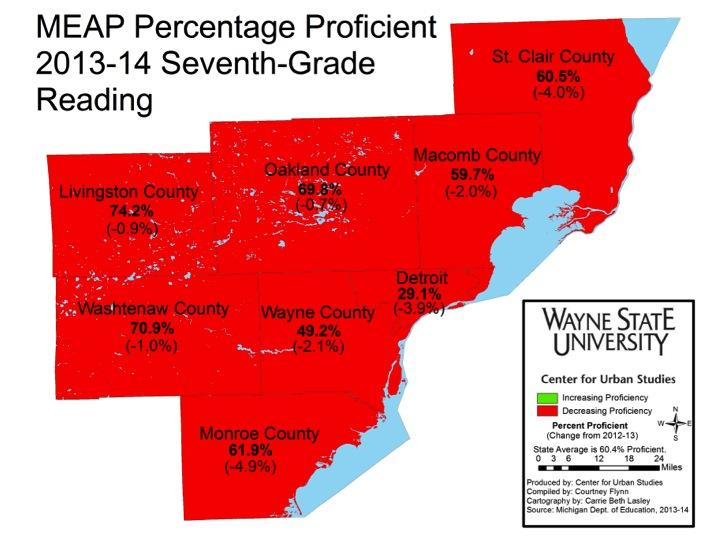
As can be seen by one of the maps above, seventh-graders across the seven-county region struggled to increase their reading proficiency as not one ISD or DPS experienced an increase in the percent of proficient students. The Monroe ISD experienced the largest decrease among seventh-graders from fall 2012 to fall 2013 at 4.9 percent. It was DPS, though, that had the lowest percent of students proficient in seventh grade reading, 29.1 percent. Even though there were decreases in proficiency across the region, some ISDs, like Livingston and Washtenaw, did have more than 70 percent of their students prove to be proficient on the test (74.2 and 70.9 percent, respectively).

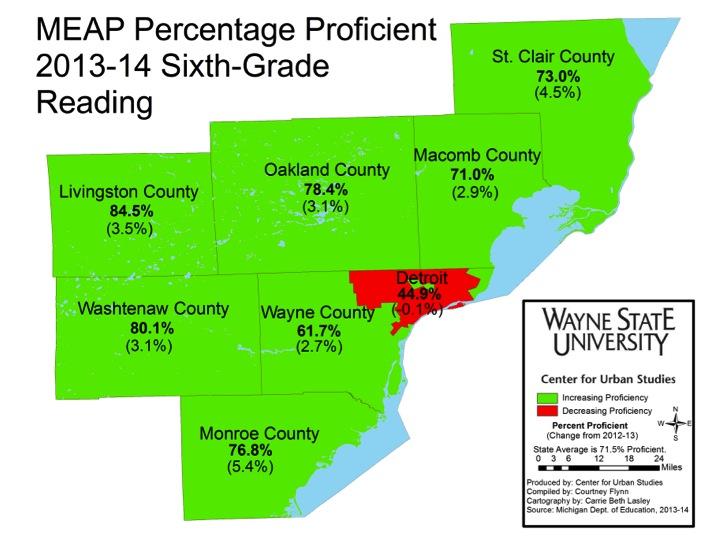
Except for Wayne County and DPS, all the other ISDs in the region had more than 70 percent of their sixth- and eighth-graders test as proficient in reading, and post an increase from the prior year. For the sixth grade, the Livingston ISD had the highest percent of students proficient in reading (84.5%) while the Monroe ISD had the highest increase from the year prior (5.4%). For the eighth-graders, the Washtenaw ISD (82.8%) had the highest percent of students proficient in reading while the St. Clair RESA (8.3%) had the largest increase.

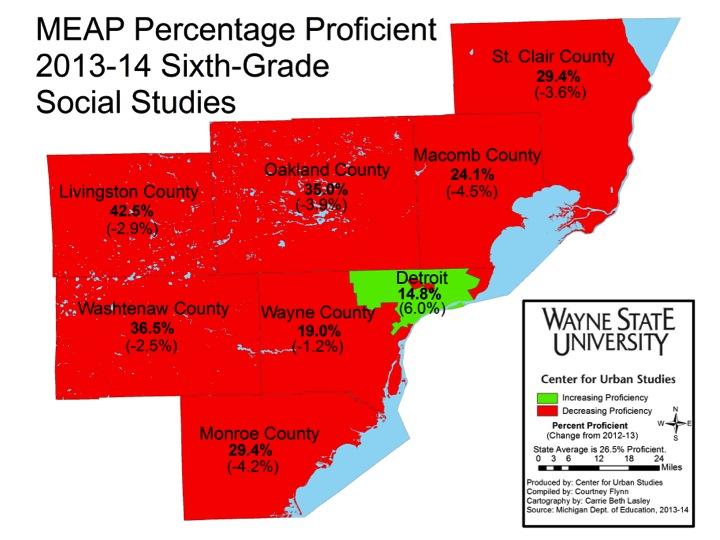
As the maps show, only one ISD and DPS posted an increase in the percent of students proficient in social studies from fall 2012 to fall 2013. For the sixth-graders, DPS had a 6 percent increase in the percent of students proficient in social studies. However, DPS still had the lowest percent of students proficient, 14.8 percent. The Livingston ISD (42.5%) had the highest percent of sixth-graders proficient in social studies and the Macomb ISD (4.5%) experienced the largest decrease.

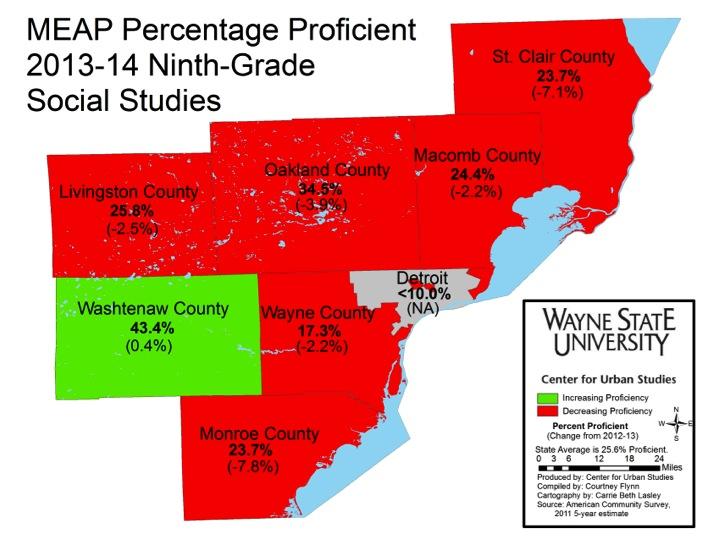
For the ninth-grade social studies MEAP exam, only the Washtenaw ISD experienced an increase in the percent of students proficient (0.4 percent); it also had the highest percent of students proficient (43.4%). The Monroe ISD experienced the largest decrease from fall 2012 to fall 2013 (7.8%), though it should be noted that the specific numbers for DPS could not be reported, according to the Michigan Department of Education, because less than 10 percent of students in the ninth grade were proficient on their social studies MEAP exam.

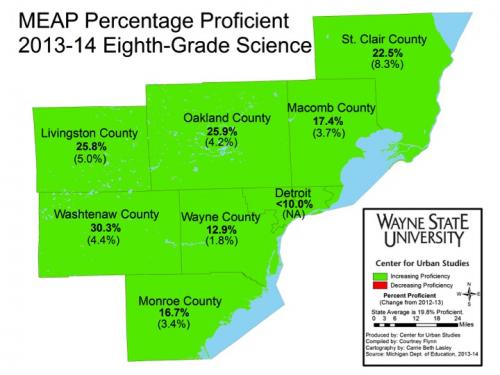
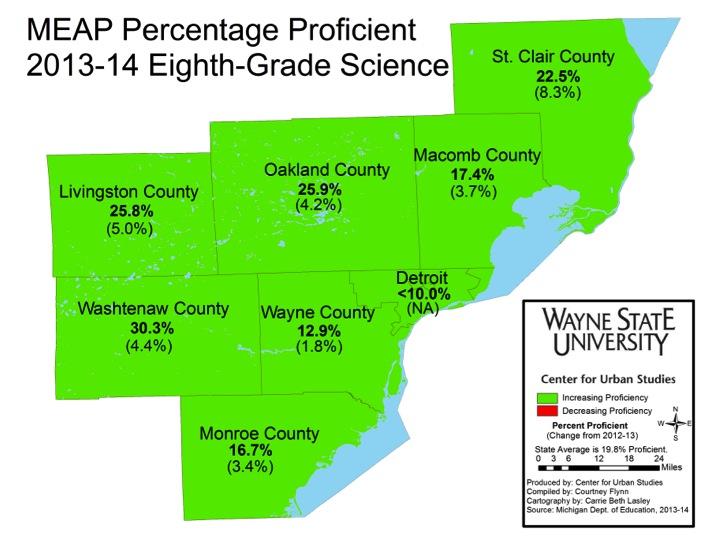
All ISDs and DPS in the region showed an increase in the percent of students proficient on the eighth-grade science test. The St. Clair RESA had the highest percent increase from fall 2012 to fall 2013 (8.3%) and Washtenaw ISD had the highest percent of eighth-graders proficient (30.3%). DPS had fewer than 10 percent of its eight-graders test proficient on the science exam last fall.

Progress and problems with education scores for children in Southeast Michigan

Currently, the Michigan Legislature is considering moving the oversight of the Michigan Education Assessment Program (MEAP) testing from the Michigan Department of Education (MDE) to the Treasury Department through House Bill 5581 and Senate Bill 0945. This suggested move, as proposed by Rep. Bob Genetski (R-Saugatuck), is so a “more responsive” department can control the state’s performance testing mechanism. The lack of responsiveness Genetskialleges refers to the decision by MDE to cease using the MEAP test as the MDE’s standardized test. Rather, the MDE plans to implement the Smarter Balance Assessment, standardized tests based on the Common Core Standards. The math and language arts portions of the MEAP test were no longer supposed to be given after this past fall. The upcoming state school aid budget, however, could require schools to use MEAP tests to receive funding, if the bills pass. While the Senate bill passed, House Republicans have not passed their version as yet.

Despite this ongoing debate, the MEAP has recently indicated some progress. Here we  MEAP results from the 2013-14 school year.

In this post, we examine the MEAP results for third, fourth and fifth graders. Overall, these maps show there has been a decline in MEAP scores in at least one county at each grade level for each subject tested for, with one exception. The science scores for fifth-graders saw an increase across the seven county region this past school year. In each case we present the scores for the Intermediate School District in the county, which represents the aggregate scores for the students across the county. In addition, we present scores for Detroit Public Schools (DPS).

Slide03

Slide04

Of the three grades examined in this post, third-graders experienced the least growth in MEAP proficiency from the fall 2012 to fall 2013. In math, the Washtenaw Intermediate School District (ISD) was the only one in the region to experience growth (1.3 percent). In Monroe County, the Monroe ISD had the largest decline in the percent of students proficient in math from 2012 to 2013 (4 percent), but it was Wayne County’s Regional Education Service Agency (RESA) that had the lowest percent of students proficient in math (31 percent), of the counties. The Detroit Public Schools had the lowest percent of students proficient in third grade math (14.6 percent) and third grade reading (35.3 percent).

No county in the region had an increase in the percentage of students proficient in third grade reading between fall 2012 and fall 2013. Again, the public schools in Monroe County experienced the largest decrease in the percent proficient (7.9 percent) but Wayne RESA had the lowest percent of third-grade students proficient in reading (49.2 percent).

Slide06Slide07Slide08

There were four ISDs (Livingston, Oakland, Washtenaw and Wayne), along with Detroit Public Schools, that had a decrease in the percent of fourth-graders proficient in math.  Of those, Livingston ISD had the largest decrease (3.3 percent) but it also had the highest percent of students proficient in math (59.6 percent) in the region.

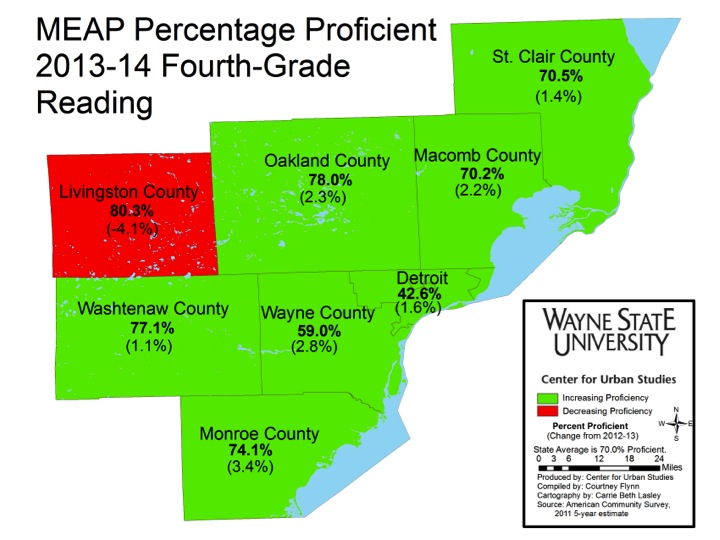
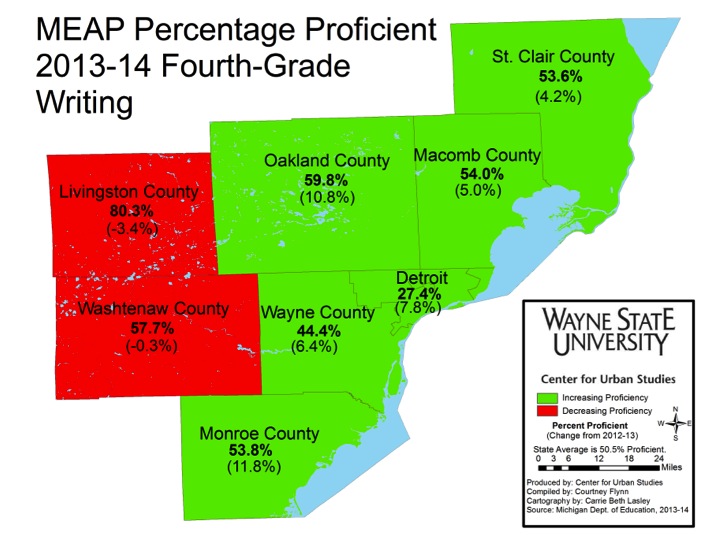
All intermediate school districts, and the public schools in the City of Detroit, experienced an increase in the percent proficient in reading, with the exception of the intermediate school district in Livingston County. Livingston ISD experienced a 4.1 percent decrease. Even with the decrease, the Livingston ISD had the region’s highest percentage of students proficient in reading (80.3%), as well as in math (59.6%) and writing (80.3%). The Monroe ISD had the largest percent increase of third-graders proficient in all three subjects.

Similar to the percent changes of students proficient in math, the Livingston ISD also had the largest decrease in fourth-graders proficient in science (3.3 percent) but the highest percent of students proficient in the subject (80.3 percent). In terms of overall percent increase, Monroe County had the largest (11.8 percent)

Slide10Slide11Slide12

From fall 2012 to fall 2013, there was a decrease in the percent of students proficient in both math from fall 2012 to fall 2013  for the St. Clair RESA and DPS. St. Clair RESA had the largest decrease in students proficient from fall 2012 to fall 2013 (7.3 percent). Wayne and Oakland intermediate school districts, along with Detroit Public Schools also experienced a decrease.

For reading, the St. Clair RESA experienced a 1 percent decrease, which was the largest decrease of the counties. The Detroit Public Schools experienced a 1.4 percent decrease in the percent of fifth-graders proficient in reading though.  Overall, Livingston ISD had the highest increase in the percent students proficient in reading (2.7 percent) and the highest percentage of students proficient (85.3 percent).

For fifth-grade students in the region, all intermediate school districts experienced an increase in the percent of students proficient in science; the intermediate school districts in St. Clair and Washtenaw counties had the largest percent increase (4.8 percent). The Washtenaw ISD also had the highest percent of students proficient in science (24.7 percent).

Next week we will examine the MEAP scores for sixth through ninth graders in the region.