Monroe, St. Clair Counties Rank Highest for Green Infrastructure; Majority is Agricultural Land

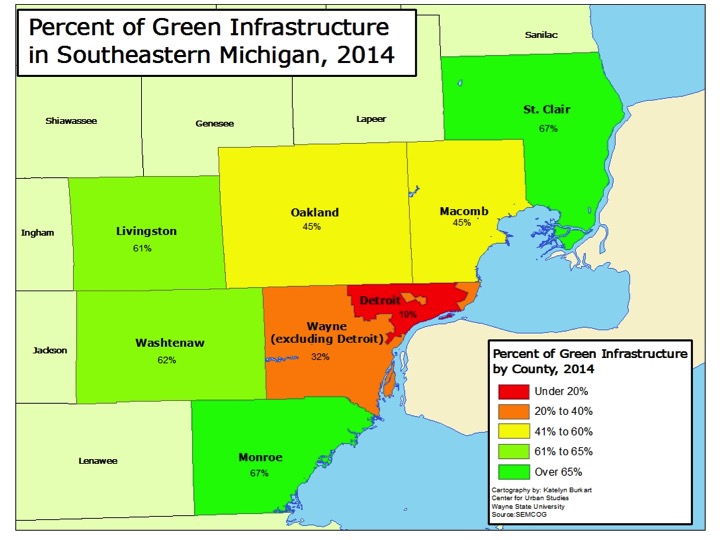
In Southeastern Michigan there was about 180,000 acres of green infrastructure in 2014, according to the Southeastern Michigan Council of Governments (SEMCOG), and the regional planning agency is looking to improve and grow that number. This green infrastructure represents both natural ecosystems (wetlands, forests and parks), agricultural land and constructed versions, such as community gardens and bioswales. Both Monroe and St. Clair counties had the highest percentage of total green infrastructure in 2014 at 67 percent. Wayne County, both including and excluding Detroit, had the lowest percentage of green infrastructure. Excluding Detroit, Wayne County was made up of 32 percent of green infrastructure; including Detroit Wayne County was made up of 30 percent green infrastructure. In general, one can think of green infrastructure as the inverse of developed land, where houses, businesses, roads and other infrastructure exists.

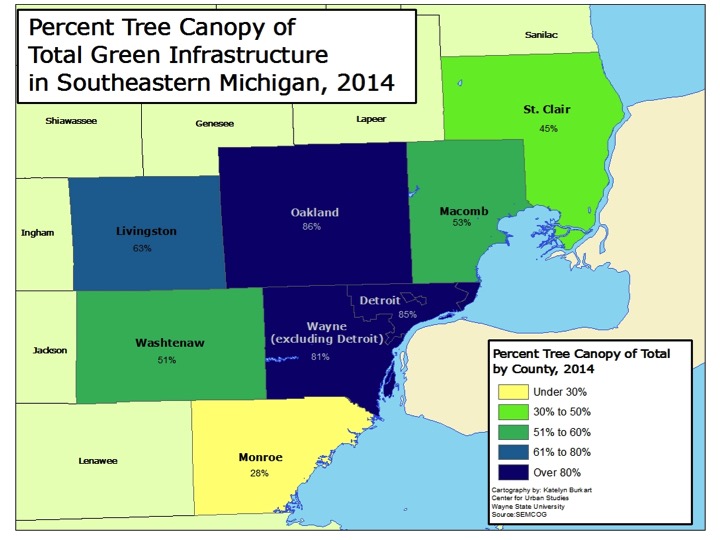
Of this overall green infrastructure it is important to identify what it is comprised of. Below we will see how the tree canopy varies from county to county and how these variations are affected by the presence of parks and agricultural land.

The data provided for this post was found in SEMCOG’s 2014 Green Infrastructure Vision document.

Metro-Detroit Green Infrastructure

In total, Oakland County had the highest percentage of overall tree canopy at 44 percent; the county’s tree canopy made up 86 percent of its total green infrastructure. Oakland and Livingston counties were the only two in the region that had a tree canopy above the American Forest’s overall standard of 40 percent. The American Forest is the country’s oldest conservation non-profit, and SEMCOG bases its green infrastructure goals on their standards.

The county with the lowest overall tree canopy was Monroe; it had a tree canopy of 20 percent. This 20 percent of total tree canopy made up 28 percent of its total green infrastructure. This is largely because of the greater portion of land devoted to agriculture, as discussed below.

The city of Detroit had a total tree canopy of 16 percent, which is below American Forest’s standard for tree coverage in an urban area. Nevertheless this represents 85 percent of Detroit’s green infrastructure. American Forest calls for a 25 percent tree canopy coverage in an urban area. In a suburban residential the organization’s standard is 50 percent, and in a central business district that standard is 15 percent.

Metro-Detroit Tree Canopy

Metro-Detroit Tree Canopy and Green Infrastructure

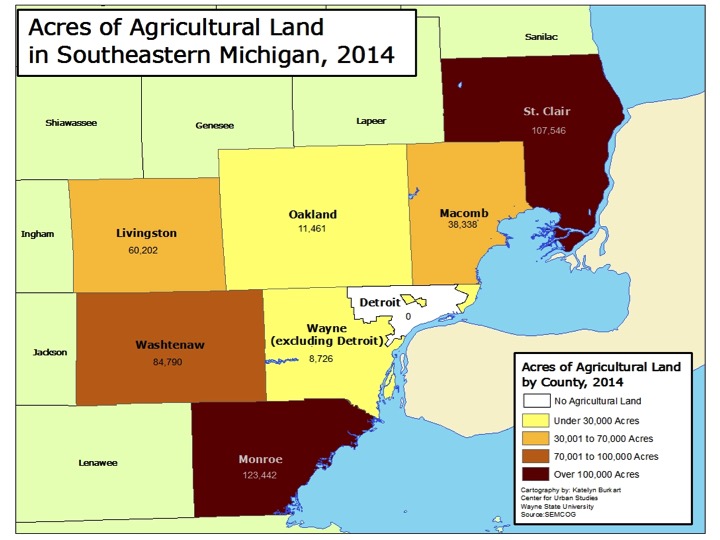
While tree coverage is an important aspect of green infrastructure, it is not the only thing that can make a community “more green.” As discussed above, Monroe County had the highest percentage of overall green infrastructure yet the lowest percentage of tree canopy coverage. As shown below, this is, in part, because there was more than 123,000 acres of agricultural land in Monroe County in 2014. Monroe County had the highest amount of agricultural land in 2014 in the region followed by St. Clair County, which had about 107,000 acres of agricultural land. St. Clair County, like Monroe County, was made up of 67 percent green infrastructure. According to SEMCOG, Monroe County ranks seventh in the state in the total number of acres of vegetables (6,707) and corn, soy and wheat (169,792). St. Clair County ranked sixth in the state in the number of farms producing organic products and eighth in state for the total number of acres of soybeans it produced in 2014 (64,224).

According to SEMCOG, agricultural land is defined as “rural land used with the growing of food as the primary function, but can also provide ecological benefits.” SEMCOG classified Detroit as having 0 acres of agriculture, but this does not include the number of community gardens, which have been growing in the city through individual and organizational efforts.

While Detroit had 0 acres of agriculture land, Wayne County had 8,726 acres of agricultural land, which was the smallest amount in the region.

Metro-Detroit Agriculture Land

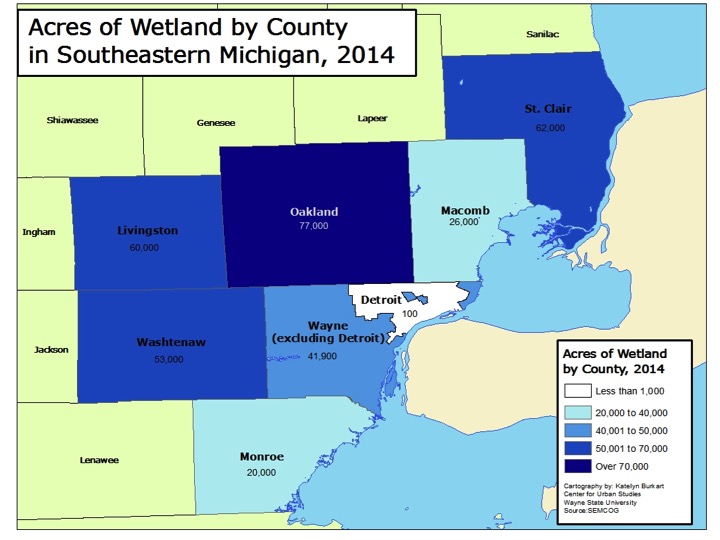
For total acreage of agricultural land in the region, Oakland County had amongst the smallest amount of coverage in the region but for wetland coverage it had the greatest amount. Oakland County had 77,000 acres of wetland in 2014. St. Clair (62,000 acres), Livingston (60,000) and Washtenaw (53,000) counties all had more wetland coverage than Wayne County. However, the 41,900 acres of wetland coverage in Wayne County was nearly five times the amount of agricultural land in the county. Additionally, of those 41,900 acres, 100 were located in Detroit.

Monroe County had the least amount of wetland coverage at 20,000, which is about 100,000 less acreage than it had of agricultural land.

Metro-Detroit Wetlands

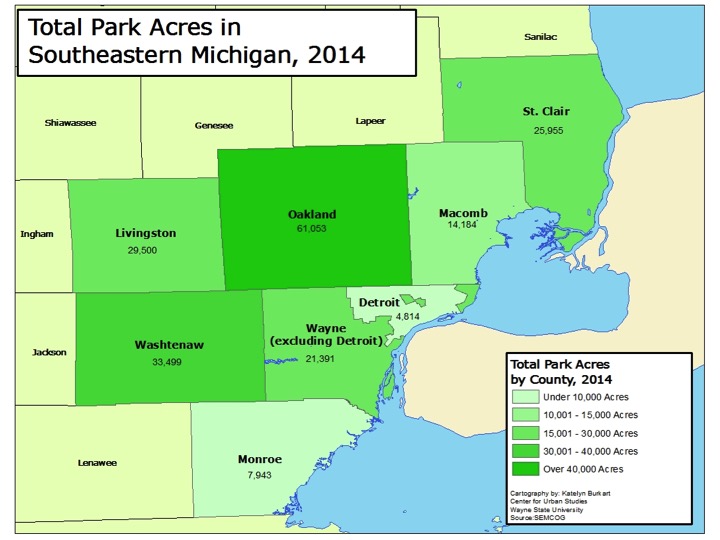
Another factor into the total amount of green infrastructure present in a county is park land, which includes city, country, metro and state parks. Oakland County had the highest amount of park acreage at 61,053. Oakland County is home to five state park/recreation areas, three metroparks, 13 county parks and numerous local parks at the municipal level. Washtenaw County had the second highest acreage of park coverage at 33,499 acres, which was nearly half of Oakland County’s coverage. Like Oakland County, Washtenaw County is home to three metroparks and 13 county parks. Washtenaw County also has 20 nature preserves, numerous parks at the local level and nine state park/recreation areas.

Wayne County had about 26,000 acres of total park acreage, about 5,000 of which was located in Detroit. Belle Isle made up nearly a fifth of Detroit’s park acreage; it is 982 acres.

Metro-Detroit Parks

The amount of green infrastructure established in a community and a region is important because it can not only serve as a catalyst for economic growth but also because it serves as the base for ensuring citizens have access to clean water and air, fresh food and amenities that promote healthy and sustainable lifestyles. There is a recognition that additional green infrastructure is needed in Southeastern Michigan, which is why SEMCOG has created a green infrastructure vision. This vision aims to benchmark the current green infrastructure in the region and then identify policies that will allow for stronger and more connected infrastructure networks, more accessibility and cleaner air and water quality.
Housing Prices Continue to Increase in Metro-Detroit

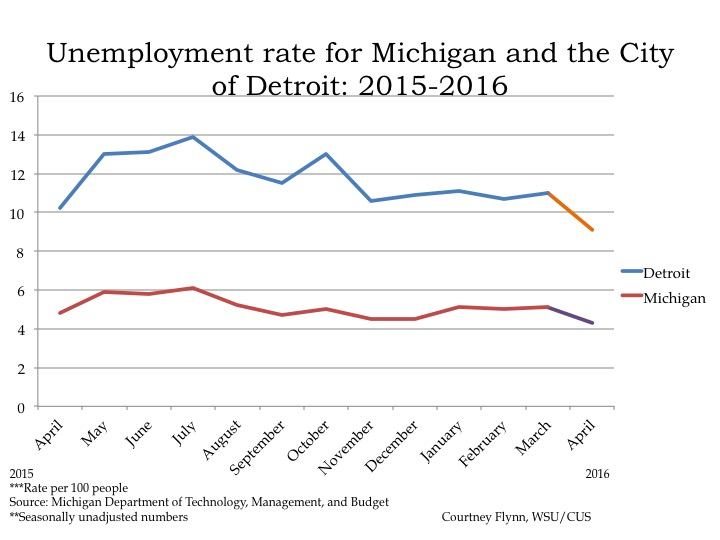
  • From March to April 2016, the unemployment rate across the state and within the city of Detroit declined (monthly);
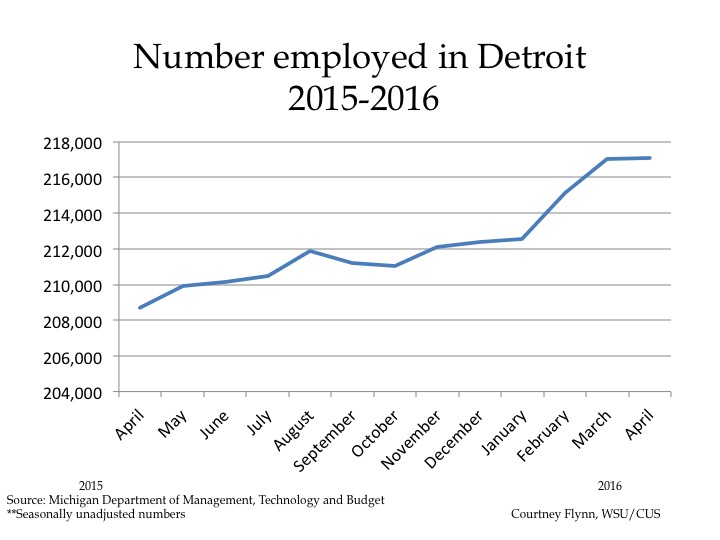
  • The number of employed Detroit residents increased (monthly);
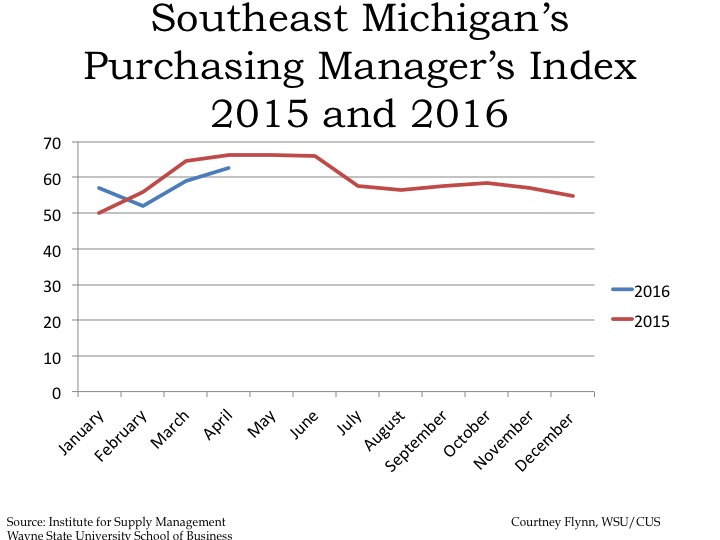
  • The Purchasing Manager’s Index for Southeastern Michigan increased from March to April 2016 (monthly);
  • Commodity Price Index remained stabled for Southeastern Michigan (monthly)
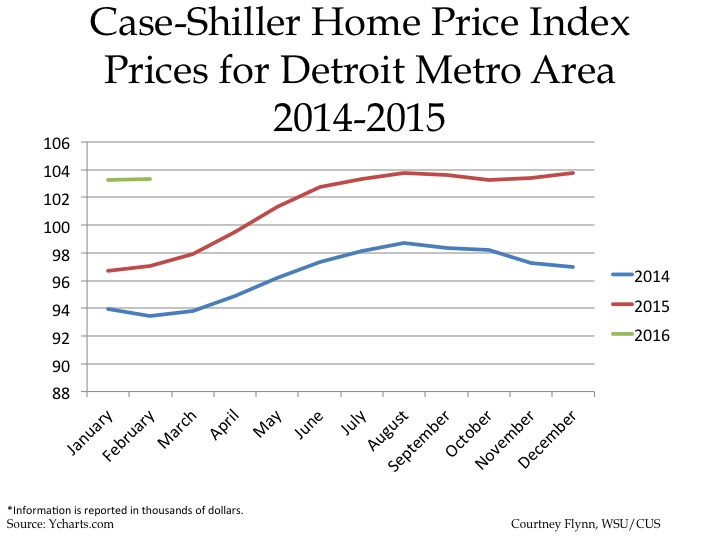
  • Standard and Poor’s Case-Shiller Home Price Index for the Detroit Metropolitan Statistical Area shows home prices have increased by about $10,000 since February of 2014.

Detroit Unemployment

According to the most recent data provided by the Michigan Department of Technology, Management and Budget, the unemployment rate for the State of Michigan decreased to 4.3 percent in April 2016; the unemployment rate was 5.1 percent in March. During this same period, unemployment in the City of Detroit marginally increased from 11 percent in March to 9.1 percent in April.\Detroit Employment

In Spring of 2016 the number of employed Detroit residents began to stabilize. In March of 2016 the number employed was 217,027 and in April of 2016 that number slightly increased to 217,078. In April of 2015 employment numbers for Detroit residents began to rise, and have since peaked.

Although the sheer number of Detroit residents employed has increased, data also shows that the Detroit labor force decreased to 238,790 in April 2016; it was 243,813 the month prior.

Auto Employment

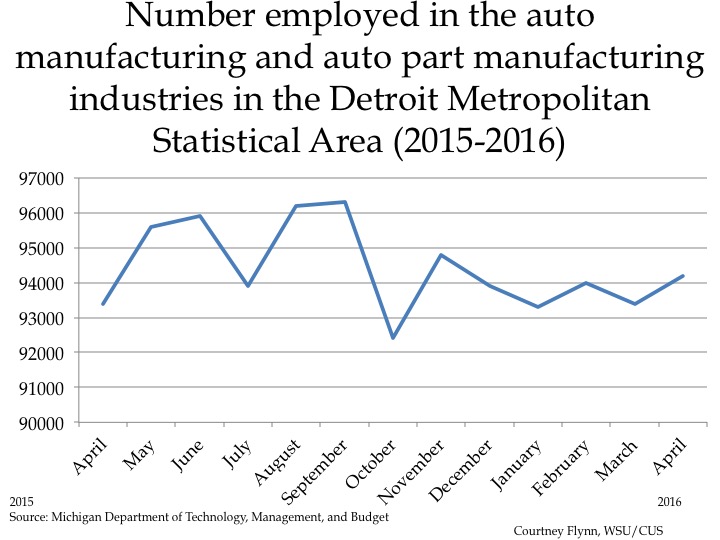
The above chart shows the number of people employed in the auto manufacturing industry in the Detroit Metropolitan Statistical Area (MSA) (Detroit-Warren-Livonia) from April 2015 to April 2016. In that time frame the number of people employed in this industry has increased by 800, from 93,400 to 94,200.

PMI

The Purchasing Manger’s Index (PMI) is a composite index derived from five indicators of economic activity: new orders, production, employment, supplier deliveries, and inventories. A PMI above 50 indicates the economy is expanding.

According to the most recent data released on Southeast Michigan’s Manager’s Index, the PMI for April 2016 was 62.7, an increase of 3.6 points from the prior month. The April 2016 PMI was a decrease of 3.7 from April of 2015.  Despite the decrease from April 2015 to April 2016, the current PMI represents a growing economy that is currently being pushed forward because of improvements in new orders, employment and production.

Commodity Price Index

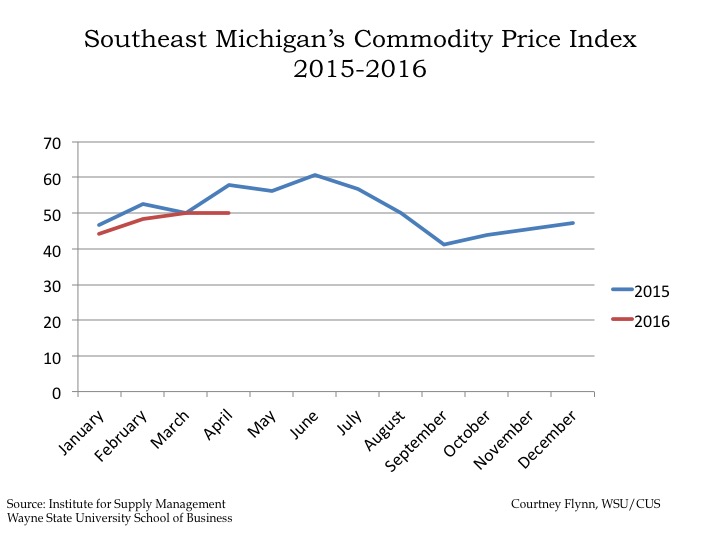
The Commodity Price Index, which is a weighted average of selected commodity prices, was recorded at 50 points in both March and April of 2016. The April 2016 Commodity Price Index is a decrease of 7.9 points from the prior year.

Detroit Home Prices

The Commodity Price Index, which is a weighted average of selected commodity prices, was recorded at 50 points in both March and April of 2016. The April 2016 Commodity Price Index is a decrease of 7.9 points from the prior year.

Employment in Detroit Growing, While Unemployment also Increased

  • From December 2015 to March 2016, the unemployment rate across the state remained stable while the city of Detroit’s experienced a slight increase (monthly);
  • Employment in the city of Detroit increased by 8,407 from March 2015 to March 2016 (monthly);
  • The Purchasing Manager’s Index for Southeastern Michigan increased from February 2016 to March 2016 (monthly);
  • Commodity Price Index increased from February 2016 to March 2016 for Southeastern Michigan (monthly)
  • Standard and Poor’s Case-Shiller Home Price Index for the Detroit Metropolitan Statistical Area shows home prices are about $6,900 higher than in January of 2015.

Detroit Unemployment

According to the most recent data provided by the Michigan Department of Technology, Management and Budget, the unemployment rate for the State of Michigan increased to 5.1 percent between December of 2015 and March of 2016. During this same period, unemployment in the City of Detroit marginally increased from 10.9 percent in December to 11 percent in March.

Detroit Employed

Since March of 2015 the number of employed Detroit residents in the labor force increased by 8,407, to a total of 217,137 in March of 2016. While the month of March in 2015 had the lowest number of Detroit residents employed in the labor force in the last year, March in 2016 has had the highest number of people employed for 2016.

The conundrum of increasing employment and increasing unemployment likely is a result of more people entering the labor market in the city, creating a situation in which more are employed, but more are also looking for work.

Detroit Manufacturing

The above chart shows the number of people employed in the auto manufacturing industry in the Detroit Metropolitan Statistical Area (MSA) (Detroit-Warren-Livonia) from March 2015 to March 2016. In that time frame the number of people employed in this industry has increased by 300, from 93,100 to 93,400.

PMI

The Purchasing Manger’s Index (PMI) is a composite index derived from five indicators of economic activity: new orders, production, employment, supplier deliveries, and inventories. A PMI above 50 indicates the economy is expanding.

According to the most recent data released on Southeast Michigan’s Manager’s Index, the PMI for March 2016 was 59.1, an increase of 7.1 point from the prior month. This increase is largely representative of the region’s employment, new order and production indexes increasing.

The March PMI was also a decrease of 5.4 from March of 2015.

Commodity Price

The Commodity Price Index, which is a weighted average of selected commodity prices, was recorded at 50 points in March 2016, which was 1.6 points higher than the previous month and exactly the same as what it was in March of 2015.

Detroit Home Price

The above charts show the Standard and Poor’s Case-Shiller Home Price Index for the Detroit Metropolitan Statistical Area. The index includes the price for homes that have sold but does not include the price of new home construction, condos, or homes that have been remodeled.

According to the index, the average price of single-family dwellings sold in Metro Detroit was $103,590 in January 2016. This was an increase of $6,890 from January of 2015 and increase of $9,670 from January of 2014.

U.S. Postal Service: Detroit Vacancy Rates Drop by 2,500 between 2014 and 2015

There were 2,540 fewer vacant Detroit residential properties between December 2014 and December 2015, according to the U.S. Postal Service. Between September 2015 and December 2015 the number of residential vacancies decreased by 896. Overall in the month of December of 2015 there were 80,077 vacant residential addresses, which is equivalent to a 22.4 percent residential vacancy rate, according to the U.S. Postal Service. Also for December 2015 the total number of residential addresses decreased by 905 from December 2014 and by 1,163 from September 2015.

In addition to a decrease in the number of vacant addresses in the city of Detroit in December of 2015 there was also a decline in the number of “no stat” addresses; that number decreased by 786. Mail carriers denote properties as being either “vacant” or “no-stat.” Carriers on urban routes mark a property as vacant once no resident has collected mail for 90 days. Addresses are classified as “no-stat” for a variety of reasons. Addresses in rural areas that appear to be vacant for 90 days are labeled no-stat. So are addresses for properties that are still under construction, and urban addresses that the carrier decides are unlikely to be occupied again any time soon — meaning that both areas of high growth and severe decline may be labeled no-stat.


Slide3


Slide4

Slide5

Metro-Detroit’s Home Prices Continue to Grow

  • From November 2015 to December 2015, the unemployment rate across the state remained stable and the city of Detroit’s increased (monthly);
  • The Purchasing Manager’s Index for Southeast Michigan decreased from November 2015 to December 2015 (monthly);
  • Commodity Price Index increased from November 2015 to December 2015 for Southeast Michigan (monthly);
  • Standard and Poor’s Case-Shiller Home Price Index for the Detroit Metropolitan Statistical Area shows home prices are about $6,800 higher than in December of 2014.

Slide03


According to the most recent data provided by the Michigan Department of Technology, Management, and Budget, the unemployment rate for the State of Michigan remained constant at 4.5 percent between November and December of 2015. During this same period, unemployment in the City of Detroit increased from 10.6 percent in November to 10.9 percent in December.

Slide05

Since March of 2015 the number of people employed in the city of Detroit increased by 4,895, for a total of 214,282 people employed in the city in December of 2015. In the last year, the month of March had the lowest number of people employed in Detroit. Employment went down slightly in December.

Slide07

The above chart shows the number of people employed in the auto manufacturing industry in the Detroit Metropolitan Statistical Area (MSA) (Detroit-Warren-Livonia) from January 2015 to December 2015. In that time frame the number of people employed in this industry increased by 1,100, from 104,900 to 106,000.

Slide09

The Purchasing Manger’s Index (PMI) is a composite index derived from five indicators of economic activity: new orders, production, employment, supplier deliveries, and inventories. A PMI above 50 indicates the economy is expanding.

According to the most recent data released on Southeast Michigan’s Manager’s Index, the PMI for December 2015 was 54.8, an decrease of 2.3 point from the prior month. It was also a decrease of 9.4 from December of 2014.

Slide11

The Commodity Price Index, which is a weighted average of selected commodity prices, was recorded at 47.2 points in December 2015, which was 1.7 points higher than the previous month and 7 points lower than December 2014.

Slide13

The above charts show the Standard and Poor’s Case-Shiller Home Price Index for the Detroit Metropolitan Statistical Area. The index includes the price for homes that have sold but does not include the price of new home construction, condos, or homes that have been remodeled.

According to the index, the average price of single-family dwellings sold in Metro Detroit was $103,770 in December 2015. This was an increase of $6,800 from December of 2014. Note also that there were continuing increases at the end of 2015.


Part I: Metro-Detroit’s shift toward regionalism starts with Metroparks, speeds up with economic downturn

Regionalism in Southeastern Michigan began to take shape in the 1930s, but it was not until the financial decline of Detroit and the broader region, that multi-jurisdictional authorities truly began to take over an array of services.
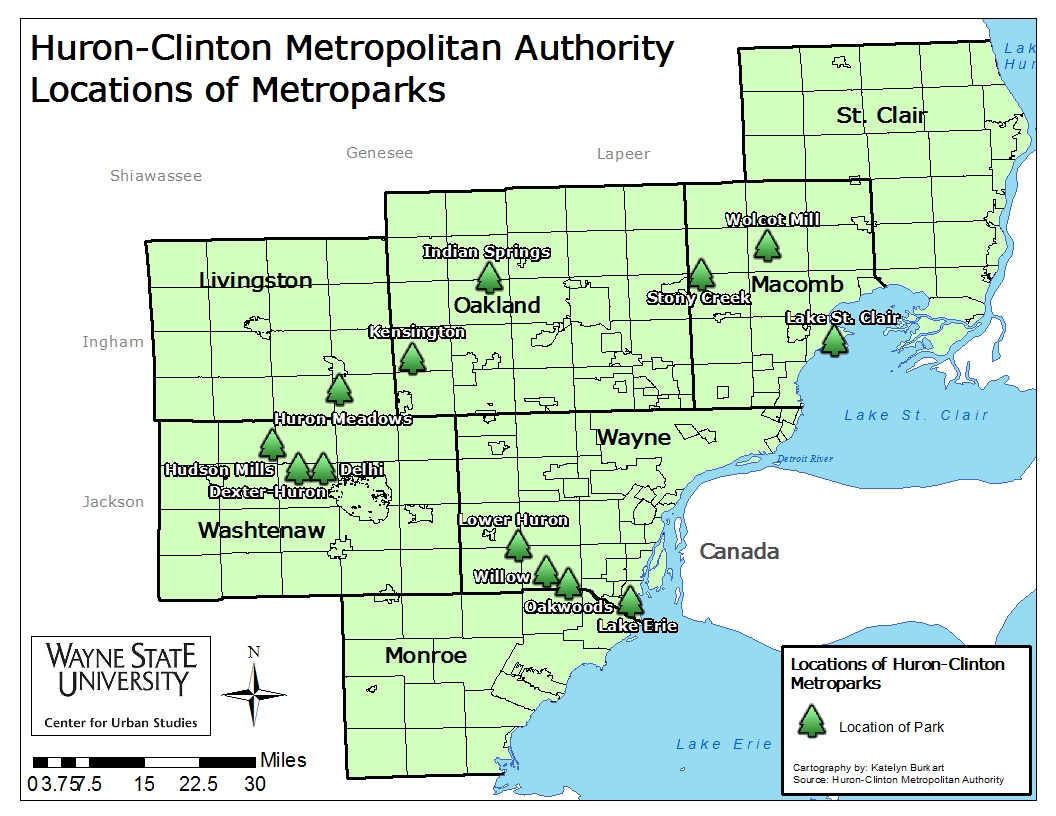
The oldest extant regional entity formed in Southeastern Michigan is the Huron-Clinton Metropolitan Authority. Enabled by the Michigan State Legislature in 1939 by Public Act No. 147, the residents of Livingston, Macomb, Oakland, Wayne and Washtenaw counties approved the authority the following year. In 1942, funding for the parks became available, according to the authority’s history. Since that time the authority has grown to oversee 13 metroparks, which together encompass more than 25,000 acres. The Huron-Clinton Metropolitan Authority is governed by a seven-member board; two members are appointed by the governor and the other five are appointed by the Board of Commissioners of the member counties. Currently, all of the metroparks are supported by a 0.2146 mill levy on the residents of Livingston, Macomb, Oakland, Wayne and Washtenaw counties. This levy is equivalent to $10.73 for a home valued at $100,000 ($50,000 taxable value).

Metroparks

Southeast Michigan took an additional step toward regional cooperation more than 25 years later (1968) by establishing the Southeastern Michigan Council of Governments (SEMCOG). This regional planning entity, along with other regional planning organizations in the state of Michigan, was authorized by Public Act 281 of 1945.

According to its website, SEMCOG partners with local government entities—ranging from villages to cities to counties to community colleges—to better improve the area’s waterways, transportation systems and economic vitality. In addition, according to the Clean Air Act and the Water Pollution Control Act, SEMCOG is the region’s planning agency for water and air quality. SEMCOG has also been responsible for the region’s transportation planning.

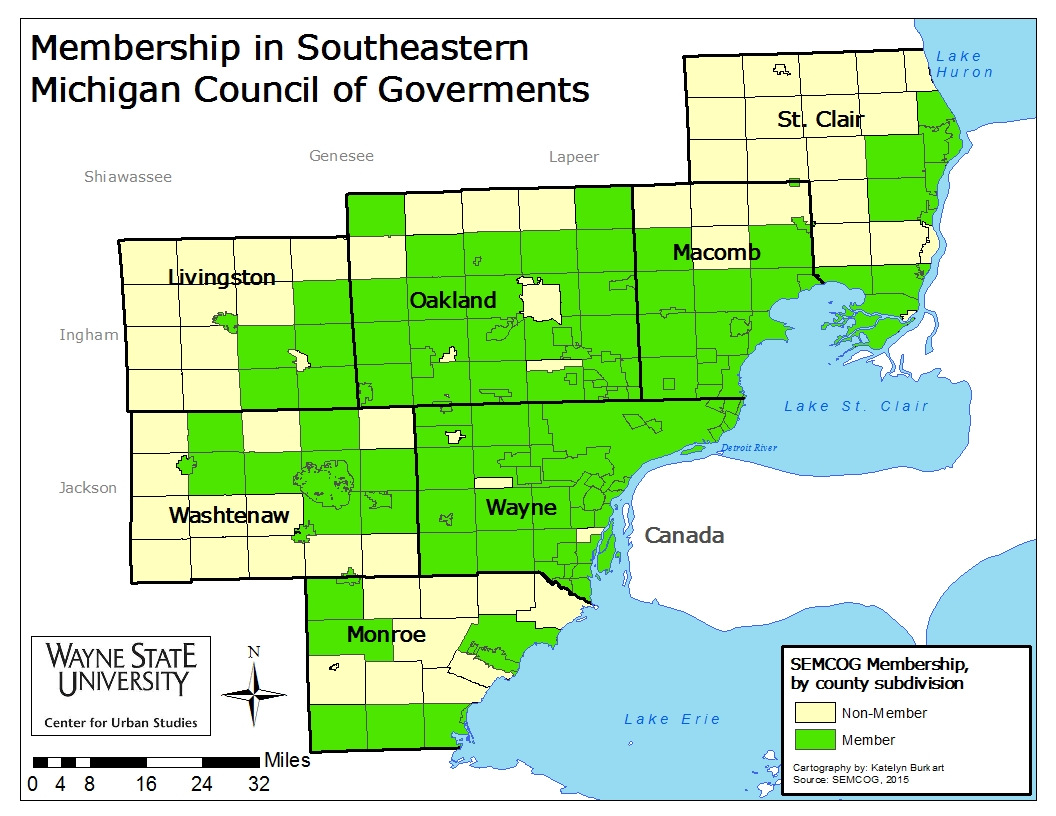
For SEMCOG, communities choose whether or not they want to be members of regional planning entity. As of the end of 2015 there were 168 different government entities that were SEMCOG members. In Macomb County, Ray Township, along with the townships of Armada, Bruce and Richmond are not SEMCOG members despite their neighbors like Washington and Macomb townships being members. In Oakland County, Pontiac is not a SEMCOG member despite it being surrounded by members.

SEMCOG_members

Despite the existence of regional entities, cooperation among cities and counties in Southeastern Michigan was very limited during much of the 20th century. But Michigan’s economic downturn in the 2000s weakened some of the region’s strongest institutions as they began to face financial problems. One of the first organizations to seek public support through a regional millage was the Detroit Zoo. Once completely owned and operated by the city of Detroit, zoo operations were transferred to the Detroit Zoological Society in 2006. This decision came after the city voted to close it for financial reasons, and the Michigan Legislature promised to provide $4 million to the society for operational aid, according to a 2005 Crain’s Detroit article. Then in 2008, the Michigan Legislature approved Public Act 49, allowing counties to establish a zoological authority and contract for zoological services. The act also gives the counties the authority to levy up to 0.1 mill, with voter approval, for such services. In the same year Public Act 49 was passed (2008), the voters of Wayne, Oakland and Macomb counties were asked to approve a 10-year 0.1 millage, which equals to $5 a year for a home valued at $100,000 (taxable value of $50,000). All three counties approved the millages:

  • Wayne County: 73.15% yes
  • Oakland County: 74.88% yes
  • Macomb County: 66.5% yes

Each of the three counties has its own zoo authority, whose members are appointed by their county commissions or by the county executive office. In Oakland County, the board of commissioners appoints the members; in Macomb County the County Executive makes the appointment recommendation but the Board of Commissioners must confirm; and in Wayne County the executive makes the appointment. Each authority is charged with administering the funds levied from the millage to the Detroit Zoo.

The successful 2008 request for financial support was not the first time the Detroit Zoo sought public assistance through tax dollars, though. In 2000 and 2002 millages were placed on the ballot; Wayne County supported those requests and Oakland County did not, causing them to fail. Macomb County did not participate.

The 2008 millage, which was passed to support operations at the zoo, contributed to 36 percent of the organization’s operational budget in 2014, according to its 2014 financial report. The breakdown of the percentage of millage funds provided to the zoo from each county in 2014 were as follows:

  • Wayne County: 13%
  • Oakland County: 16%
  • Macomb County: 8%
  • (64% funds earned revenue and through fundraising)

Following the regional support for The Detroit Zoo another regional authority was created—this one intended to support Detroit’s Cobo Hall. In September of 2009 the Detroit Regional Convention Facility Authority was formed through passage of Public Act 554 in 2008, which allowed the creation of regional convention facility authorities. This regional authority was formed at a time when the North American International Auto Show threatened to abandon Cobo Hall and Southeast Michigan due to the facility’s size and aging infrastructure, according to a New York Times article. Detroit could no longer financially maintain the convention center at a level that would allow it to host such an international attraction.


When the Detroit Regional Convention Facility Authority was formed, so was a governing body to oversee the regional authority. The governing body is a five-member board with representatives from the City of Detroit, Wayne, Oakland and Macomb counties and an appointee from the Governor’s Office. This body oversees the 30-year capital lease of Cobo Hall (the facility is leased from Detroit), which includes a $299 million expansion/upgrade project. The Detroit Regional Convention Facility Authority receives funding from revenues at Cobo Center as well as support from the state’s Convention Fund.

The Detroit Institute of Arts (DIA) authorities (one each in Wayne, Oakland and Macomb) were also created during the 2008 economic downturn to help establish a more reliable base for operations funding for the Detroit Institute of Art. Public Act 296 of 2010 gave each of the three counties the ability to levy up to $10 for a home valued at $100,000 (taxable value of $50,000), with the support of voters, to support “an encyclopedic [comprehensive] art museum whose primary art collection and facility. . . are owned by a municipality located in the state.” Similar to the Detroit Zoo authorities, each county board and/or executive appoints members to its respective authority to oversee the funds brought in through the millage.
In November of 2012 majority of Wayne County (67%), Oakland County (64%) and Macomb County (50.5%) approved the 10-year, 0.2 mill proposal that allows free general admission to residents of the tri-county area. Other benefits of the now-established regional authority include free bussing for school field-trips and senior citizen trips, along with the Inside-Out Program, which brings reproduced pieces of art to area communities.

The approval of the millage meant increased funding for the DIA, along with increased attendance. In 2014, according to the DIA’s Community Relations Report, the institute has about 300,000 total visitors from the tri-county area. The breakdown is as follows:

  • Wayne County: 141,659 = 47% of total visitors
  • Oakland County: 106,433 = 36%
  • Macomb County: 51,834 = 17%

While the DIA millage may still seem to receive the most attention, with concerns over raises and transparency, it certainly was not the end of Southeastern Michigan’s increased shift toward regionalism. Over the next two weeks we will also explore the region’s history of fragmented regional transportation and shift from the region’s reliance on Detroit for water and sewer services to a more collaborative approach.

Southeastern Michigan’s average income above nation’s; Detroit’s income continues to lag

Southeastern Michigan has a median household income of about $57,000, $4,000 above the national average (about $53,000), but there are multiple communities in the region with median household incomes far below the local average. Communities within the region with the lowest median household incomes included Highland Park, Detroit and Hamtramck.

Metro-Detroit median household income

SEMichigan Median Household income 2014

In 2014 Highland Park had the lowest household median income in the region at $19,391; this is a decrease from a median household income of $21,469 in 2009. This neighbor to the City of Detroit also had 49 percent of residents living below the Federal Poverty Level ($23,850 for a family of four) in 2014. Similar to the decreased median household income for Highland Park in recent years, there has been an increase percentage of residents living below the Federal Poverty Level.

In 2014 Hamtramck had roughly the same percentage of residents as Highland Park living below the Federal Poverty Level at 49 percent, this too being an increase from 2009. It also had one of the lowest median household incomes in the region in 2014 at $25,183. The city’s 2014 median household income is about a $5,000 decrease from $30,346 in 2009. Detroit, which will be discussed further later, had a household median income above both of these cities in 2014 at $26,095. However, this median household income is still far below the average for the region, state and nation.

In 2014 the median household income for Lake Angelus was $167,083. Between Highland Park, which had the lowest median household income in the region in 2014, and Lake Angelus, which had the highest median household income, there was more than a $130,000 difference; according to our previous post, in 2009 Lake Angelus’ median household income was about $131,000. Bloomfield Township, also located in Oakland County, was another suburban community that experienced an increase in its median household income between 2009 and 2014. In 2014 Bloomfield Township’s median household income was $108,235, in 2009 it was $104,988. Other communities in the region that had a median household income above $120,000 in 2014 were Novi Township ($125,000), Bloomfield Hills ($163,462) and Orchard Lake Village ($152,625).

Despite such high median household incomes it wasn’t Oakland County with the highest median household income of the seven counties in the region, rather it was Livingston County. In 2014, Livingston County had a median household income of $73,994; Oakland County’s median household income was $66,436. Conversely, Wayne County had the lowest median household income $41,421.

Although Livingston County did not have any communities with a median household income above $120,000, 10 of 18 communities (data was not available for Fenton) had median household incomes above $70,000. Brighton Township had the highest median household income in Livingston County at $94,611 and the Howell had the lowest at $43,482. In Oakland County median household incomes ranged, by community, from $27,632 (Pontiac) to $167,083.

Detroit Median Income

Detroit’s median household income in 2014 was $26,905, a decrease from $33,754 in 2009. With incomes decreasing, the percentage of individuals living below the poverty line increased from 33.2 percent in 2009 to 39.4 percent in 2014 in Detroit.

Despite there being a median income of $26,905 in Detroit there are neighborhoods in the city where the median household income ranges up to about $103,000. The neighborhoods with the highest median household incomes in Detroit are Palmer Park, Rosedale Park and Indian Village. On the opposite end of the spectrum, there are several Census Tracts where the median household income in 2014 ranged between $8,733 and $15,000. The majority of these Census Tracts were located in the eastern part of the city, around lower/middle Woodward and Rosa Parks. There were also a few near Brightmoor and Chandler Park.

Overall, we see that while regionally Southeastern Michigan had a median household income above the state and national average in 2014 there are several impoverished communities in the region where the median income not only continues to decline, but the poverty rate continues to rise. Although there are pockets of wealth and poverty both located within the region, the majority of the region has a median household income between $30,000 and $90,000.

Poverty in Metro-Detroit spreading through the suburbs

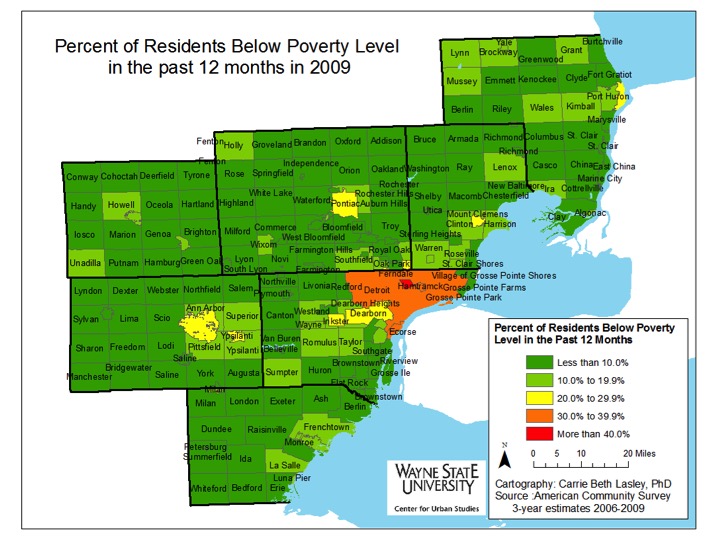
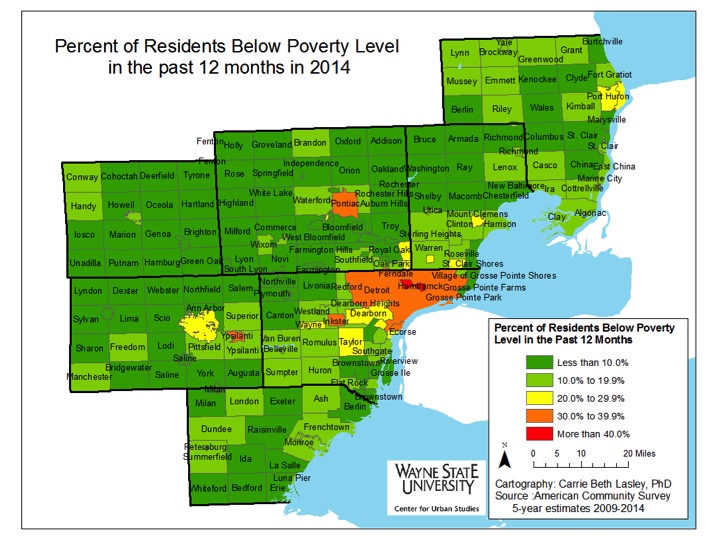
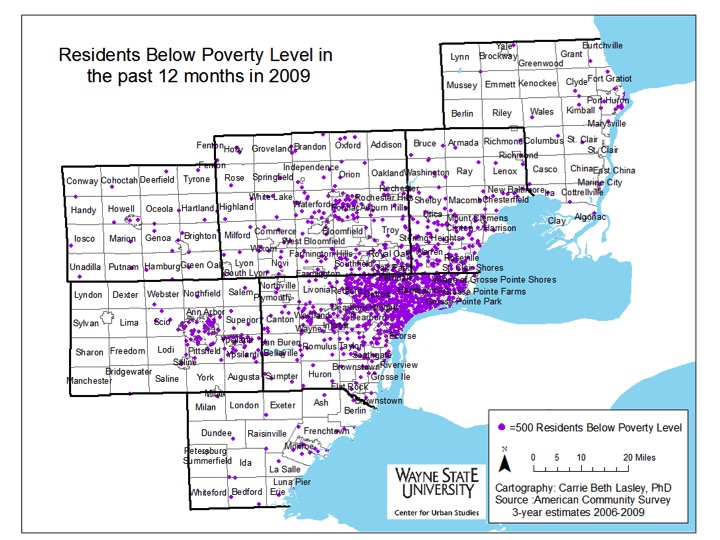
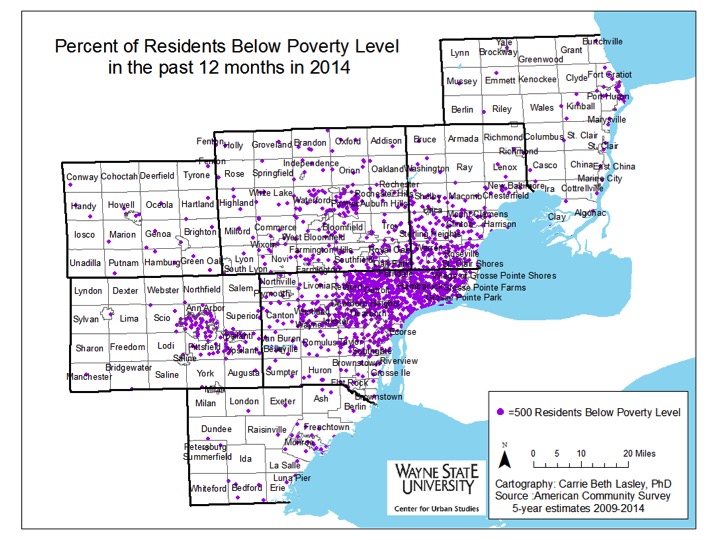
Between 2009 and 2014, poverty levels in the region’s urban communities, such as Detroit, Pontiac and Highland Park, increased, just as they did for some of their suburban neighbors. One might assume that the city of Detroit had the region’s highest percentage of residents living below the poverty level in 2014 due to the amount of press coverage it receives regarding poverty, crime, and various economic indicators. However, the city of Hamtramck, an immediate neighbor to Detroit, actually had the highest percentage of residents living below the federal poverty level in 2014.

This post will examine the percent of residents throughout the region below the poverty level in 2009 and 2014. Both the change in percent and concentration will be shown with various maps. For reference, according to the U.S. government, the Federal Poverty Level (FPL) in 2014 for a family of four was $23,850; in 2009 the FPL was $22,050 for a family of four.

DetroitPoverty2009


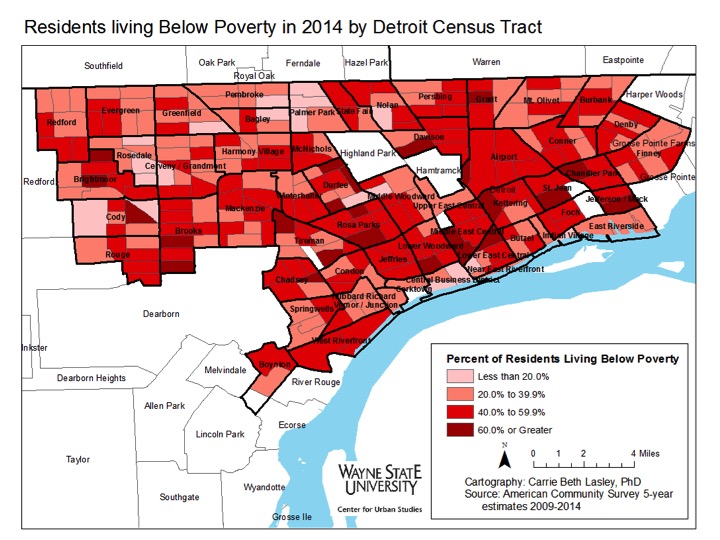
DetroitPoverty2014

In 2014, the cities with 30 percent or more of residents living below the poverty line were:

  • Ypsilanti: 30.6%
  • Inkster: 37 %
  • Pontiac: 37.8%
  • Detroit: 39.4%
  • Highland Park: 47.6%
  • Hamtramck: 48.5%


As mentioned above, in 2014, the city of Hamtramck had the highest percentage of individuals living below the poverty line at 48.5 percent; in 2009, that number was 38.4 percent. In the city of Detroit, the percentage of individuals living below the poverty line increased from 33.2 percent in 2009 to 39.4 percent in 2014.


Each county within the Southeastern Michigan region, with the exception of Livingston County, experienced an increase in the number of communities with a higher percentage of residents living below the poverty line between 2009 and 2014. For example, in 2009, a majority of St. Clair County had less than 10 percent of its residents living below the poverty level, but by 2014 that shifted to between 10-19 percent of residents. There were some communities within that county, though, such as Fort Gratiot and Port Huron Township, which experienced a decrease in the percentage of people living below the poverty level. The higher poverty levels in St. Clair County shifted to the more rural area (the northern part of the county) and to the waterfront communities. Overall, the percentage of individuals living below the poverty line in St. Clair County in 2014 was 15.2 percent.


Another visible increase in the percentage of residents living below the poverty level was in the southern portion of Macomb County. Here, cities such as Eastpointe, Sterling Heights, Center Line and Utica all went from having less than 10 percent of their populations living below the poverty level to between 10 to 19 percent of the populations living below the poverty level. For Eastpointe, just under 10 percent of the population lived below the poverty level in 2009 and in 2014 that percentage increased to 23.5 percent. In Sterling Heights, 7.9 percent of the population lived below the poverty level in 2009, and in 2014 that number increased to 13 percent. Macomb County’s overall poverty rate was 12.2 percent in 2014.

The increase in the percentage of individuals living below the poverty line took place in Wayne County as well, with Redford, Flat Rock, Inkster, Wayne, and the southwest portion of the county all experiencing visible changes. Overall, Wayne County had a poverty rate of 24 percent in 2014.

While several communities throughout the region did experience an increase in the percentage of residents living below the poverty line there were, as noted above, some that experienced a decrease. For example, in 2009, 10.5 percent of the population in Howell Township in Livingston County lived below the poverty line and in 2014 that number was 4.6 percent.

Among the counties in Southeastern Michigan, Livingston County had the lowest percentage of individuals living below the poverty level in 2014 at 5.4 percent. The percentage of individuals living below the poverty level in Oakland County in 2014 was 9.9 percent and in Monroe County it was 11.8 percent.

SEMichiganPoverty2009

SEMichiganPoverty2014

Poverty, while being largely concentrated in the city of Detroit, has shifted outward toward the suburbs between 2009 and 2014, as illustrated above. In Wayne County, areas of Detroit, such as downtown, have experienced decreases in the percentage of individuals living below the poverty line while places such as Westland, Romulus and the western portion of the county have experienced an increase. To the north of Detroit, communities in southern Macomb County, such as Eastpointe, and in southeastern Oakland County, such as Hazel Park and Oak Park, have also experienced an increased percentage in the number of residents living below the poverty line.


Ann Arbor, while not experiencing a shift the magnitude of Detroit’s, has also seen its populations living below the poverty levels shift to nearby areas like Pittsfield and Scio. Additionally, in Ann Arbor, poverty concentration has decreased in the northeastern portion of the city and dispersed throughout the entire city.
 

While the region has experienced a slight shift and a clear growth in concentrated poverty, this isn’t an uncommon trend for other metropolitan areas throughout the Midwest region. According to “Architecture of Segregation: Civil Unrest, the Concentration of Poverty, and Public Policy,” a new study by the Century Foundation, concentrated poverty has spread from within the boundaries of metropolitan cities and into the inner ring suburbs. This has been attributed, in part, to the gentrification and increased taxes of urban communities, which has resulted in the movement of residents who are living below the poverty level to inner ring suburbs with aging infrastructure.

DetroitPovertyChange

DetroitPoverty2009

DetroitPoverty2014


DetroitPovertyConcentration2010

PovertyDetroitDD2014


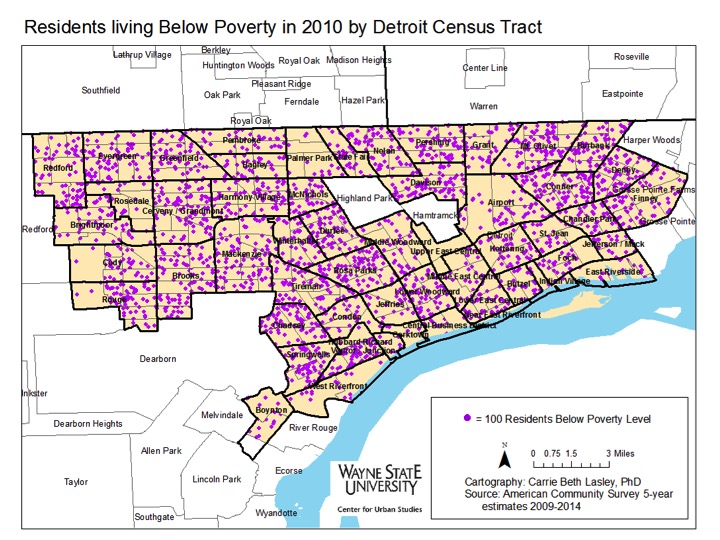
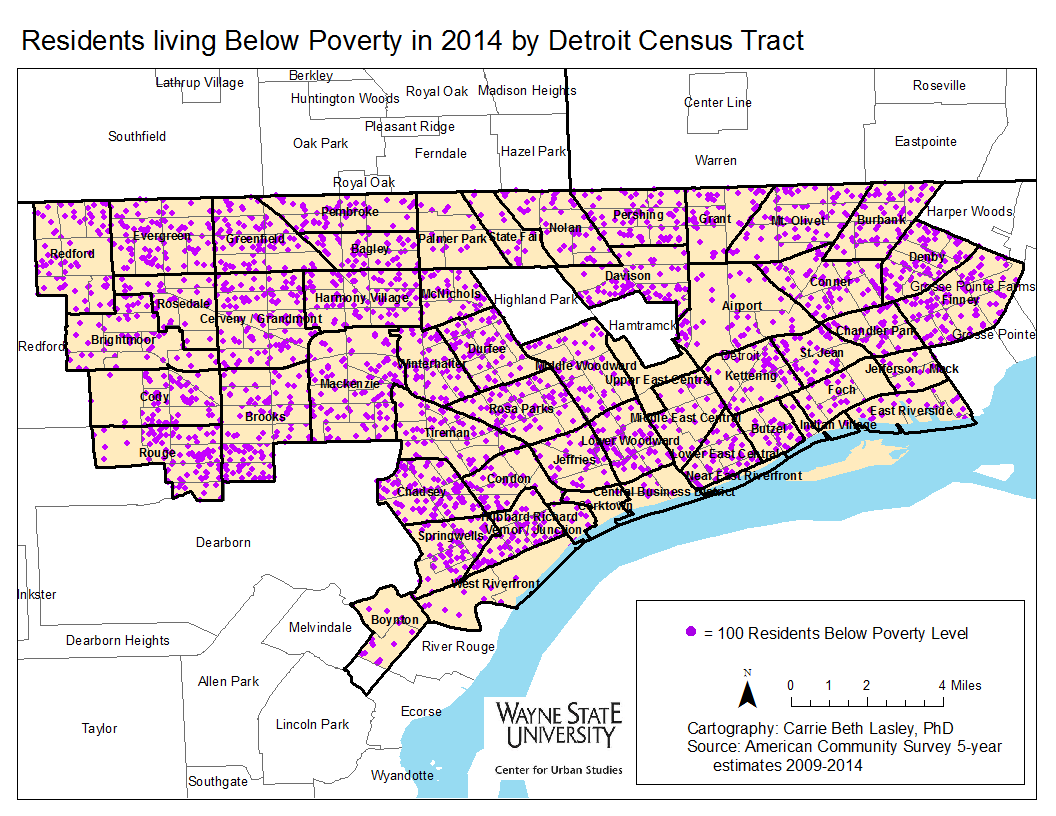
Between 2010 and 2014, pockets of Detroit neighborhoods experienced a decline in the percentage of individuals living below the poverty line while others experienced increases upwards of 20 percent. Concentrations of poverty in Detroit increased in areas such as Cody/Rouge, the neighborhoods bordering Grosse Pointe Farms, along the borders of Hamtramck, and the Southwest neighborhoods of the city.
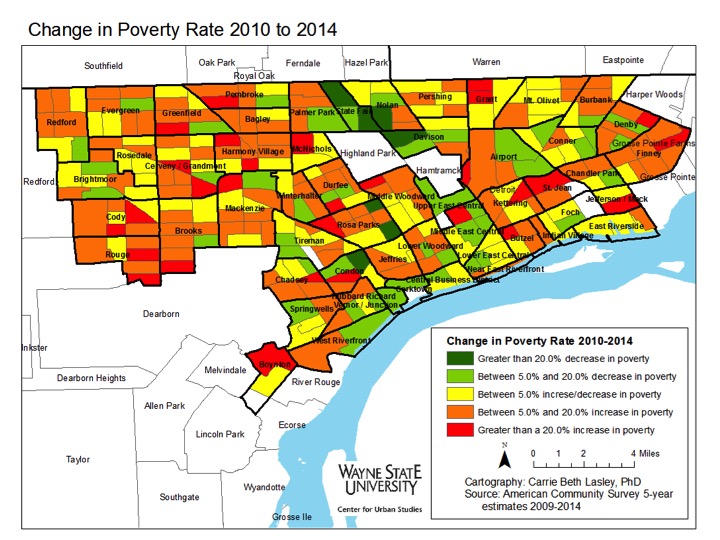
Only about a dozen census tracts had less than 20 percent of individuals living below the poverty line in 2010. A majority of these census tracts were located on the city’s west side, west of Palmer Park and near Rosedale Park, along with about four bordering the Grosse Pointes on the east side. By 2014, a majority of those census tracts experienced at least a 5 percent increase in the percentage of residents living below the poverty level.


The neighborhoods along Woodward Avenue north of Highland Park, such as Palmer Park and Green Acres, experienced some of the largest decreases in the percentage of individuals living below the poverty level in the city of Detroit between 2010 and 2014. The Midtown, East Riverside, and Corktown areas also experienced decreases in the percentage of residents living below the poverty level.


In spite of the positive trends in these neighborhoods, however, high poverty census tracts have dramatically increased in the city of Detroit since 2000, according to the Century Foundation study cited earlier. By 2014, the majority of the census tracts in the city of Detroit had between 40 and 59.9 percent of residents living below the poverty level. As such, even with the improvements made, poverty concentration continues to be a challenge in the city of Detroit.

It is policies, both new and recent, that have helped contribute to the increase in concentrated poverty. From the investment into new infrastructure, rather than fixing what already stands, to urban sprawl and the disproportionate building of homes for the middle class and wealthy to the income increases being felt by the rich, but maintaining stagnant for the poor, there are policies in place that allow the growth of poverty and concentrated poverty to occur.


Various measures of labor utilization show improvement in Michigan’s, Metro-Detroit’s economy

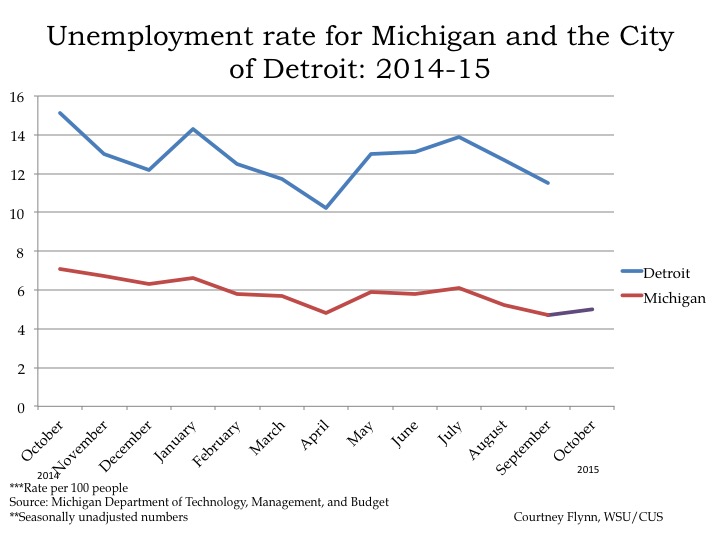
  • From August 2015 to September 2015, the unemployment rate across the state increased and in the city of Detroit (monthly);
  • The Purchasing Manager’s Index for Southeast Michigan decreased from October 2015 to November 2015 (monthly);
  • Commodity Price Index increased from October 2015 to November 2015 for Southeast Michigan (monthly);
  • Standard and Poor’s Case-Shiller Home Price Index for the Detroit Metropolitan Statistical Area shows home prices are still slowly increasing.

Detroit Unemployment

According to the most recent data provided by the Michigan Department of Technology, Management, and Budget, the unemployment rate for the state of Michigan increased from 4.7 percent in September to 5 percent in October. Unemployment in the city of Detroit decreased from 12.7 percent in August to 11.5 percent in September.

Detroit unemployed, discouraged workers


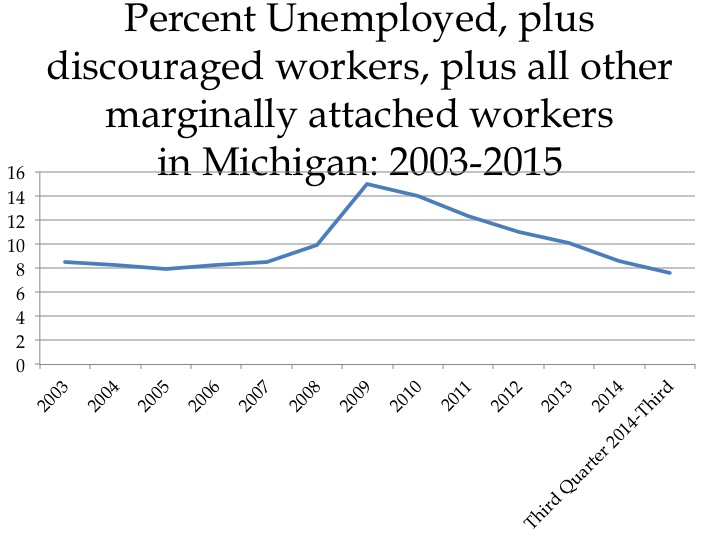
Displayed above is an alternative measure of labor utilization in the state of Michigan at an annual basis. This measure of unemployment, which includes discouraged workers and marginally attached workers, shows that this too has been decreasing. This measure of labor utilization peaked in 2009 at 15 and by the third quarter of 2015 it decreased to 7.6. From 2009 to 2015 there has been a steady decrease.

Detroit's employed


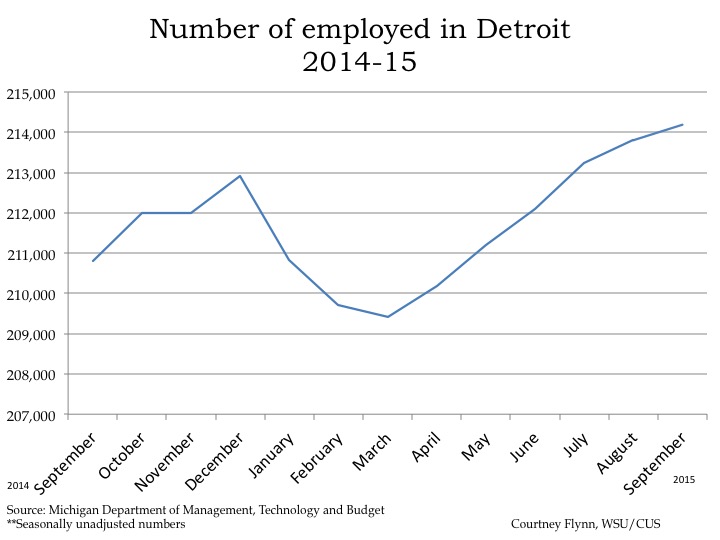
From August to September, the number of people employed in the city of Detroit increased by 386, for a total of 214,192 people employed in the city in September. From March to September, the number of people employed in the city increased by 4,775. In the last year, the month of March had the lowest number of people employed in the city of Detroit.

Auto employment

The above chart shows the number of people employed in the auto manufacturing industry in the Detroit Metropolitan Statistical Area (MSA) (Detroit-Warren-Livonia) from August 2014 to August 2015. From August to September the number of people employed in this industry increased by 1,400, to a total of 106,700. This number is 11,300 more than the number of workers employed in the auto manufacturing industry in September of 2013.

Michigan PMI

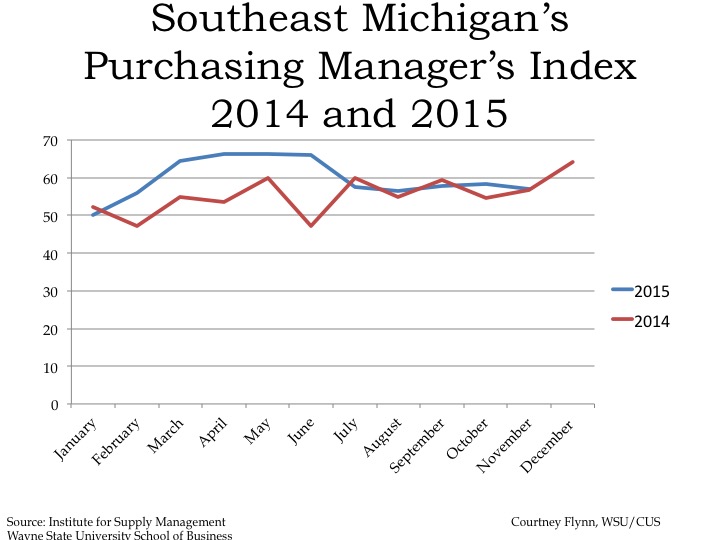
The Purchasing Manger’s Index (PMI) is a composite index derived from five indicators of economic activity: new orders, production, employment, supplier deliveries, and inventories. A PMI above 50 indicates the economy is expanding.

According to the most recent data released on Southeast Michigan’s Purchasing Manager’s Index, the PMI for November 2015 was 57.1, a decrease of 1.3 of a point from the prior month. It was also an increase of .3 from November of 2014.

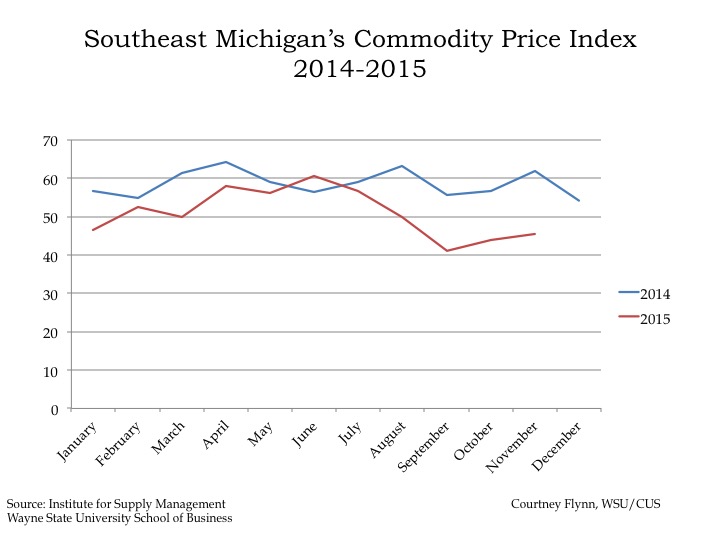
Michigan Commodity Price

The Commodity Price Index, which is a weighted average of selected commodity prices, was recorded at 45.5 points in November 2015, which was 1.7 points higher than the previous month and 16.3 points lower than November 2014.

Detroit Home Prices

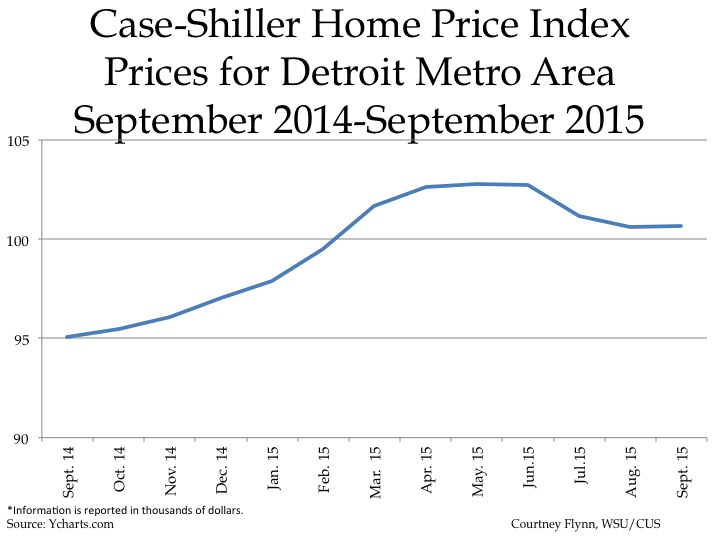
The above charts show the Standard and Poor’s Case-Shiller Home Price Index for the Detroit Metropolitan Statistical Area. The index includes the price for homes that have sold but does not include the price of new home construction, condos, or homes that have been remodeled.

According to the index, the average price of single-family dwellings sold in Metro Detroit was $100,680 in September 2015. This was an increase of $5,610 from September of 2014 and an increase of $50 from August of 2015.

Detroit’s housing costs increasing faster than incomes

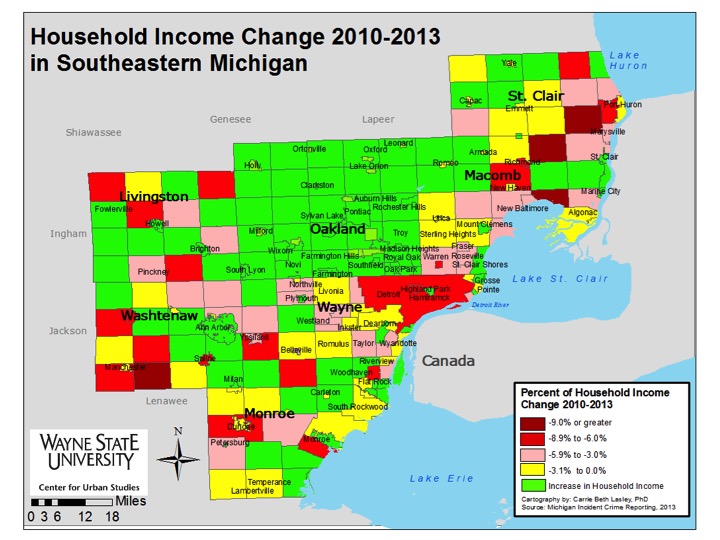
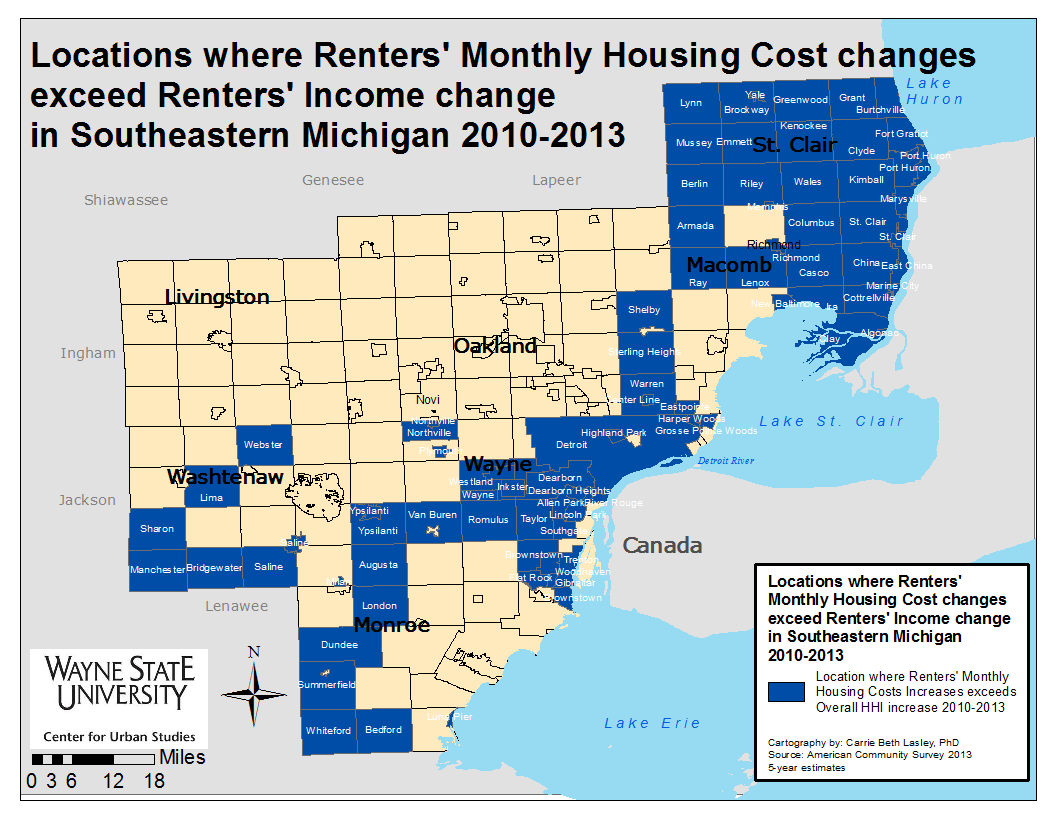
Throughout Southeastern Michigan monthly housing costs for renters are increasing generally faster than their monthly household incomes, which in many cases are actually declining, according to data from the American Community Survey. Even in areas where the renters’ incomes improvements exceeded the change in overall regional housing costs between 2010 and 2013, monthly housing costs continued to increase at a rapid pace. There were areas in the region though, particularly Oakland County, where monthly housing cost increases stayed below the monthly household income increases. However, Detroit’s overall housing costs generally increased at a faster pace than the monthly income changes (largely declines) of residents.

Slide03


Slide04

Between 2010 and 2013 all Oakland County communities experienced an increase in household income while many communities throughout the rest of Southeastern Michigan continued to experience a decrease in their household income. St. Clair County had the most communities where the household income decreased more than 9 percent (three-Columbus, Ira and Kimball townships) between 2010 and 2013; the only other county where a community had such an income decrease was Washtenaw with Bridgewater Township.

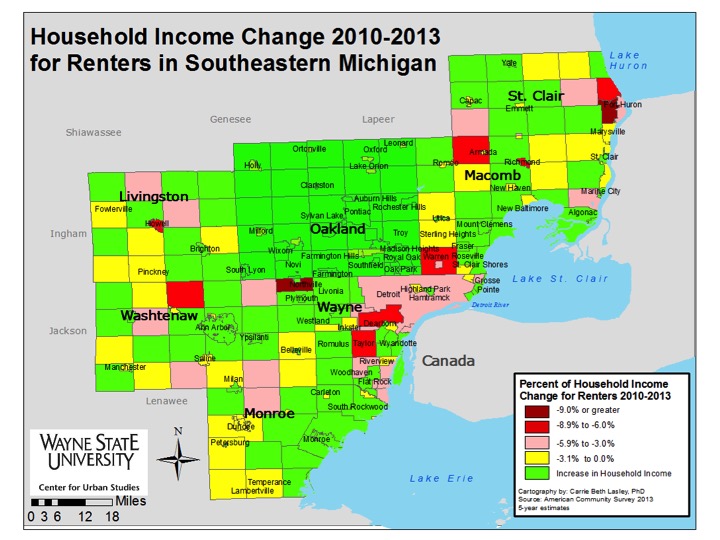
When just looking at renter’s income change between 2010 and 2013 we see that there were fewer households that experienced an income decrease and more that saw their incomes increase.

According to Governing.com, Michigan is one of three states that suffers from housing affordability burdens, particularly in the rental realm. Incomes may be increasing throughout the state, but for renters earning minimum wage, those small increases often equate to the increases in monthly housing costs, especially as demand for rental units remains high.

Slide06

RentMoreHHI (1)
Slide08

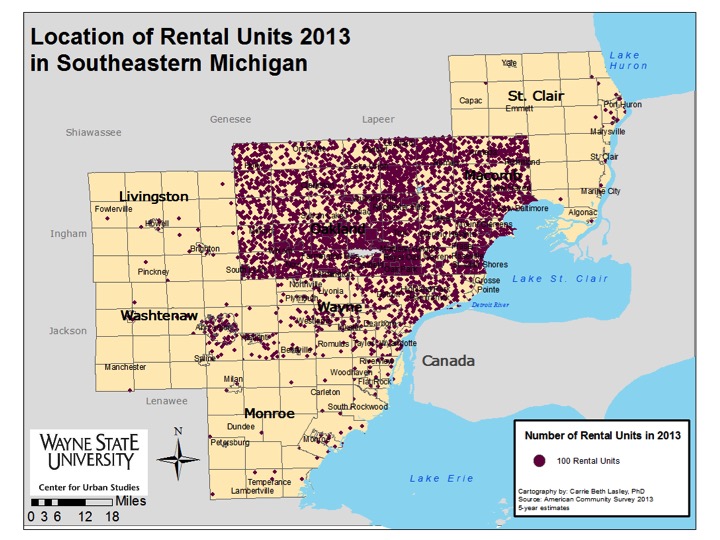
Despite renters throughout the region experiencing income increases, these increases were not equal to or more than their housing costs in several communities. In St. Clair County all of the communities experienced housing cost changes above those of the renters’ monthly income. This was not unique to just St. Clair County though. Rather every county in the region, with the exception of Livingston and Oakland, had renters whose income changes weren’t keeping up with their housing cost increases. With increases in Oakland County’s renters’ income outpacing their monthly housing cost increases this could mean a number of things, including: rental prices are not increasing as quickly as places such as Detroit or Warren because demand is lower; these renters’ incomes are growing as the economy stabilizes (for places like Ferndale, Royal Oak and Rochester we see their income increases are above that of non-renters) while in areas like Detroit the median household income is lower, income growth can’t keep up with cost of housing increases.

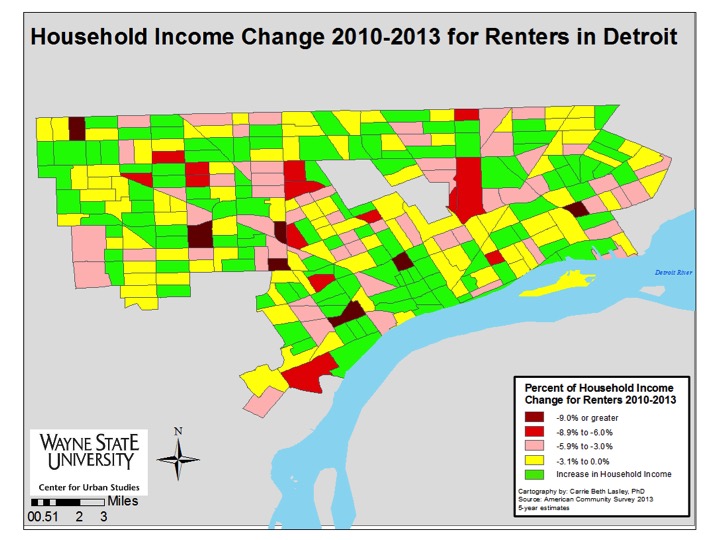
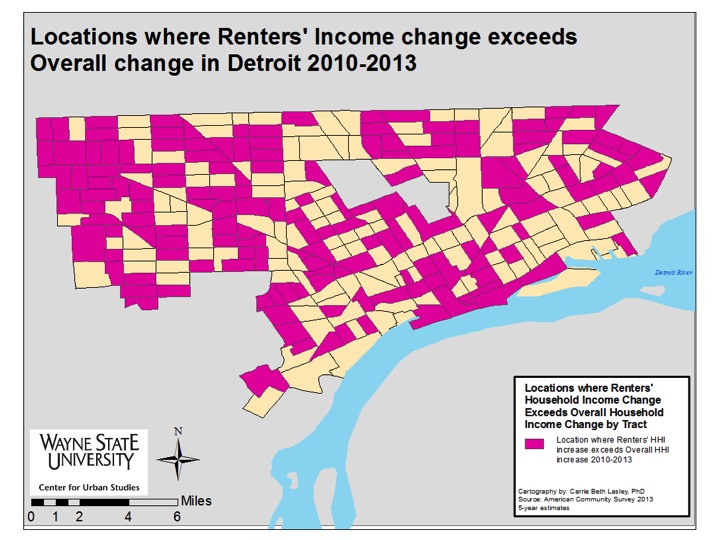
A series of five maps drilling down into the City of Detroit (presented below) shows that pockets of the city experienced household income growth between 2010 and 2013. While there was some overlap between overall income growth and renters’ income growth, this wasn’t true for every Census Tract. One area where there was such a difference was just east of Hamtramck. Here we see that Census Tract experienced overall income growth between 2010 and 2013 but the renters there did not see their incomes increase. Renters in that area also experienced monthly housing cost increases that exceeded their income changes. In this area of the city, homeownership also appears to be more prevalent than in other areas of the city.

Throughout other parts of the city we see that the majority of Census Tracts experienced an increase in renters’ household income between 2010 and 2013. But, the increases in monthly housing cost offset most income increases. This could indicate a shift toward gentrification in some areas as long-term, lower-income renters cannot afford increasing monthly housing costs as demand for rental units in Detroit continues to grow. With a current vacancy rate of 5 percent and a desire for many suburbanites to live in areas such as Downtown, Midtown and Corktown, housing costs in the city continue to grow, according to the MetroTimes (link). It is these areas where renters experienced income growth well above the overall changes in the City of Detroit. Not every Census Tract in these neighborhoods though had renters with income changes above the overall change experienced by the city as whole.

Slide11

Slide12

Slide13

Slide14

Slide15

Detroit rental units