Higher Percentage of Children in Poverty in Southeastern Michigan than Adults

In Southeastern Michigan there is a greater percentage of children under the age of 18 living in poverty in several communities than there is adults living in the same circumstances. Not only is this the case in the region, but also, the percentage of children living in poverty has increased at a more rapid rate since 2000 than it has for those between the ages of 18-64 and for those above the age of 65. This is sad state of affairs.

All data presented here is provided by the U.S. Census Bureau and according to the U.S. Department of Health and Human Services, the poverty threshold for an individual in 2015 was an annual earning of $11,770 and for a family of four it was $24,250.  In 2010 the poverty threshold for an individual was $10,830 and for a family of four it was $22,050. In 2000 the poverty threshold for an individual was $8,350 for a family of four was $17,050.

In the year 2000 the following five municipalities had the highest percentage of children under the age of 18 living in poverty:

  • Highland Park: 45 percent
  • Hamtramck: 36.4 percent
  • Ecorse: 34.9 percent
  • Detroit: 33.9 percent
  • River Rouge: 30.9 percent

In 2010 the municipalities with the highest percentage of children population living in poverty shifted to the following:

  • Highland Park: 58.5 percent
  • Hamtramck: 58.5 percent
  • Ecorse: 51.9 percent
  • Detroit: 46.9 percent
  • Memphis: 46 percent

By 2015 the percentage of children living in poverty had increased still further throughout the region, as can particularly be seen by the top five communities with the highest percentage of children living in poverty. These communities were:

  • Highland Park: 63.8 percent
  • Hamtramck: 62. Percent
  • Detroit: 57.1 percent
  • Inkster: 56.7 percent
  • River Rouge: 54.4 percent


Percent in Poverty Level Changes 2000-2010

Between 2000 and 2010 the LaSalle Township experienced the highest percentage increase of children residing in poverty at 28.4 percent. LaSalle, being a more rural suburban community in Southeastern Michigan, was not the only community with such characteristics to find itself atop the list with the highest percentage increases. Of the 46 communities that experienced more than a 10 percent increases in the percentage of children living in poverty between 2000 and 2010, 11 were inner-ring suburbs.  Detroit experienced a 13 percent increase in the percentage of children living in poverty between 2000 and 2010; Highland Park experienced a 12.8 percent increase and Hamtramck experienced a 22 percent increase. Overall, there were only 39 communities that experienced either no increase in the percentage of children residing in poverty or a decline in the percentage.

When comparing the increase in the percentage of children living in poverty between 2000 and 2010 we see that for both adults between the ages of 18-64 and those over the age of 65, neither group experienced an increase above 17 percent. For children under the age of 18, there were 12 communities where the increase in the percentage of children living in poverty was above 17 percent.

Percent in Poverty Level Changes 2010-2015

Between 2010 and 2015 there were 32 communities in Southeastern Michigan where there was more than a 10 percent increase in percentage of children living in poverty. Of these communities, the top five were nearly all more rural, suburban communities. These communities were:

  • Richmond (city): 35.2 percent
  • Belleville: 24 percent
  • St. Clair: 23.3 percent
  • Melvindale: 23.2 percent
  • Sumpter Township: 21.7 percent

Percent in Poverty Level Changes 2000-2015

Between 2000 and 2015 there were 64 communities in Southeastern Michigan that experienced over a 10 percent increase in the percentage of children living in poverty since 2000 and 173 communities that experienced an increase above 0.01 percent. The top five communities with the largest increases were:

  • Richmond (city): 31.6 percent
  • Inkster: 28.6 percent
  • Royal Oak Township: 28 percent
  • Sumpter Township: 27.6 percent
  • Eastpointe: 26 percent

During this time span we do see that there is a greater number of inner-ring suburbs that experienced increases above 10 percent than there were during the 2000 to 2010 time frame. However, as the map shows above, the suburbs were not protected from the, in some cases drastic, increases in the percentage of children living in poverty.  And, just as the increases were drastic for several communities throughout Southeastern Michigan, they were also far greater than the percentage increases of adults between the ages of 18-64 and those above 65 living poverty during the same time period. For those between the ages of 18-64 the highest percentage increase of those living in poverty was River Rouge at 21 percent. For those above the age of 65 the City of Hamtramck experienced the largest increase at 13.5 percent.

Overall, the data presented in this post conveys two strong messages: Southeastern Michigan has a greater percentage of children living in poverty than adults and the elderly, and the percentage of children living in poverty has been increasing at a faster rate than the adults living in the region. Additionally, the data presented in this post again shows the theme that poverty levels aren’t only increasing in the region’s urban areas, but also in the suburbs and more rural areas.

Southeastern Michigan Suburbs Experience Highest Poverty Increases for Elderly

Since the year 2000 several municipalities in Southeastern Michigan have had consistently the highest percentages of residents over the age of 65 living at or below the poverty level–Highland Park, Hamtramck, Detroit. Remarkably, however, as this post demonstrates the biggest increases in poverty among older adults were in suburbs.

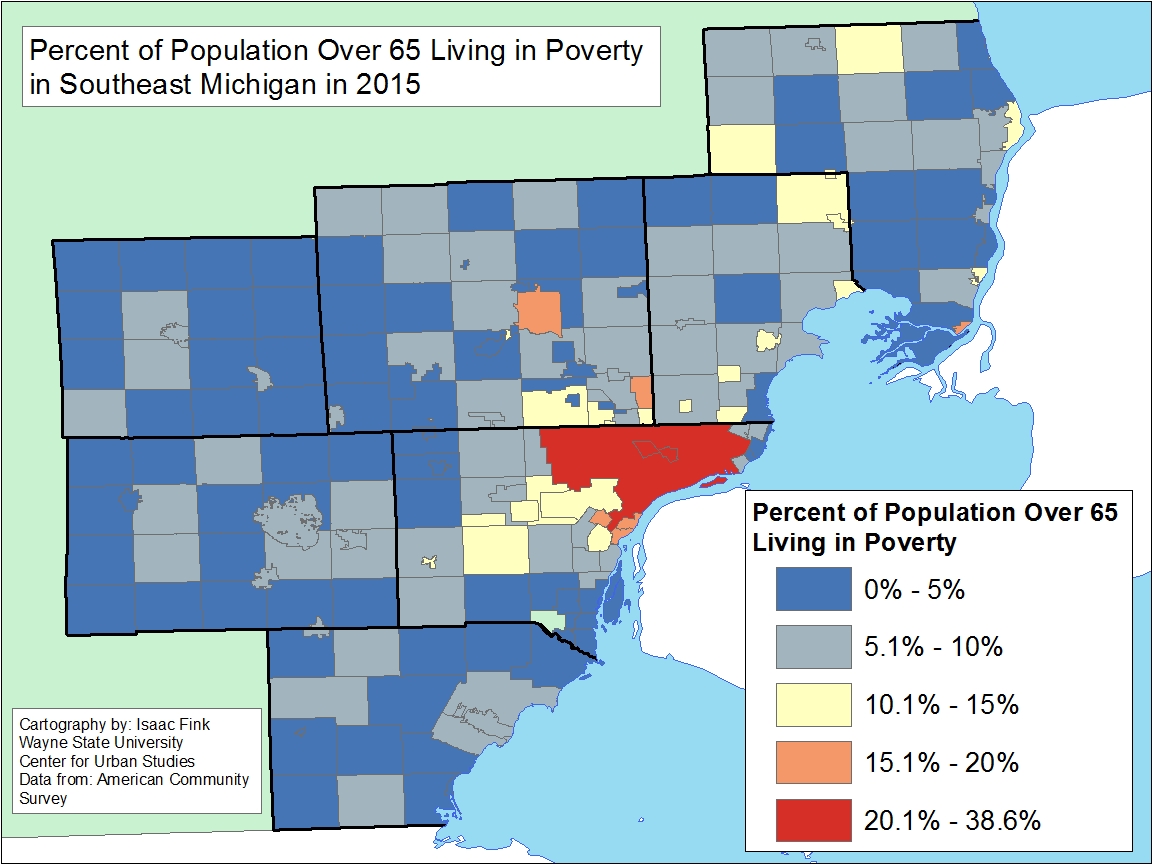
At the same time, the percentage of elderly residents living below the poverty line in Southeastern Michigan municipalities is below that of those between the ages of 18-64 living in poverty. Regionally, in 2015 about 10.3 percent of residents between the ages of 18-64 lived in poverty and about 6.5 percent of residents over the age of 65 and older lived in poverty.

All this poverty data is provided by the U.S. Census Bureau while the U.S. Department of Health and Human Services tell us the poverty threshold for an individual in 2015 was an annual earning of $11,770 and for a family of four it was $24,250. In 2010 the poverty threshold for an individual was $10,830 and for a family of four it was $22,050. In 2000 the poverty threshold for an individual was $8,350 for a family of four was $17,050.

In the year 2000 the following five municipalities had the highest percentage of residents over the age of 65 living in poverty:


  • Royal Oak Charter Township: 32.1%
  • Highland Park: 28.8%
  • Memphis: 19.4%
  • Detroit: 17.9%
  • Hamtramck: 17.4%


In 2010 the municipalities with the highest percentage of elderly living in poverty shifted to the following:


  • Hamtramck: 28.6%
  • Highland Park: 26.1%
  • Oak Park: 23.1%
  • Hazel Park; 22.6%
  • Center Line: 21.9%

Most recently, in 2015, we again saw several of the same municipalities in Southeastern Michigan having the highest percentage of elderly living at or below the poverty line. By this time the percentage of elderly in poverty had continued to increase for several of the municipalities.

  • Highland Park: 38.6%
  • Hamtramck: 30.7%
  • Detroit: 20.4%
  • Melvindale: 19.5%
  • Madison Heights: 17.2%

Percent in Poverty Level Changes 2000-2010

Between 2000 and 2010 the only inner-ring suburb that ranked in the top five for Southeastern Michigan municipalities with the highest increase in the percentage of elderly living at or below the poverty line was Hamtramck. The top five municipalities that experienced the highest change in those 10 years were:

  • Yale (St. Clair County): 15.6%
  • Hazel Park (Wayne County): 15.1%
  • Brighton (Livingston County): 13.9%
  • Marion (Livingston County): 13.1%
  • Lynn Township (Livingston County) 12%

From 2000 through 2010 for the 213 municipalities for which comparable data was available through the American Community Survey, 84 experienced a decrease in the percentage of residents over the age of 65 living in poverty. On the opposite side of the spectrum, about 20 of the communities that experienced an increase in the percentage of elderly living in poverty were direct suburbs of Detroit. However, between 2000 and 2010, Detroit experienced only a 0.7 increase in the percentage of elderly living in poverty. Highland Park, which has typically ranked at the top for the percentage of residents living in poverty and for percentage increases, experienced a 2.7 percent decrease in the percentage of elderly residents living in poverty between 2000 and 2010.

Percent in Poverty Level Changes 2000-2015

Between the years 2000 and 2015, the increase in poverty among older residents was on par with the increases experienced for several municipalities between the years 2000 and 2010. During this time period, the City of Hamtramck experienced the largest increase at 13.5 percent, followed by Berlin Township (St. Clair County) and Melvindale. These were the only three communities in Southeastern Michigan that experienced increases above 10 percent in the percentage of elderly residents living in poverty. Additionally, there was an overall increase in the number of communities between 2000 and 2015 that experienced a decrease in the percentage of residents over the age of 65 living in poverty. Of the 213 municipalities for which comparable data was available, 94 experienced a decrease. However, Highland Park experienced about 9 percent increase in the percentage of older residents residing in poverty between 2000 and 2015, and Detroit experienced about a 2.5 percent increase. Still the remarkable trend was the tendency for poverty among older adults to increase in the suburbs.

Percent in Poverty Level Changes 2010-2015

Between 2010 and 2015, Highland Park experienced the largest increase in the percentage of residents over the age of 65 living in poverty. During this time frame, Highland Park experienced an increase of about 12.5 percent; Berlin Township followed with an increase at about 10.8 percent. These two communities were the only ones in the region that experienced increases for the percentage of residents over the age of 65 living in poverty above 10 percent between 2010 and 2015.

Additionally, between 2010 and 2015, the number of communities that experienced a decrease in the percentage of elderly residents living in poverty decreased. In total, of the 213 communities for which data was available for, 102 experienced a decrease in the percentage of residents living in poverty.

Overall, this post shows that currently, and overtime, there is a smaller percentage of resident over the age of 65 living in poverty. Compared to last week’s post, which focused on those between the ages of 18-64 (typically those of working age) we see that there is a higher percentage of residents between the ages of 18-64 living in poverty and that those percentages across the region have increased for those in that age bracket. For the elderly population though, the percentage of residents residing in poverty has increased overtime for a number of municipalities, but majority of the region experienced a decrease.

Southeastern Michigan’s Poverty Levels Have Increased Since 2000

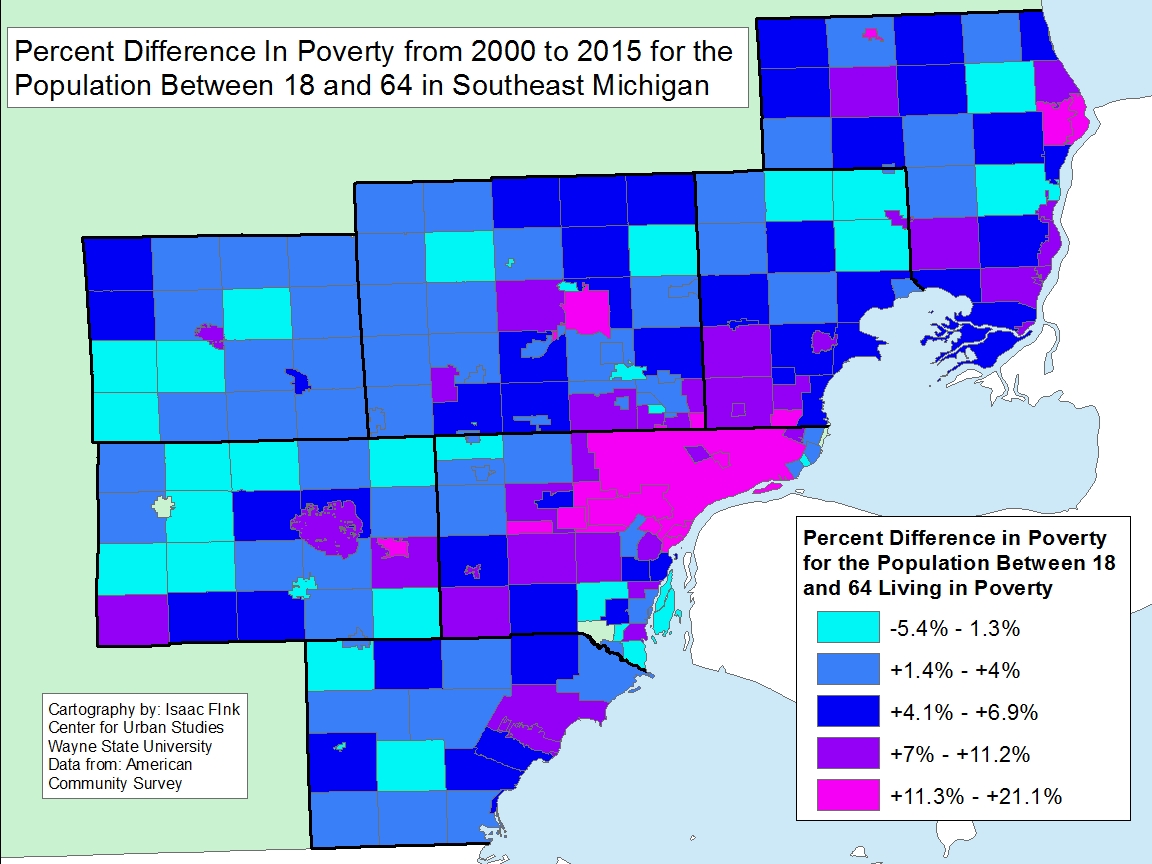
This post explores how the percentage of residents between the ages of 18-64 living in poverty has increased throughout Southeastern Michigan since 2000 and 2015. The bottom line here is that the substantial majority of communities saw increases, some of them substantial, in poverty over the years 2000 through 2015. Only 10 saw decreases.

All data is provided by the U.S. Census Bureau and the U.S. Department of Health and Human Services. In 2000 the poverty threshold for an individual was $8,350, and for a family of four it was $17,050. In 2010 the poverty threshold for an individual was $10,830, and for a family of four it was $22,050. The poverty threshold for an individual in 2015 was an annual earning of $11,770, and for a family of four it was $24,250.

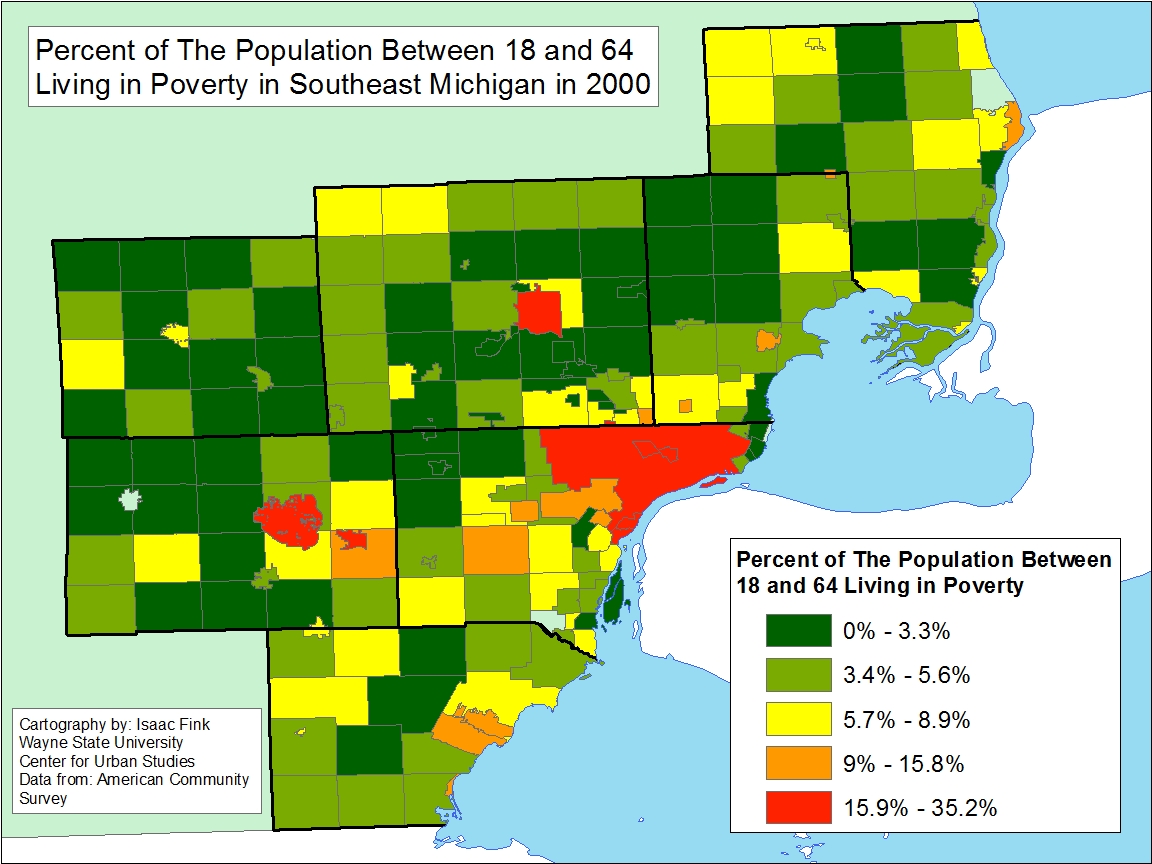
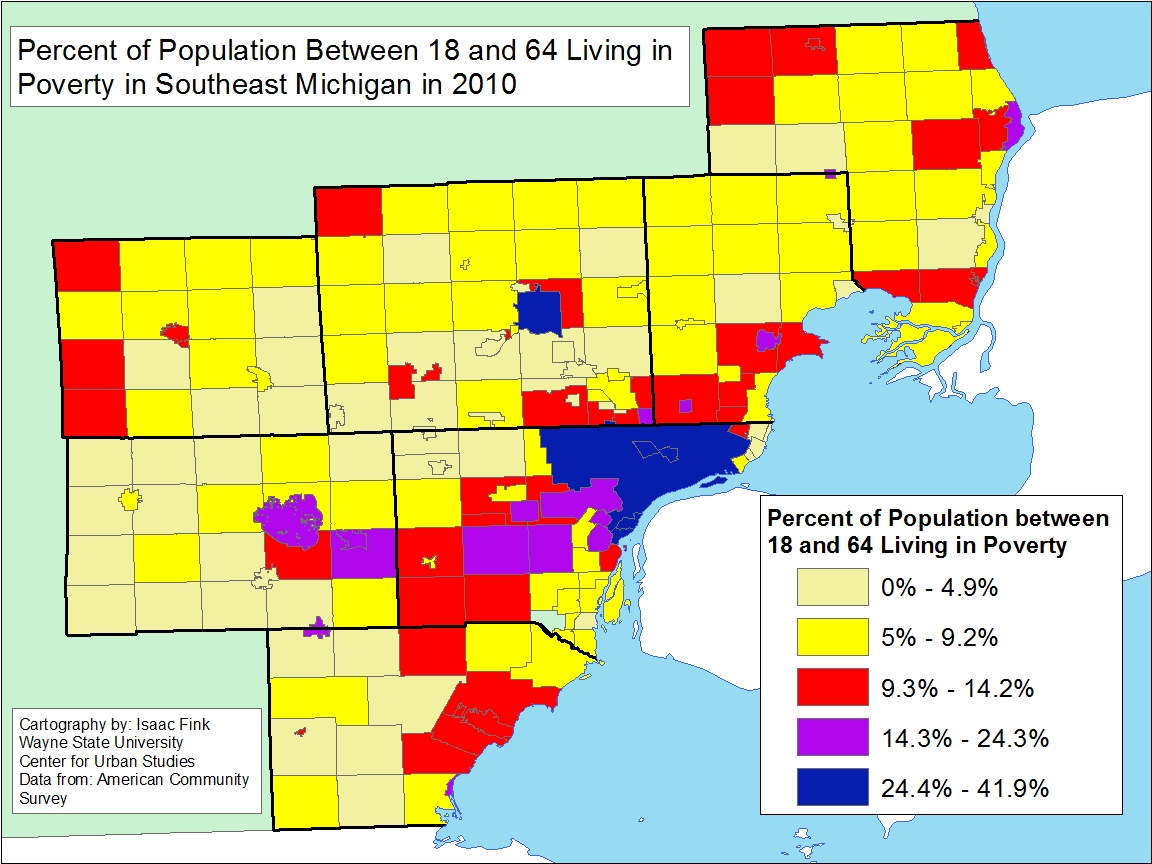
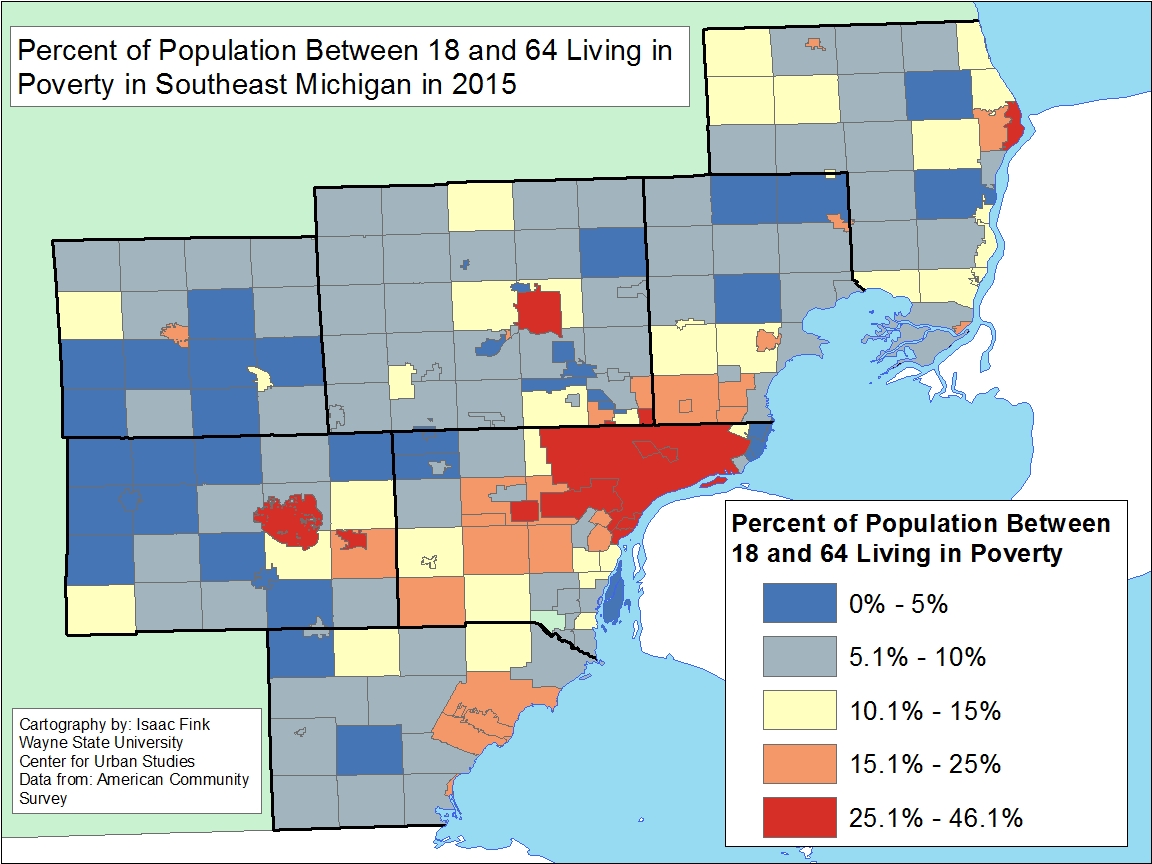
According to data from the U.S. Census Bureau, the City of Highland Park had the highest percentage of individuals between the ages of 18-64 living in poverty in the years 2000, 2010 and 2015. Between each of the years the percentage has continued to grow. In 2000, the Census reported that 35 percent of the adult population between the ages of 18-64 was living in poverty in Highland Park. In 2010 that number increased to 42 percent and by 2015, 46.1 percent of the adult population between the ages of 18-64 in Highland Park was living in poverty. Just as Highland Park remained at the top of the list for the percentage of individuals between the ages of 18-64 living in poverty, the top five Southeastern Michigan communities with the highest poverty levels didn’t shift much from year-to-year. The data are displayed below.

2000

  • Highland Park: 35%
  • Detroit : 23%
  • Hamtramck: 23%
  • Ypsilanti: 20%
  • River Rouge: 20%

2010:

  • Highland Park: 42%
  • River Rouge: 36%
  • Hamtramck: 35%
  • Detroit: 31%
  • Royal Oak Township: 28%

2015:

  • Highland Park: 46%
  • Hamtramck: 41%
  • River Rouge: 41%
  • Detroit: 38%
  • Ypsilanti: 34%

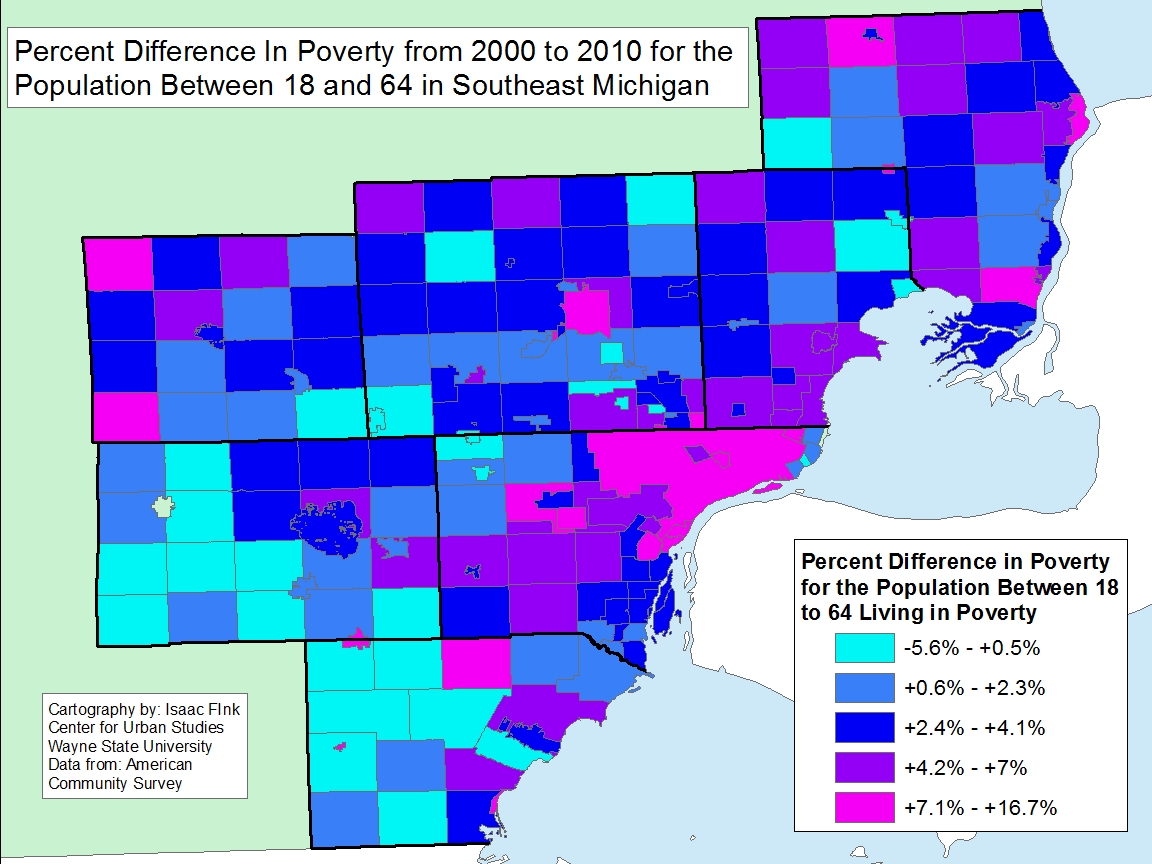
Percent in Poverty Level Changes 2000-2010

When viewing how poverty levels have increased over time, the data shows that between the years 2000 and 2010 the City of Memphis (on the border of St. Clair and Macomb Counties) had the highest percentage increase of individuals between the ages of 18-64 living in poverty at about 17 percent. River Rouge and Hamtramck followed in the number two and three spots with percentage increases at 16 and 12, respectively. Highland Park experienced an increase at 7 percent while Detroit experienced an 8 percent increase.

Percent in Poverty Level Changes 2000-2015

Expanding the range of dates from 2000 through 2015, River Rouge, Hamtramck and Port Huron Township had the highest increases in the percentage of individuals between the ages of 18-64 in poverty between 2000 and 2015. For River Rouge that increase was 21 percent; Hamtramck had a 19 percent increase, and Port Huron Township had a 19 percent increase. In Detroit the percentage increase for individuals in poverty between the ages of 18-64 was 15 percent, and in Highland Park it was 11 percent.

In total, of the 213 communities in Southeastern Michigan for which long-term poverty data was available there were only 10 that experienced a decrease in the percentage of individuals between the ages of 18-64 living in poverty between 2000 and 2015. On the opposite side of the spectrum, there were 27 communities where the percentage increase of individuals in poverty was at 10 percent or above; less than 10 of those communities were outside the direct Detroit suburbs.

Percent in Poverty Level Changes 2010-2015

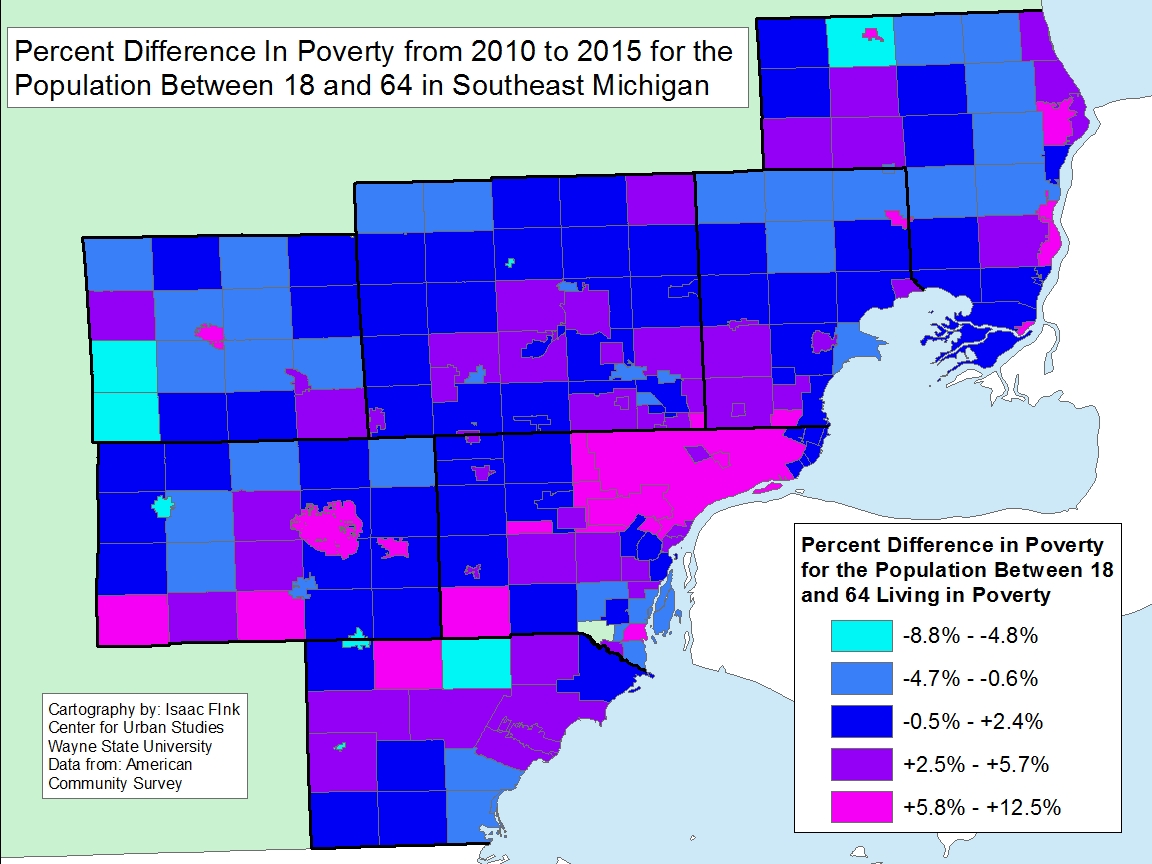
Finally, we examine the change in the percentage of individuals between the ages of 18-64 in poverty between the years 2010 and 2015 the data shows that the highest increases occurred in the more rural areas of the region. For individuals between the ages of 18 and 64 the city of Richmond had the highest percentage increase of residents living in poverty at 13 percent. Ypsilanti and the City of Yale both had 12 percent increases. London Township and Port Huron Township were the only other two communities in Southeastern Michigan where the percentage increase of the individuals between the ages of 18-64 was above 10 percent. The City of Detroit experienced a 7 percent increase and Highland Park experienced a 3 percent increase in the percentage of individuals between the ages of 18-64 who lived in poverty between the years 2010 and 2015.

Between 2010 and 2015 there were 58 communities in Southeastern Michigan where the percentage of individuals living in poverty decreased. The City of Unadilla had the largest decrease at 9 percent. None of the communities that experienced a decrease in the percentage of individuals between the ages of 18-64 were an inner-ring suburb of Detroit. The communities with decreases in poverty levels around 5 percent and above were located on the more outer edges of the region.

While the data shows that poverty levels have continued to increase for majority of the communities across the region, there are signs that the growth of poverty levels are decreasing. Between 2010 and 2015 there was a smaller number of communities who experienced an increase in poverty levels than between 2000-2010 or 2000 to 2015. The data comparing 2010 and 2015 levels also shows the percentage of poverty levels decreasing above 6 percent in certain communities, a statistic that was not achieved in the 2000 to 2010 comparisons and the 2000 to 2015 comparisons. However, the data does indicate that long-term poverty level growth appears to have been primarily concentrated in Detroit and its inner-suburbs. The more recent poverty data though (2010-15) shows that higher poverty levels are also being seen in the more rural areas.

Next week we will view how poverty levels are affecting the elderly population.

Highland Park has Highest Poverty Rate in Southeastern Michigan

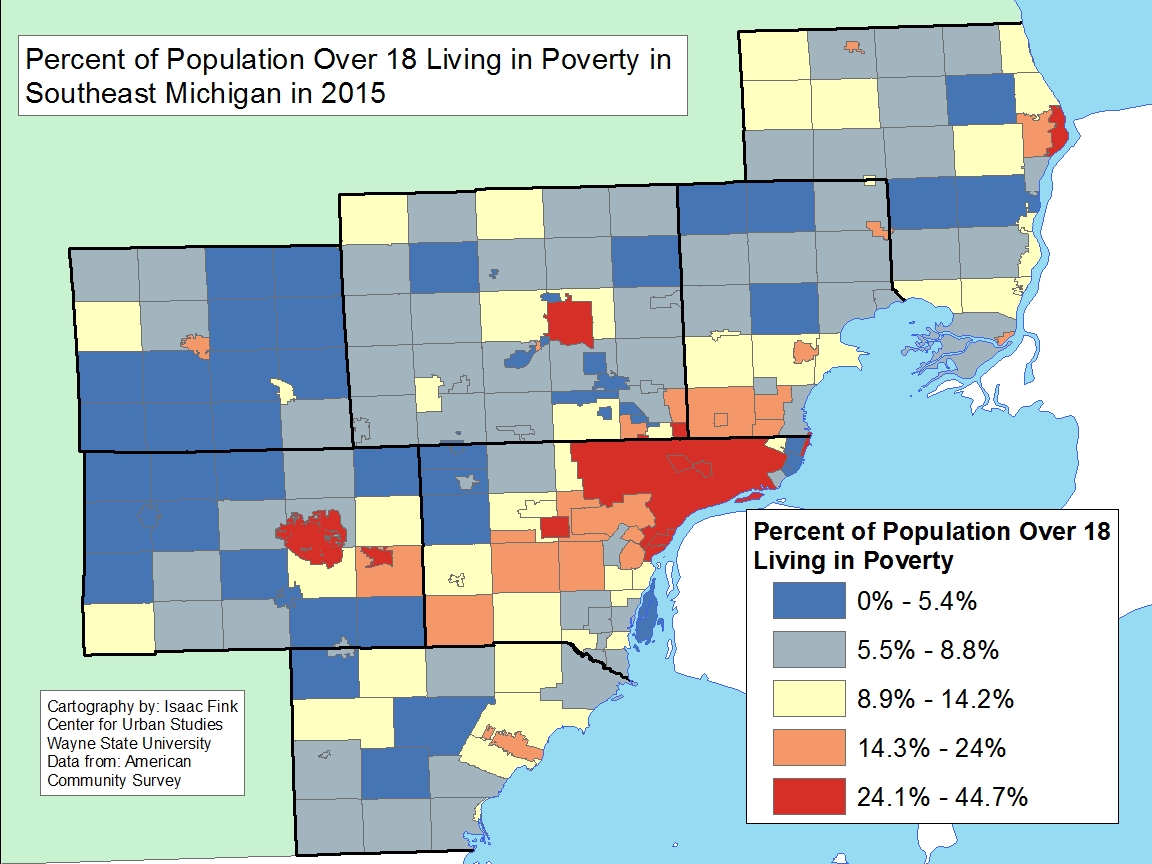
In 2015, the highest levels of poverty were concentrated within the City of Detroit and its inner-ring suburbs, according to data from the U.S. Census Bureau. Highland Park, which is surrounded by the City of Detroit, had the highest percentage of residents aged 18 or older living at our below the poverty level at 44.7 percent. In Hamtramck, 28 percent of the adult were living below the poverty level in 2015, and in the City of Detroit, 25.5 percent of the adult population was living below the poverty level.

In 2015, according to the U.S. Department of Health and Human Services, the poverty threshold for an individual was an annual earning of $11,770 and for a family of four it was $24,250.

When breaking down the adult population into two groups, those between the ages of 18-64 and those above the age of 65, Highland Park and Hamtramck, respectively, again had the highest poverty percentages. In Highland Park, 46.1 percent of the population between the ages of 18 and 64 lived at or below the poverty level, and 38.6 percent of the population above the age of 65 lived at or below the poverty threshold. In the City of Hamtramck, 41.7 percent of the population between the ages of 18-64 lived at or below the poverty level, and 30.7 percent of those above the age of 65 lived at or below the poverty level. In Detroit, 37.5 percent of the residents between the ages of 18-64 lived at or below the poverty level in 2015, and 20.4 percent of those above the age of 65 lived at or below the poverty level.

On the opposite end of the spectrum, there were 134 communities in Southeastern Michigan (of the 214 total municipalities) where less than 10 percent of those between the ages of 18-64 lived at or below the poverty level. Additionally, there were 175 communities in the region where less than 10 percent of those above the age of 65 lived at or below the poverty level.

The communities with the lowest percentages of their adult populations living at or below the poverty level were primarily concentrated in the western area of the region, with several being located in Washtenaw County.

While the highest poverty levels were concentrated around the City of Detroit, poverty levels across the region have increased. This data will be explored next week by comparing Census poverty level data for the years 2000, 2010 and 2015.

Indicators Show Growth For Housing in Southeastern Michigan

In Southeastern Michigan, home prices are on the rise, as are the number of housing units being built, while mortgage rates appear to be slowly, and slightly, decreasing. Such indicators, which are more closely examined in this post, speak to a slow ongoing recovery in housing and possibly higher homeownership rates. However, since the number of building permits being pulled include many multi-family units, it is perhaps also true that higher rents, a trend we have been following, are drawing more investment into rental housing.

Above are three average 30-year mortgage interest rates at the national, state and local levels. These rates were provided by bankrate.com, which does a national survey of large lenders on a weekly basis. As a 30-year fixed rate mortgage is the most traditional type of home financing, this was chosen to show the rate differences. On average, the State of Michigan had the lowest average interest rate for the week of July 12 at 3.84, which was 0.02 points higher than the last time we examined that data. Of the three months for which we have examined mortgage rates, Michigan’s continues to remain the lowest.

Also during the week of July 12, 2017 Detroit’s average 30-year fixed mortgage interest rate was higher than the national average. At this point in time, Detroit’s average was 4.06 and the national average was 4.03. Between May and July, the 30-year fixed mortgage rate for the Detroit area decreased (it was 4.12 in May and was 4.06 the week of July 12) but it increased by 0.01 on the national level (it was 4.02 in May).

The above charts show the Standard and Poor’s Case-Shiller Home Price Index for the Detroit Metropolitan Statistical Area. The index includes the price for homes that have sold but does not include the price of new home construction, condos, or homes that have been remodeled.

According to the index, the average price of single-family dwellings sold in Metro Detroit was $115,610 in April 2017. This was an increase of $10,390 from April of 2016 and an increase from $16,110 from April of 2015 and an increase of $20,750 from April of 2014. Between just March and April of this year the average home price in the region increased by $2,030.

Between 2006 and 2016, according to the Southeastern Michigan Council of Governments, the number of building permits pulled dropped to a low in 2009, mid-recession. The number of building permits reported for each county includes single family, two family, attached condo and multi-family units.

The number of building permits pulled have recovered for all seven counties in the region since the 2009 nadir. However, only three of the seven counties have outpaced their 2006 numbers. These counties are Livingston County, Oakland County and Washtenaw County. The difference between the number of 2006 building permits and 2016 building permits for each of these three counties are:

  • Livingston: 59
  • Oakland: 786
  • Washtenaw: 405

Of the four counties where building permit numbers have yet to recover to 2006 numbers or beyond, Macomb County had the biggest difference at 739. In 2006 there 2,626 building permits pulled in Macomb County and in 2016 there were 1,887. For Wayne County, there was 356 difference in that time frame. There were 2,766 building permits in Wayne County in 2006 and in 2016 there 2,410.

Overall, in 2016, Oakland County had the highest number of building permits pulled at 3,088. Oakland County has had the highest number of permits pulled, regionally, since 2012 when it surpassed Wayne County.

According to the 2015 American Community Survey, Wayne County had the lowest percentage of occupied housing units at 83 percent, meaning there was a 17 percent vacancy rate in the county in 2015. Macomb County on the hand had the highest occupied housing unit rate in the region at 94 percent. Livingston, Oakland and Washtenaw counties all had 93 percent occupied housing unit rates, and Monroe County had a 92 percent occupied housing unit rate. The only other county in the region that had an occupied housing unit rate below 90 percent was St. Clair County. In 2015, St. Clair County had an 89 percent occupied housing unit rate.

In 2015, according to the American Community Survey, Livingston County had the highest home-ownership percentage at 84.6 percent while Washtenaw County had the lowest at 59.8 percent. It should be noted though that the University of Michigan is located in Washtenaw County, meaning off-campus student housing is typically made up of rental units. In Wayne County, the percentage of owner-occupied housing units was 63 percent. It was only Washtenaw and Wayne counties where the percentage of homeowners was below 70 percent.

Southeastern Michigan Median Incomes Have Yet to Catch Up to Pre-Recession Numbers

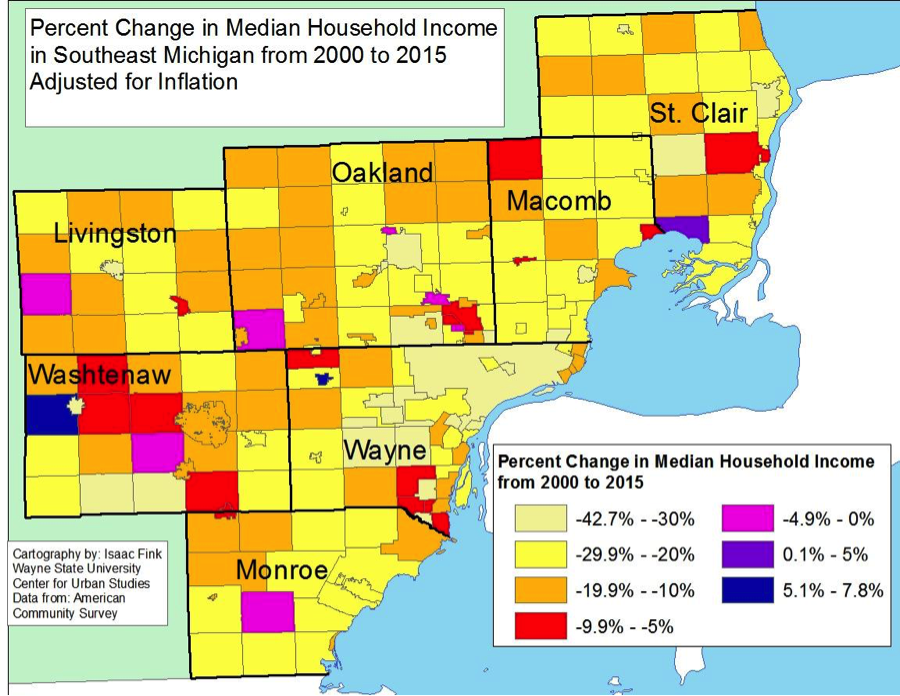
Between 2000 and 2015 median incomes in cities and townships throughout Southeastern Michigan declined by an average of 20 percent, according to U.S. Census Data. This percentage, and all percentages discussed in this post were adjusted to 2015 dollars to best show the true decline in incomes throughout the region. (Note that this percentage is the average across cities and townships, each treated equally. Therefore it will be different from a number aggregated across individuals as opposed to municipalities.)

In our last post we highlighted how the city of Bloomfield Hills had the highest median income at $172,768 in 2015. This data shows that incomes for Southeastern Michigan’s highest income community decreased by 26.5 percent overall from 2000 through 2015, but this broken down between a 36.7 percent decline between 2000 and 2010 and a 16 percent increase between 2010 and 2015. These statistics further add weight to the narrative that the wealthiest are financially bouncing back much more quickly since the recession, while the middle class and low income families have been making minimal gains, at best. Between 2010 and 2015 there were 15 communities where median incomes increased at least 20 percent. Of those communities, the average median income in 2015 was about $77,000 while the average median income for the region was about $66,500. In total, there were 117 communities in Southeastern Michigan that experienced an increase in median income between 2010 and 2015. On the opposite end of the spectrum, there were 10 communities with median incomes above $80,000 in 2015 that experienced a decline in median income between 2010 and 2015; of those 10 communities seven experienced a decline of less than 5 percent.  

Between 2000 and 2010 there were only 5 communities that experienced median income growth. Overall though, the average change in median income (adjusted) between 2000 and 2010 was negative 22 percent; there were 136 communities in Southeastern Michigan that experienced median income declines above 20 percent during that time frame.


There were 117 communities in Southeastern Michigan that experienced an increase in median income between 2010 and 2015. These communities showed an average increase of almost 10 percent. At the same time, 91 communities in the region experienced decreases in median income by an average of roughly 6 percent. Between 2010 and 2015 median incomes in all of Southeastern Michigan increased by an average of nearly 3 percent.


While the data shows a modest median income growth post recession (2010 to 2015), median incomes were down by approximately 20 percent in 2015 compared to what they were in 2000. Since then, there have been only 5 communities that have experienced any median income growth—City of Northville, Sylvan Township, City of Plymouth, Ira Township and City of Memphis. All of these communities experienced an increase in median incomes under 10 percent, with two of them being lower that 5 percent. The other 203 communities in the region exhibited decreases in median incomes by an average of almost 21 percent between 2000 and 2015. It is clear that majority of the regional population is still trying to earn back the wages that once existed in the early years of this century.


The city of Hamtramck experienced one of the largest decline at 34 percent. For the city of Hamtramck, there was an even larger decrease in the adjusted median income between 2000 and 2015 than there was between 2000 and 2010. In 2000 the median income for Hamtramck (adjusted to 2015 dollars) was $36,634 and in 2015 it was reported at $23,759; overall there was a 35 percent decrease. The city, which has one of the region’s lowest median incomes, also experienced a decline in median income between 2010 and 2015.


The city of Detroit is another community where the median income decreased since both 2000 and 2010. According to the data, Detroit experienced a 36 percent median income decrease since 2000 and a 9 percent median income decrease since 2010. In 2000 the median income was reported at about $40,000 (adjusted for inflation) and in 2010 it was reported at about $28,000 (adjusted for inflation). The 2015 median income for the city of Detroit was about $25,000.


Overall, the data show that economic growth since the recession has been slow, at best. Majority of the communities in Southeastern Michigan have yet to recover to their adjusted 2000 incomes. Studies suggest that has to do with several factors, including job availability, average wages, out migration and educational attainment. In this series, we will further explore these factors to better help highlight why the growth has been so slow and what areas are suffering the most.

Bloomfield Hill’s Median Income Ranks Top in Southeastern Michigan

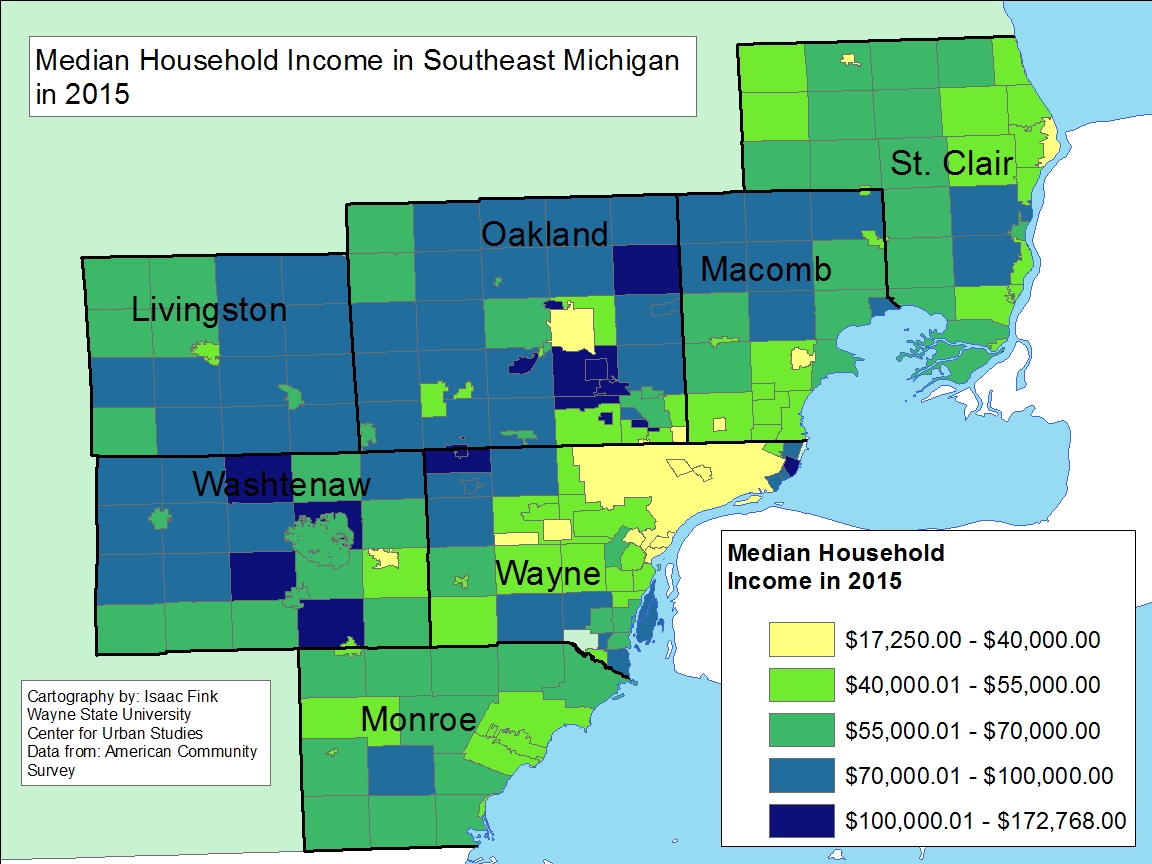
In Southeastern Michigan the average median income was $50,750 in 2015, according to the American Community Survey. Of the seven counties in the region, Wayne County had the lowest median income at $41,210 while Livingston County had the highest at $75,200. Although Livingston County had the highest median income in the region it was Oakland County that had the most number of communities with median incomes above $100,000. In total, there were 12 communities in Oakland County with median incomes above $100,000 and the city of Bloomfield Hills had the highest median income, both county and region-wide, at $172,768.

Income disparity is a growing issue at the national and local levels. In Michigan, this disparity is particularly exemplified due to the fact that the average hourly wage in the state has decreased from what it was a decade ago. According to a recent Crain’s Detroit article, the median hourly wage in Michigan in 2017 is $17.32 and in 2007 it was $18.67. In 2010 in Michigan, residents had a 46 percent chance of out earning their parents, according to a recent Stanford study, which is highlighted in the Crain’s article. The example in the article used to highlight this decline in wages is that in 1977 a newly employed high school graduate at General Motors was earning about $26 an hour (number adjusted with inflation) and today that wage is about $16. Other aspects that contribute to an individual’s economic mobility include access to jobs, particularly those with higher wages, and educational attainment.

In next week’s post we will see how median income has changed regionally since 2000 and 2010, further exploring the claim that upward mobility has declined.


Percentage of Occupied Rental Units Continues to Climb in Southeastern Michigan

There were nine municipalities in Southeastern Michigan that experienced more than a 100 percent increase in occupied rental units between 2010 and 2015, according to the American Community Survey. Sylvan Township in Washtenaw County had the largest increase at 301 percent. In 2010 the township had 2.32 percent of its housing stock serving as filled rental units and by 2015 that increased to 9.3 percent, or a total of 109 rental units. Overall in Sylvan Township in 2015 there were 1,169 occupied housing units. All the municipalities with such high rental rate increases were among the smaller communities in the region.

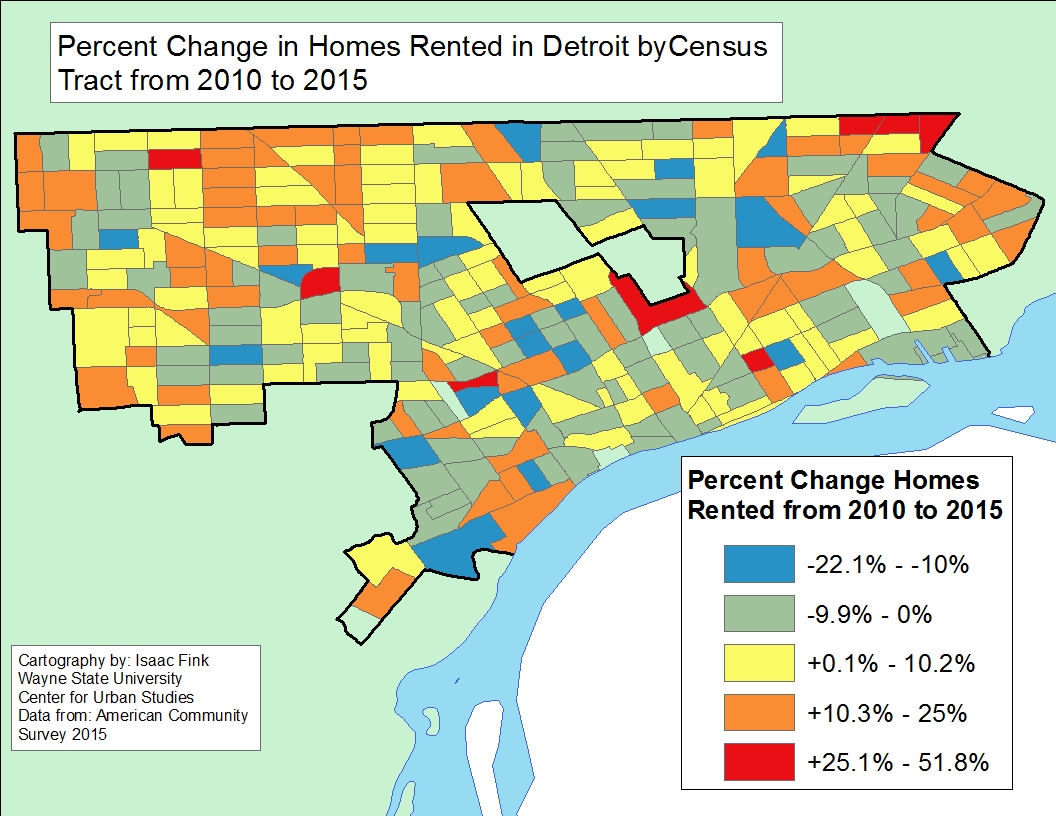
Detroit, the largest city in the region, had an 11 percent increase in rental units. In 2010, 46 percent of the city’s occupied housing stock was rental units and in 2015 that number increased to 51 percent, or about 124,000 units. There were only four Census tracts in Detroit (two in the north east corner and two on the west side) where the percentage of rental units increased by more than 150 percent. The northwest area of the city had about 25 Census tracts that experienced an increase between a 25 and 75 percent in occupied rental units. On the opposite side of the spectrum, there were 178 Census tracts in Detroit where the percentage of occupied rental units decreased by up to 60 percent. The data we are looking at in this post is related to occupied housing units, meaning increases and decreases can be directly correlated with the number of occupied rental units and overall occupied housing units. Overall, in 2010 in Detroit there were about 272,000 occupied housing units, of which about 124,000 were rentals. In 2015 the total number of occupied housing units decreased to about 256,000 while the number of rental units increased to about 129,000.


In a recent post we discussed how Highland Park had the highest percentage of occupied rental units in the region at 64 percent. Between 2010 and 2015 there was an overall 6 percent increase. In 2010 there were about 5,000 occupied housing units of which about 3,050 were occupied rental units. In 2015 there were about 4,500 occupied housing units, of which 2,880 were occupied rental units.

Other areas to note that have experienced increases in the percentage of rental units are the inner-ring suburbs that border Detroit. For example, Redford experienced an 87 percent increase in occupied rental units between 2010 and 2015, Eastpointe experienced a 61 percent increase, Ferndale experienced a 46 percent increase, Warren and Hazel Park each experienced a 26 percent increases.


There were 42 municipalities that experienced a decrease in the percentage of rental units occupied between 2010 and 2015 in the region. Similar to the municipalities with among the highest percentage of occupied rental unit increases, those with the decreases also had smaller populations and housing stocks. For example, the city of Huntington Woods in Oakland County experienced a 35 percent decrease in the occupied rental units. However, in 2015 there were about 2,500 total occupied housing units, 77 of which were occupied rental units.


While we do know that the total number of rental units has increased over the years as a reflection of the economy and the housing crisis, this post also brings to light how a community’s overall housing stock must also be considered.

Percentage of Rentals on the Rise in Southeastern Michigan

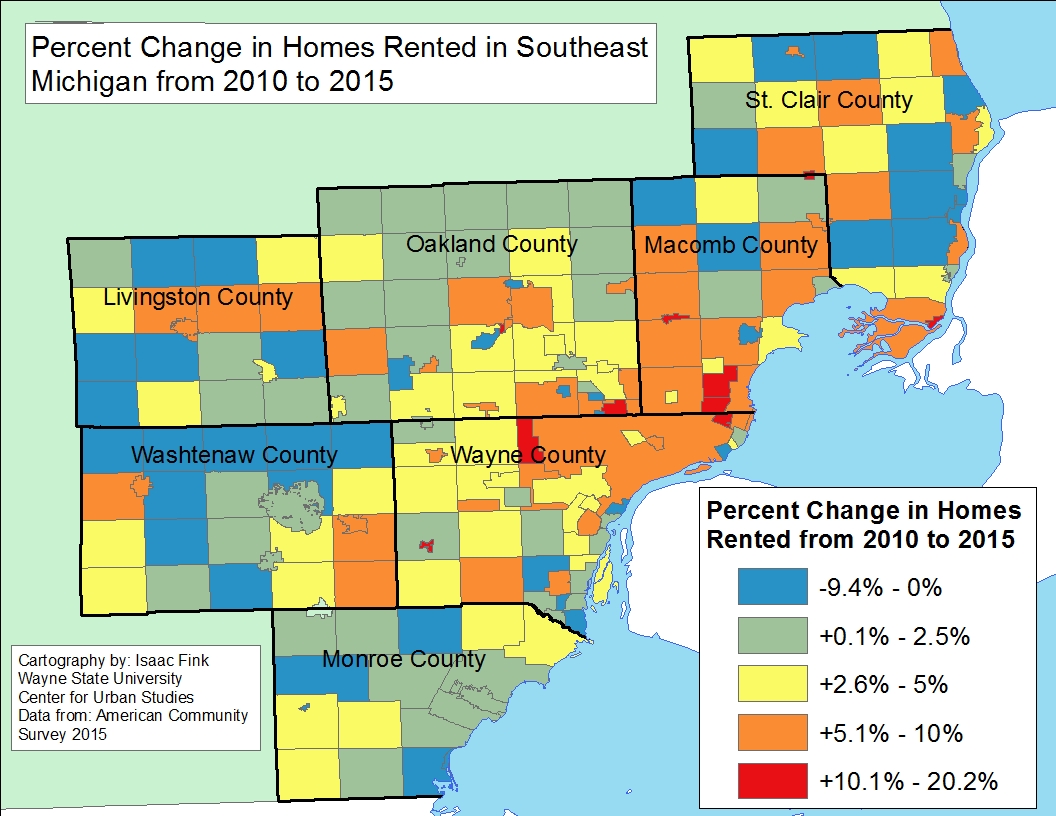
Between 2010 and 2015, 72 percent of the communities in Southeastern Michigan experienced an increase in the percentage of homes that served as rentals, meaning majority of the communities experienced a decrease in residents serving as homeowners. Of those communities, there were 11 communities in Southeastern Michigan that experienced rental rate increases above 10 percent between 2010 and 2015. The city with the largest increase was Milan, located in Monroe County, at 20.2 percent. According to data from the U.S. Census Bureau, in 2010 23.1 percent of the homes in Milan served as rentals and by 2015 that increased to 43.3 percent.

At the county level, Wayne County experienced the largest increase in communities that saw rental rates increase. According to the data, 93 percent of the Wayne County communities experienced an increase in rentals between 2010 and 2015. Of those Wayne County communities, Belleville experienced the highest increase at 15.1 percent. In 2010, 27.4 percent of the homes in Belleville were rentals and by 2015 that increased to 42.4 percent.

Overall, the areas of Southeastern Michigan that experienced the greatest increase in the percentage of homes serving as rentals between 2010 and 2015 were Detroit, and its inner-ring neighbors, along with the western side of Macomb County. Of the inner-ring suburbs, Harper Woods experienced the highest percentage increase in homes being rented at 13.2 percent. In 2010, 24.7 percent of the homes were rentals and by 2015 that increased to 37.9. Just below Harper Woods was the city of Ferndale, another inner-ring suburb, with an increase of 12.8 percent. In 2010, 27.5 percent of the homes in Ferndale were being rented and by 2015 that increased to 40.3 percent. Eastpointe, Utica and Roseville, all Macomb County cities, two of which neighbor Detroit, came in just below Ferndale with rental rate increases at 12.2, 11.6 and 11.3, respectively. Of these three communities, Utica, which is in the northwestern part of Macomb County, had the highest percentage of rentals in both 2010 and 2015. In 2010, 35 percent of the homes in Utica were rentals and by 2015 that increased to 46.7 percent.

Of all the communities in Southeastern Michigan, Detroit ranked 60th when examining how rental rates increased between 2010 and 2015. In 2010 the percentage of homes being rented was 45.5 and in 2015 that increased to 50.6. Within the City’s limits there were six Census Tracts that experienced rental rate increases between 25 to 52 percent. A pocket of the city’s northwest side, near Palmer Park and Rosedale Park, appears to be experiencing rental rate increases up to 25 percent. There is also a pocket on the city’s west side that is experiencing a decrease in rentals. In Southwest Detroit there are seven Census Tracts that each have experienced a decline in the percentage of rental homes by up to 22 percent; there is a similar pocket with nine Census Tracts just west of Highland Park.


As our previous posts show our region has experienced hundreds of thousands of home foreclosures from 2010 through 2014 as part of the Great Recession. In all probability most of those homeowners have become renters, assuming they have not left the region. This explains much of the shift to rental ownership, though some could come from the construction of new rental properties or the demolition of homeowner properties. The foreclosures and decline in home ownership represent a massive loss in wealth for homeowners and a massive increase in revenue for rental owners.

Wayne County has Highest Medicaid Births in Southeastern Michigan

The political battle over the Affordable Care Act continues to swing back and forth in Washington, but it’s consequences will be felt directly in Southeastern Michigan. Data on Medicaid payments for prenatal care and births in Southeastern Michigan make clear that the ACA, in particular the Medicaid expansion, led to an increase in federal support for prenatal care and births in our region, particularly in two counties.

Births paid for by Medicaid grew between 2010 and 2015 in Monroe and Wayne counties. In 2010, 45 percent of the births in Monroe County were paid for by Medicaid and in Wayne County that number was 46 percent. By 2015 that number increased to 49 percent in Monroe County and 56 percent in Wayne County. In that time frame Monroe County also had the largest decrease and increase. In 2013 50 percent of the births in Monroe County were paid for by Medicaid and in 2014 that number dropped to 32 percent, before increasing back to 49 percent in 2015.

According to the Michigan Department of Health and Human Services, a Medicaid patient about $8,000 is allocated to each woman to cover prenatal, birth and postpartum care.

Slide4

In 2015, according to data from the Michigan Department of Health and Human Services, Wayne County had the highest percent of births paid for by Medicaid than any of the other counties in Southeastern Michigan. Of the births in Wayne County in 2015, 56 percent of them were paid for by Medicaid; this was equivalent to 13,145 births. As a comparison, across the entire state of Michigan 43.5 percent of births were paid for by Medicaid. Regionally, Livingston County had the lowest percentage of births paid for by Medicaid at 17 percent, that was equivalent to 317 births.

Slide6