Michigan’s charter schools concentrated in Detroit

Michigan’s charter school system is widely becoming known as a for-profit business venture as well as another option for students to receive high quality education. With over 30 charter school authorizers and management companies throughout the state of Michigan, there is no question that the choice to send students to charter schools is there. However, there are questions over whether or not the academic foundations students need to in order to become successful are also there.

This is a two part post, and this week we will lay the foundation on charter schools in Southeastern Michigan, by showing where they were located in the 2013-14 academic year and detailing where and why others closed. Next week we will look further into the overall academic progress of some of Michigan’s charter school authorizers.

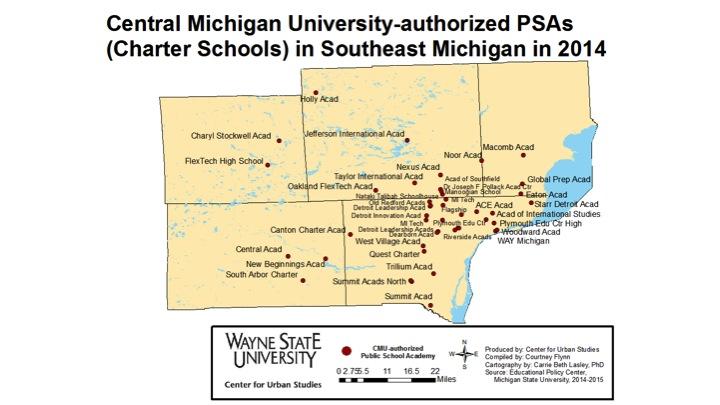
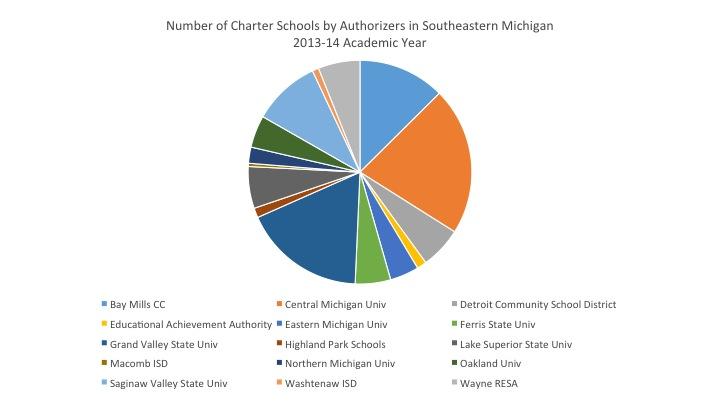
Of the 298 charter schools in Michigan during the 2013-14 academic school year. In total, there were 223 charter schools in the region during the 2013-14 school year. Of all the charters in the state, 31.5 percent (94 schools) were located in the city of Detroit, according to information from the State of Michigan and the Michigan Association of Public School Academies. Within Detroit itself, the majority of these schools were authorized by Grand Valley State University. Throughout the state of Michigan, the most common charter school authorizers are universities; regionally Central Michigan University operates the largest number of charter schools. As the oldest charter school authorizer in the state, CMU oversaw 46 charter schools in 2013-14, according to Michigan’s Charter School Authorizer Report from November 2014. Grand Valley State University had the second highest number at 38.

It wasn’t until 2012, the year following the state’s decision to remove the cap on the number of charter schools a university could authorize was removed, when several local school districts, intermediate school districts and community colleges also opened charter schools, according to Michigan’s Charter School Authorizer Report.

The for-profit and non-profit organizations that operate charter schools are known as Education Management Organizations (EMOs). Although exact information on the number of charter school management companies for the 2013-14 school year wasn’t available, we do know that there were more than 35 during the 2011-12 academic year, according to a 2013 report (link) by the National Education Policy Center at the University of Colorado. In this report, it states that Michigan had 33 for-profit EMOs operating charter schools, which operated 79 percent of Michigan’s charter schools. Non-profit organizations can also manage schools, as can the authorizers themselves. In July of 2014, former Michigan State Superintendent Mike Flanagan took a stance against charter school authorizers, stating he would exercise his authority to suspend them if they did not live up to the mission originally intended for charter schools, which is “to provide high quality education options and cultivate better outcomes, especially for low income children.”

Flanagan’s statement against charter school authorizers was prompted by the 2014 Detroit Free Press series that took a look at the state’s charter school authorizers, management companies and the way in which both utilize public tax dollars and educate children. The series showed that charter schools lack accountability, despite their use of public funds. This series was published following the 2012-13 academic year, and this post reflects on data from the 2013-14 academic year. However, the Free Press series was used for background purpose.

Below is a breakdown of the number of charter school authorizers in the region for the 2013-14.
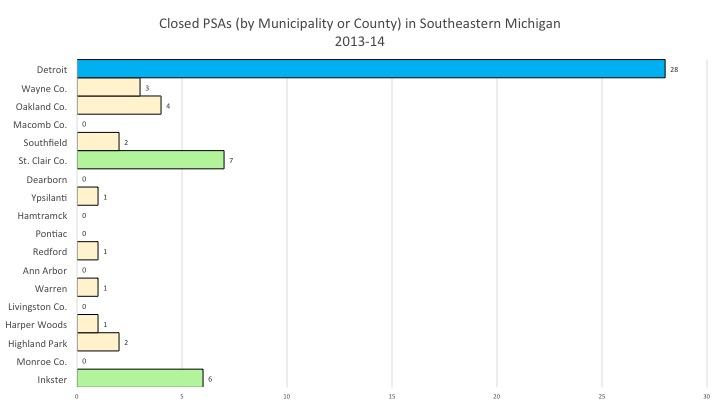
As noted, in Southeastern Michigan, the city of Detroit had the highest concentration of charter schools, with 94 (31.5%) operating in the city during the 2013-14 academic year. That year, 24 charter schools closed in Detroit, the highest number for any municipality in the state. Overall, 24.4 percent of all closed charter schools in the state of Michigan were located in the Detroit. Regionally, 42 percent of all charter schools in the state were located in Southeastern Michigan during the 2013-14 academic year, while 57.1 percent of the closed charter schools were from the region.
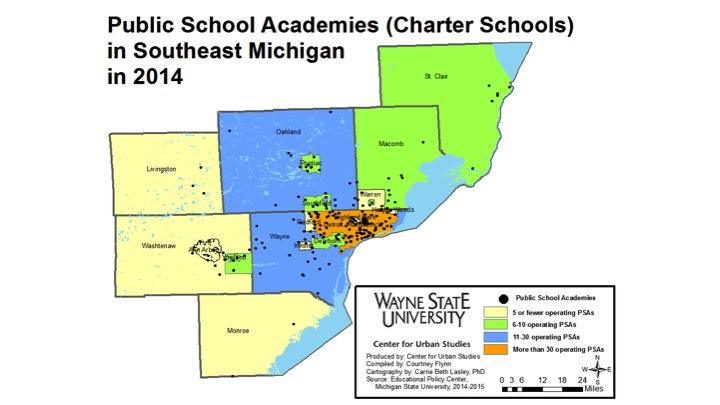
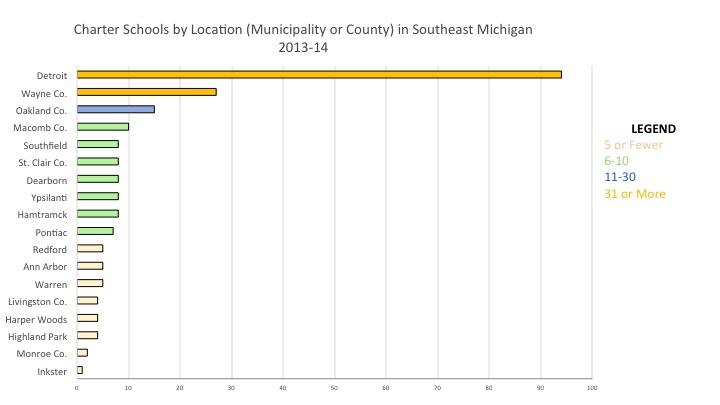
Southeastern Michigan Charter Schools by location

Just as the city of Detroit had the highest concentration of charter schools during the 2013-14 school year, it also had the highest number of closed charter schools at 28. Of the closed charter schools, Central Michigan University was the largest authorizer with 13 of its charter schools being shuttered in Southeastern Michigan for the 2013-14 school year. When looking at authorizers for just the city of Detroit though, Wayne RESA had the largest number of closed charters at 8. The reasons charter schools close ranges from lack of financial stability and enrollment to poor academics. For example, following the 2013-14 school year the closure of the Catherine Ferguson Academy, authorized by Wayne RESA, made headlines (add MI Public Radio link) because the academy, as the city’s dedicated high school to pregnant teens and moms, was closing because of lack of enrollment and funding. When examining a document produced by the state of Michigan listing all closed charters in the state, other reasons for charter schools closing include: poor academics, reorganization, lack of governance, leadership viability, the contract not being renewed, or the authority of an authorizer being revoked.

Despite charter schools closing for a variety of reasons, the 2014 Detroit Free Press report on charter schools shows that many authorizers leave poor performing schools open for a number of years. The focus of the DFP’s particular report was on schools authorized by Central Michigan University, and it highlighted how during a spot check of seven different charter schools during the 2012-13 academic year five were reauthorized despite a history of poor academic progress.
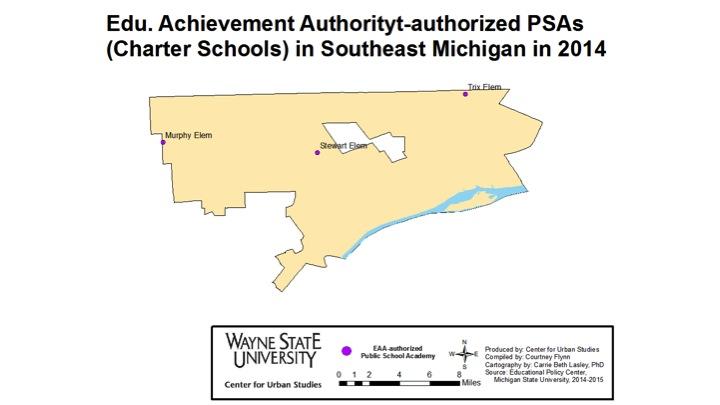
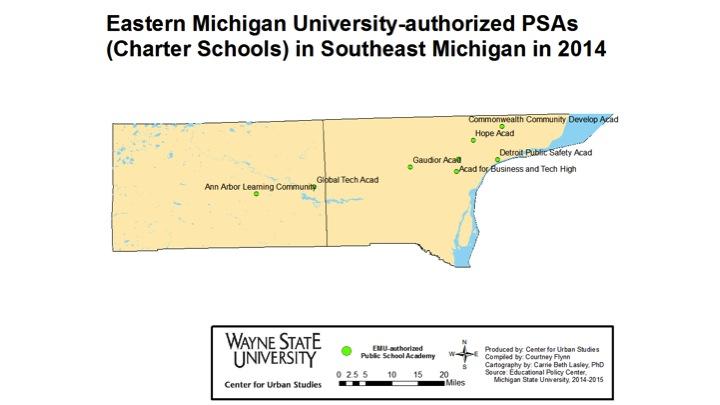
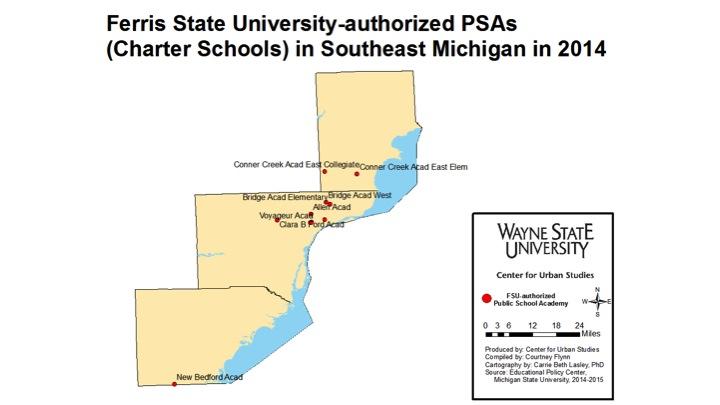
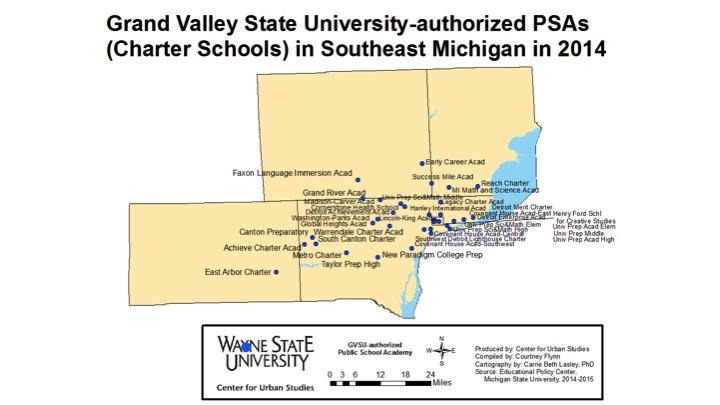
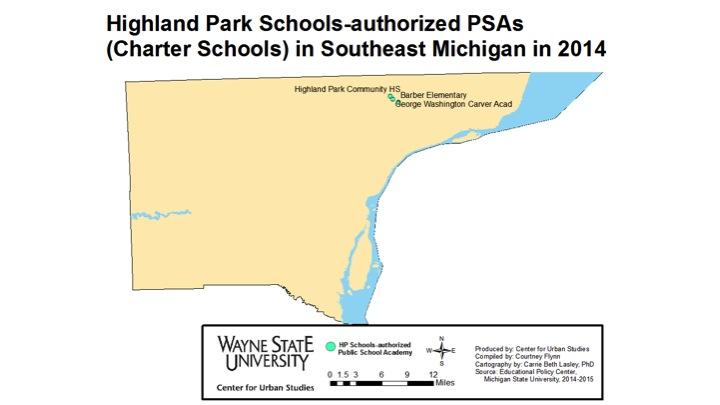
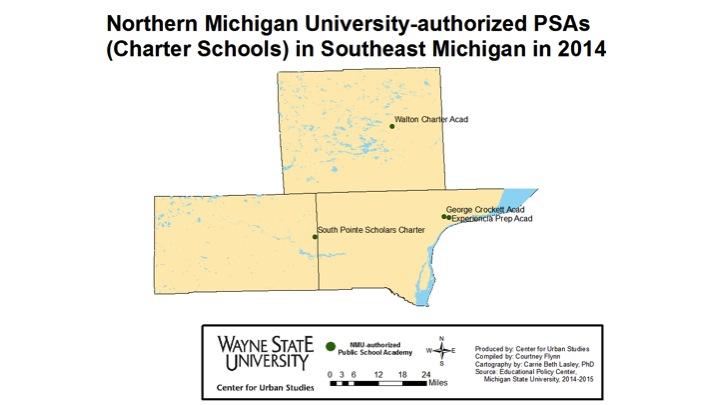
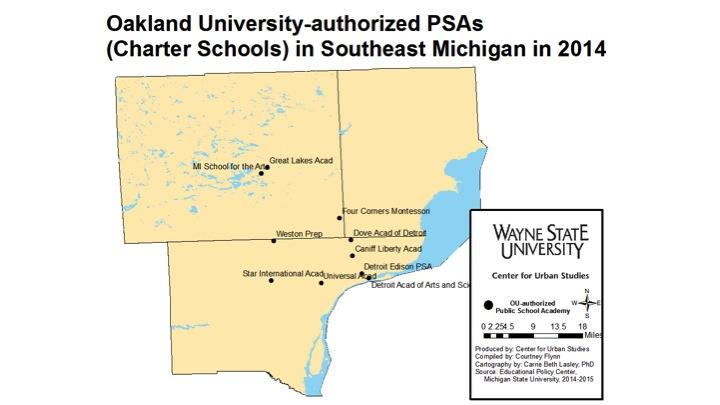
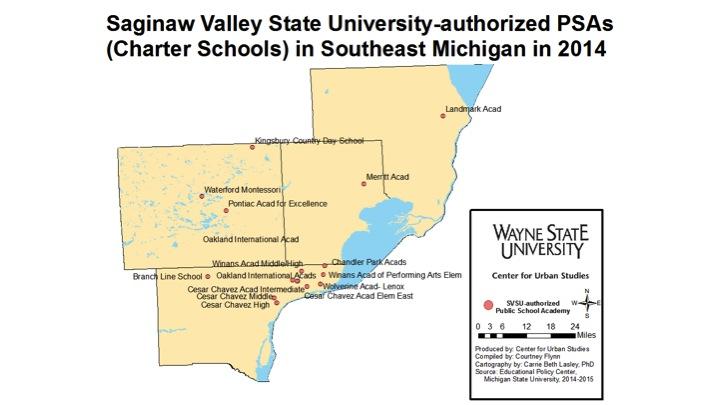
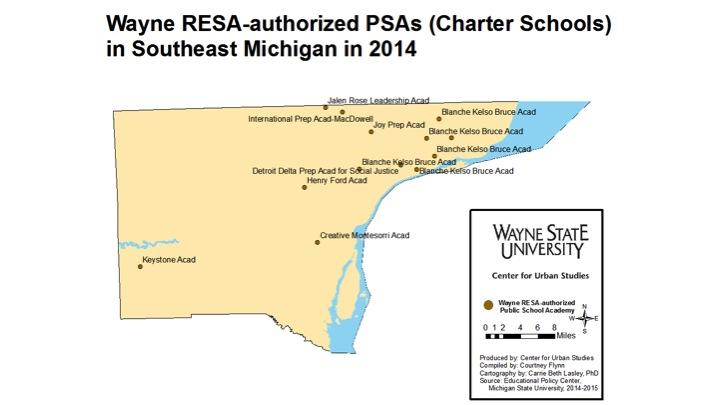
Below are individual maps for each charter school authorizer in the state that had schools operating during the 2013-14 academic year in Southeastern Michigan. As noted early on in this post, majority of the charter schools in the region were concentrated in Detroit, with Grand Valley State University being the largest authorizer in the Detroit.

Central Michigan University was the largest authorizer regionally, and throughout the state. Charter schools authorized by regional education services authorities (Wayne County) , an intermediate school district (Macomb and Washtenaw counties) or a city based educational authority (Highland Park, Detroit) remain only in that particular county/municipality. The charter schools authorized by public universities and community colleges, however, can stretch across counties.
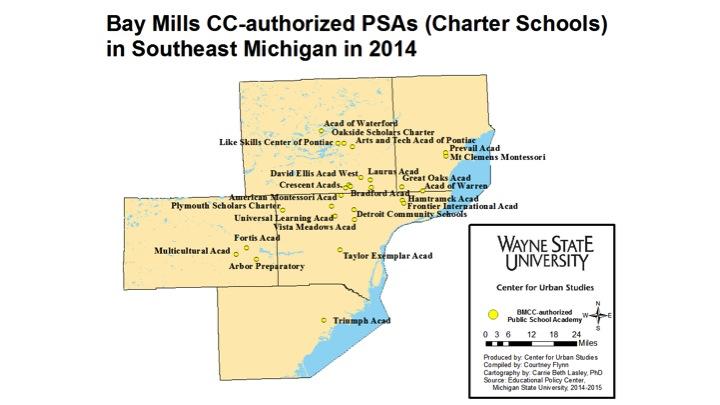
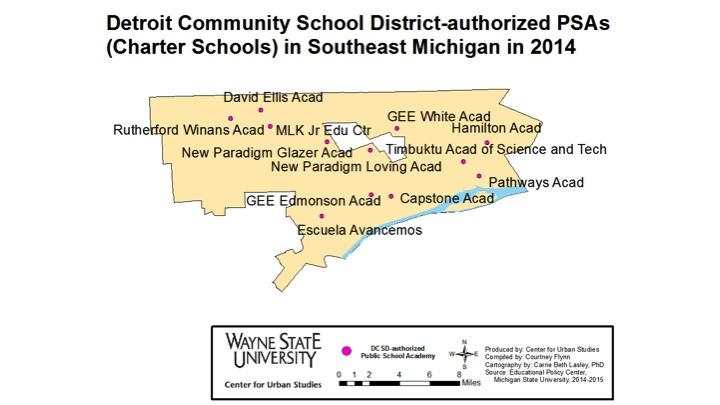
Bay Mills CC Charter Schools in Southeastern Michigan Northern Michigan University Charter Schools in Southeastern Michigan Oakland University Charter Schools in Southeastern Michigan Saginaw Valley State University Charter Schools in Southeastern Michigan Wayne RESA Charter Schools in Southeastern Michigan

Charter schools were created as a means to provide additional educational choices to students. While the number of charter schools has increasingly grown throughout the state of Michigan and regionally (particularly after the cap for the number of charter schools a university can authorize was removed in 2011) the question on what type of choice these charter schools bring remains. Throughout this post we already saw schools are both shut down and kept open, despite poor academic performances. The Detroit Free Press series referenced in this post discusses charter schools’ lack of accountability, despite the fact they use public dollars to operate. Next week, we will look into the academic performances of Southeastern Michigan’s charter school authorizers and how these performances are associated with certain socioeconomic backgrounds.
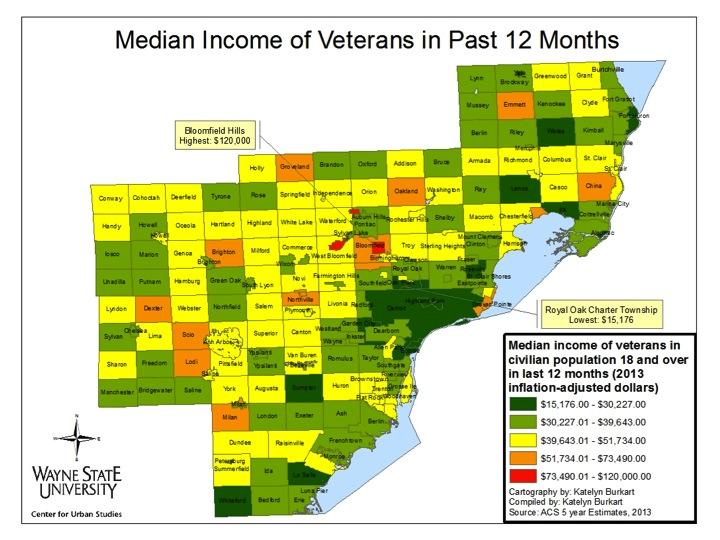
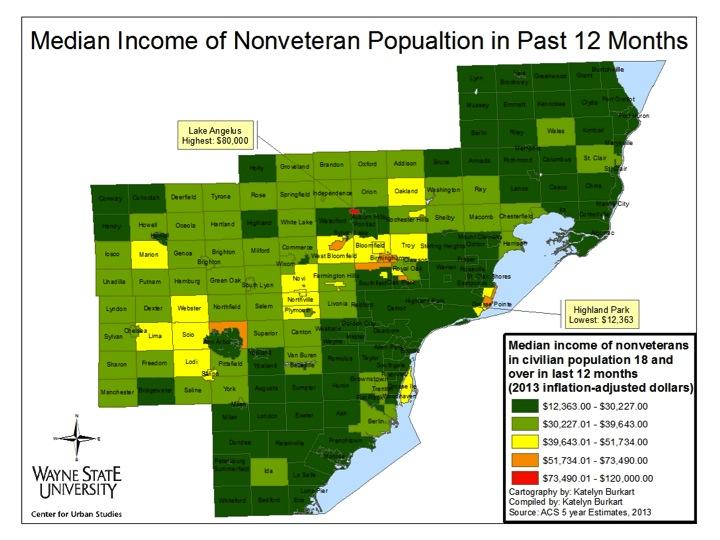
Veterans in SE Michigan tend to fare better with income and employment

Last week we examined where veterans live throughout the seven-county region of Southeastern Michigan and this week we take a deeper look into the socioeconomic picture for the region’s veterans. Overall, we see that veterans in the region in 2013 tended to have a higher median income level than non-veterans. Also we see that a lower percentage of veterans in the area fell under the poverty line in 2013 than non-veterans. Unemployment status for veterans throughout the region, however, varied.

This data presented in the maps below is from the 2013 American Community Survey.

When looking at median income in Southeastern Michigan at the municipal level, we see that it tended to be higher for veterans than it was for non-veterans. Municipalities such as Bloomfield Hills, Orchard Lake, and Lake Angelus – all of which have higher median income levels than the region as a whole (link to post) – also had higher veteran median income levels than a city such as Highland Park, for example, which has low median income levels.

It should be noted, however, that veterans make up a smaller portion of the population than non-veterans, and as a result, sample size may have had an influence on these numbers.

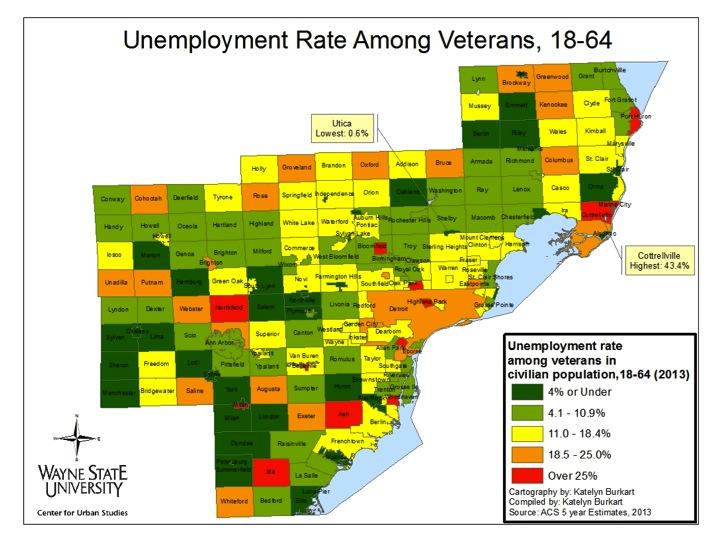
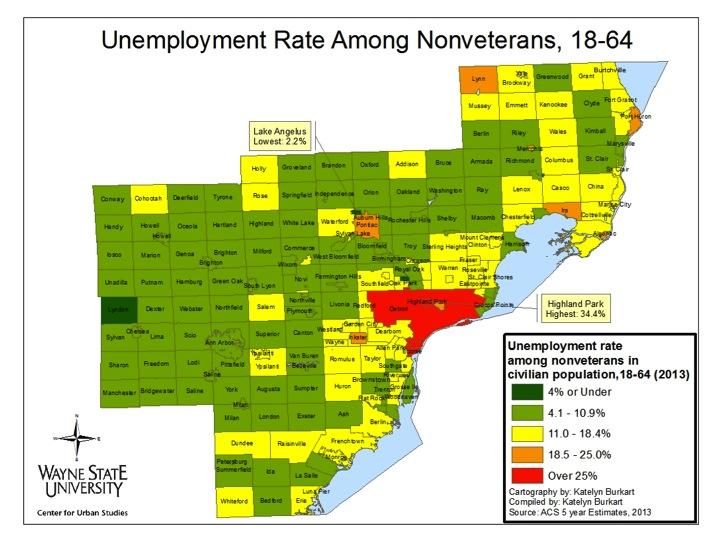
The unemployment rate among veterans varied much more than it does among non-veterans. The rate among veterans varied from 0.6 percent to 43.4 percent For non-veterans, it ranges from 2.2 percent to in 34.4 percent The locations with high unemployment also varied significantly between veterans and non-veterans, with 12 locations across five counties having over 25 percent unemployment among veterans – rates that were only seen in Detroit and Highland Park among non-veterans.

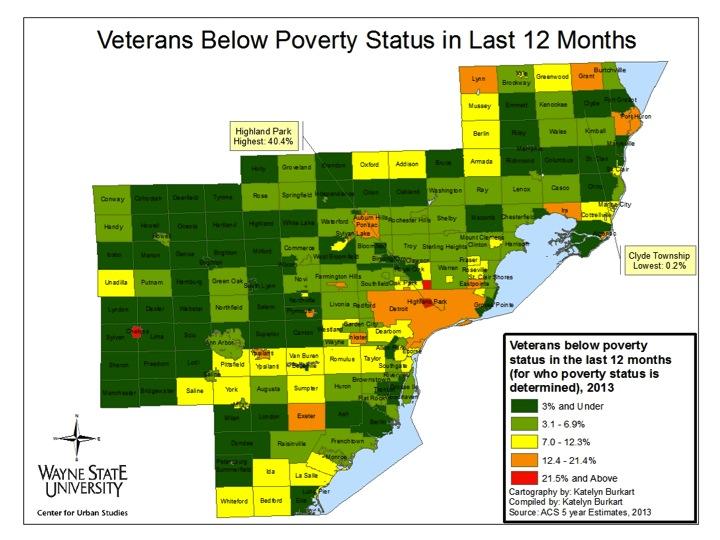
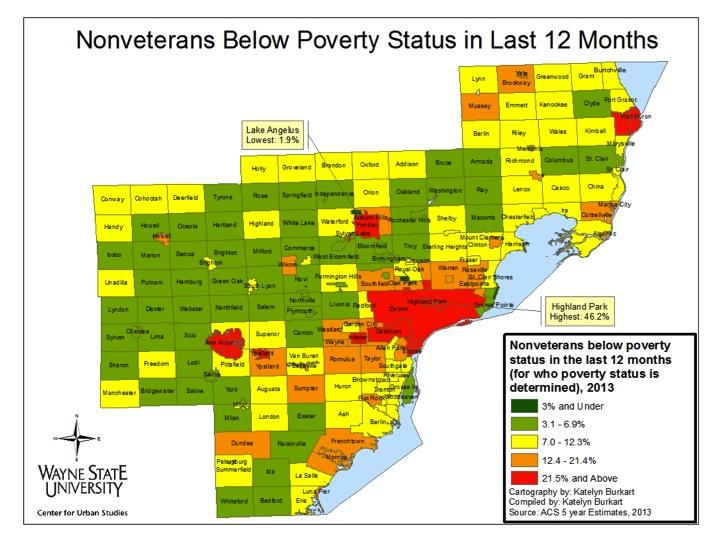
A lower percentage of veterans were below poverty status, compared to non-veterans throughout Southeastern Michigan. For both veterans and non-veterans, Highland Park had the highest percentage of residents below the poverty line: 46.2 percent of non-veterans and 25.2 percent of veterans. Only two other municipalities had more than 21.5 percent of veterans living below the poverty line: Chelsea (37.9%) and Hazel Park (27.7%). Clyde Township (0.2%) had the lowest percentage of veterans living below the poverty line.

While there were only three municipalities with 21.5 percent or more of veterans living below the poverty line, there were nine municipalities throughout the region where 21.5 percent or more of the non-veteran population was living below the poverty line. Such municipalities included Ecorse, Detroit, Pontiac, Ypsilanti and Port Huron.

Overall we see that while veterans appeared to fare better than non-veterans in terms of income and poverty status, and in some cases employment.

St. Clair County home to largest percentage of veterans in SE Michigan

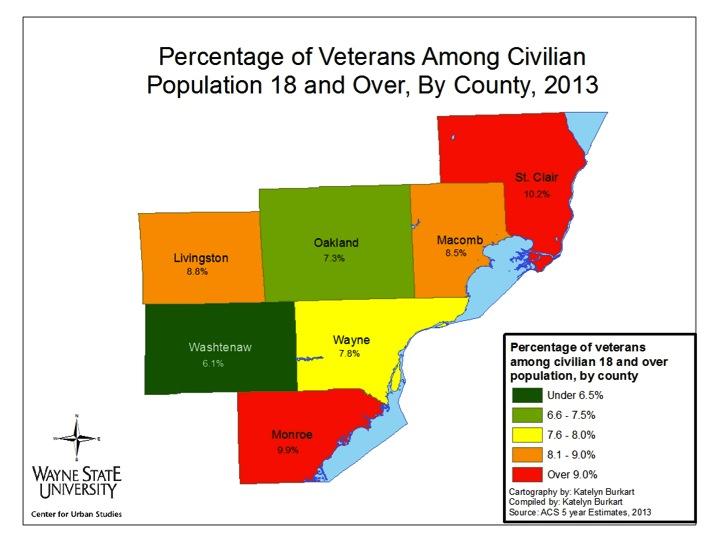
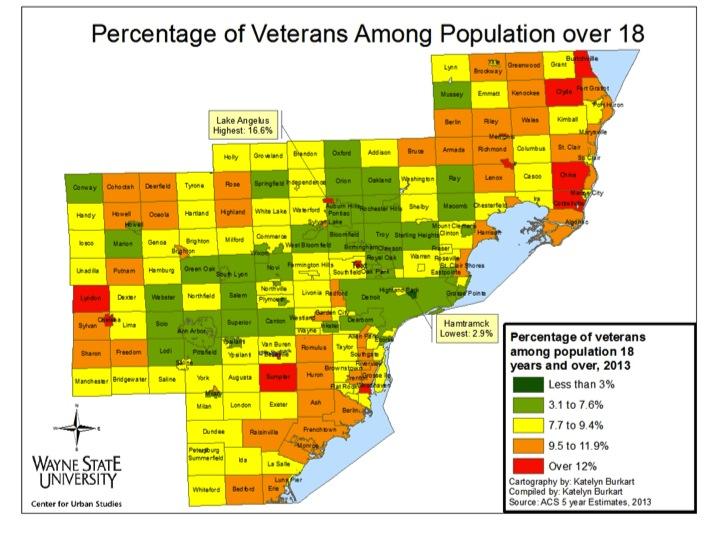
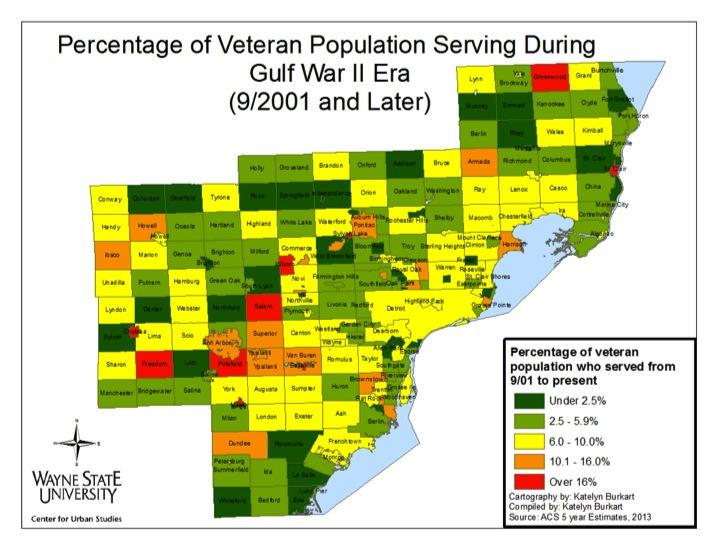
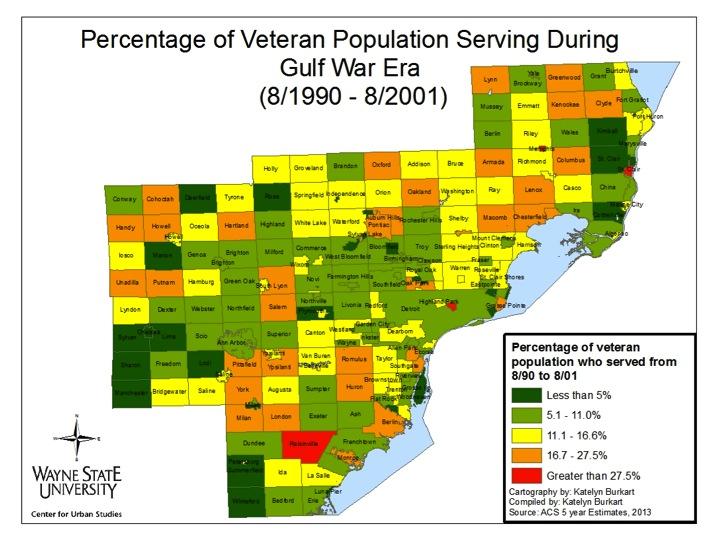
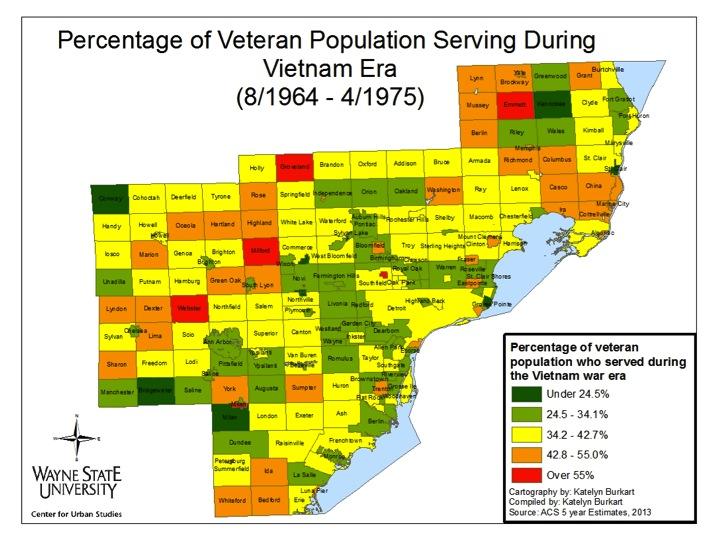
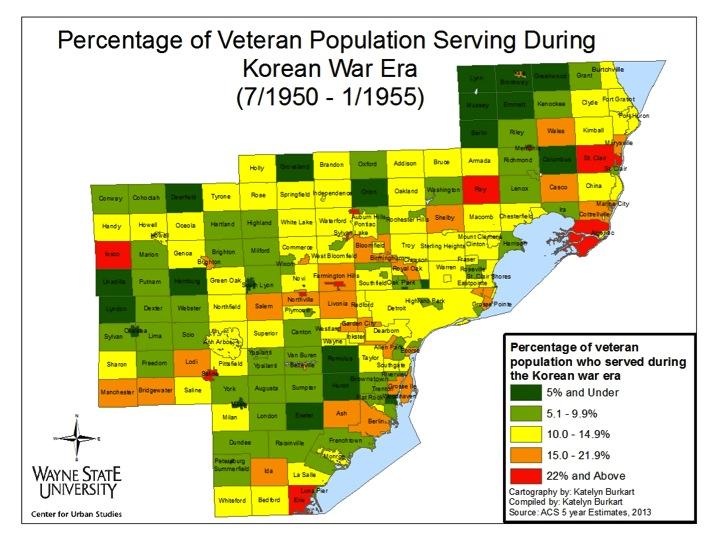
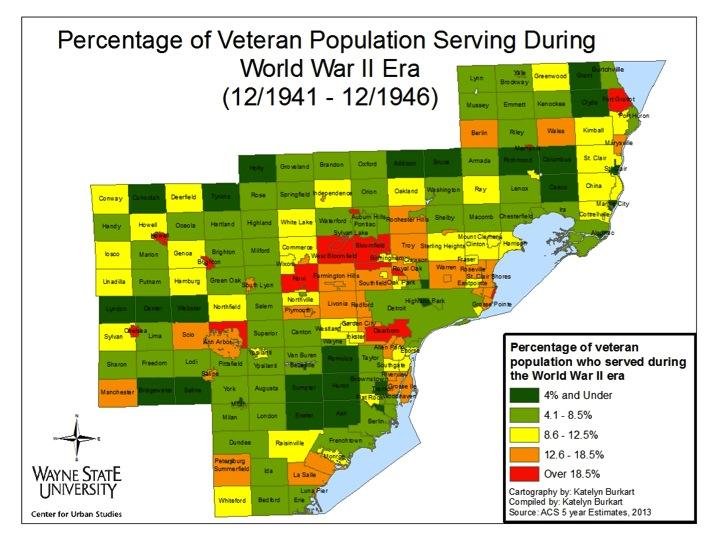
Next weekend is the Fourth of July, so it’s a good to seek understanding of the veterans in Southeastern Michigan. The map below shows veterans as a percentage of the civilian population in the seven-county region in 2013. According to American Community Survey (ACS) five-year estimates, at the county level, St. Clair County had the highest percentage of veterans in 2013 (10.2%) while Washtenaw County had the lowest (6.1%). Broken down by municipality, the highest percentage of veterans were found in Lake Angelus in Oakland County (16.6%) and the lowest in Hamtramck in Wayne County (2.9%).

Nationally, veterans make up about 9.0 percent of the civilian population over 18. Michigan is average in this regard – veterans make up about 8.9 percent of the civilian population over 18 in the state.

In addition to recording whether or not a respondent served in the armed forces, the ACS further notes what era they served, with data available for five specific time periods: Gulf War II (defined as September 2001 and later), Gulf War I (August 1990 to August 2001), Vietnam War (August 1964 through April 1975), Korean War (September 1950 through January 1955), and World War II (December 1941 to December 1946).

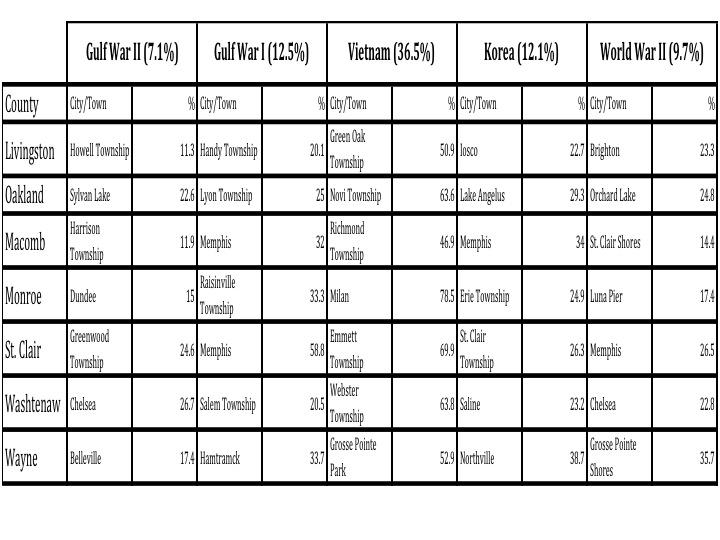
For the state of Michigan as a whole, those who served during Gulf War II make up 7.1 percent of the total veteran population, those who served during Gulf War I make up 12.5 percent, Vietnam veterans make up 36.5 percent, Korean War veterans make up 12.1 percent, and those who served during WWII comprise 9.7 percent of veterans. (This does not add up to 100%, since there are many others who served outside of these specific time periods.) The maps below show the percentage of the veteran population by municipality who served in these various conflicts.

FOOTNOTES

According to National ACS 5-year estimates (2013), there was an adult civilian population of 236.5 million (adult meaning 18 years and over, civilian excluding active-duty service members et al.), and of that, 21.2 million were veterans = ~8.96%.

According to ACS 5-year estimates for the state of Michigan (2013), there was an adult civilian population of 7,577,743, of which 672,213 were veterans = ~8.87%.

Below is a chart listing the municipality in each county from which the highest percentage of the veterans served during each conflict. The percentages are of the total veteran population in that municipality for the period of conflict it is listed in.

One item of note is that although Hamtramck had the lowest percentage of veterans in their population, it had the highest percentage of Gulf War I veterans in Wayne County. This may be a product of refugees from Gulf countries that participated in that war. Similarly, although Washtenaw County as a whole has a low percentage of vets, Chelsea has a high percentage – with nearly half of all Chelsea veterans serving during either World War II or the most recent conflicts in the Middle East. Other clusters with a high percentage of vets across all eras include Memphis (St. Clair/Macomb counties) and the Orchard Lake/Sylvan Lake/Lake Angelus area of Oakland County.

The data presented in this post can be useful when planning specific outreach programs for veterans based on age or time period of service.

WSJ: 28 percent of Wayne County homes are worth less than their mortgage balance

The Wall Street Journal recently posted an interactive map that shows the percentage of homes in counties across the nation that were worth less than what was owed on them during the first quarter of 2015. Here, we see that in Wayne County 28 percent of homes were worth less than the mortgage balance on them. In Oakland County that number was 13 percent and in Macomb County 17 percent of homes were worth less than what is owed on them.

Michigan ranked 31 nationwide for amount of taxes per capita

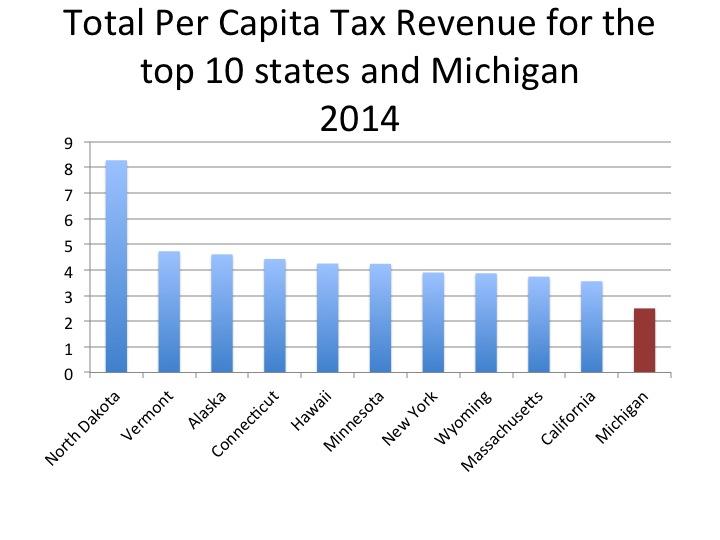
The chart above compares the taxes per capita in Michigan, which is $2.50, to the 10 states with the highest taxes per capita. Michigan ranked 31 out of 50 and North Dakota came in at number 1 with its taxes per capita at $8.28.

Other states in the Great Lakes region with higher taxes per capita than Michigan were: Minnesota ($4.24), New York ($3.90), Illinois ($3.04), Wisconsin ($2.85) and Indiana ($2.55).

Nationwide, New Hampshire had the lowest taxes per capita in 2014 at $1.72.

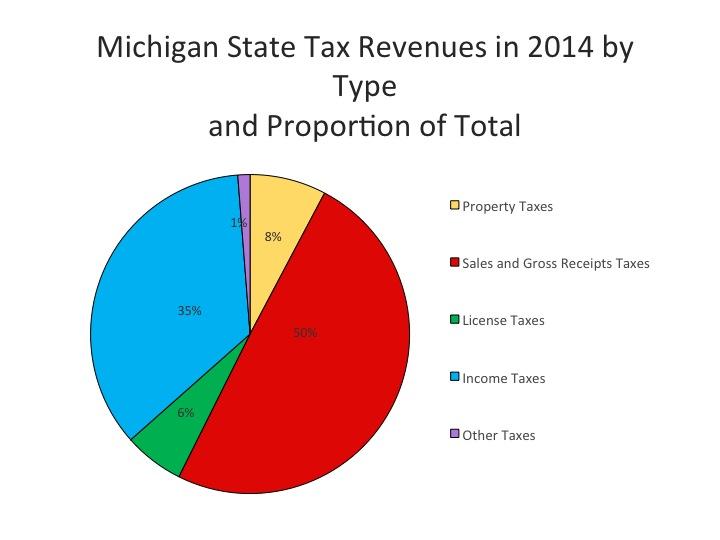
As seen in the graph below, the State of Michigan’s tax revenues come from four primary categories: Sales and Gross Receipt Taxes, Income Taxes, Property Taxes, and License Taxes. All other taxes, which include death and Gift Taxes, Documentary and Stock Transfer Taxes, and Severance Taxes, fall into the “Other” category. This category accounted for only 1 percent of the state’s tax revenue in 2014 while sales and gross receipt taxes accounted for 50 percent, or about $12 billion, of the state’s tax revenue.

The information for this post was taken from the 2014 Annual Survey of State Government Tax Collections.

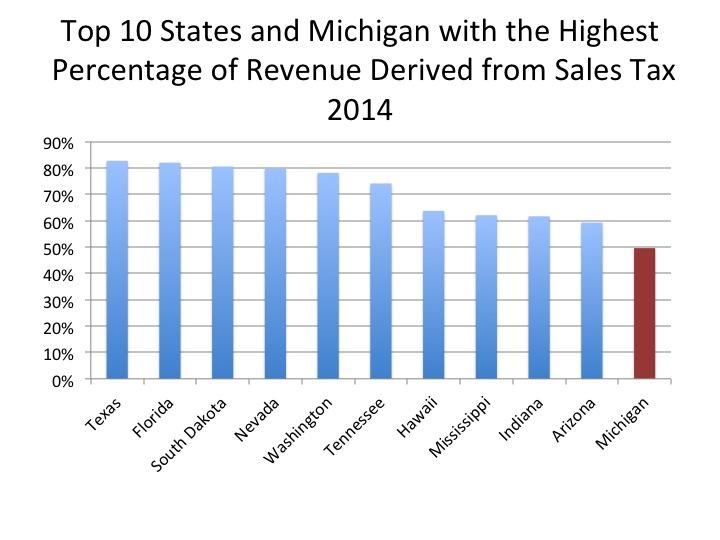
As noted, half of Michigan’s tax revenue generated in 2014 was from sales and gross receipt taxes, a category that is made up of more than just general sales and gross receipt taxes. General sales and gross receipt taxes accounted for 68 percent of the overall sales and gross receipts of $12 billion brought in 2014 while about 8 percent of those monies were earned through the motor fuel tax.

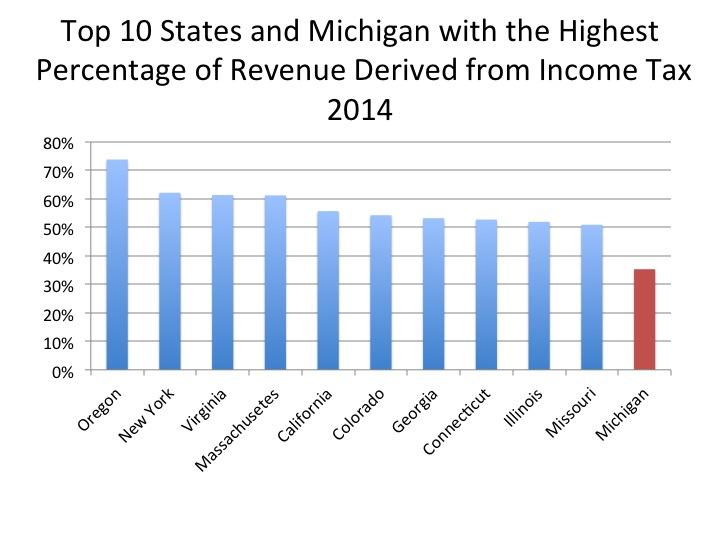
Michigan also relies on income tax monies to fund state operations; 35 percent of Michigan’s tax revenue generated in 2014 (about $8.7 billion) came from income taxes. Of that, 89 percent came from personal income taxes and the remainder was generated from corporation net income taxes.

Overall, according to the National Conference of State Legislatures, states earn about a third of their tax base through income taxes. Though this varies substantially as discussed below.

The majority of Oregon’s tax base (74%) was earned through its income tax in 2014, while Michigan only derived 35 percent of its tax base from income tax. Oregon’s income tax is divided into four brackets depending on a person/family’s earning. In addition, Oregonians are able to subtract what they pay in federal taxes from their state taxable income results, according to an article from The Oregonian.

Michigan has a flat income tax. In Michigan the income tax rate is 4.25 percent, however Republicans in the State Legislature have been working to reduce it to 3.9 percent, according to the Michigan League for Public Policy (MLPP). Such action, according to the MLPP, would reduce revenue flow to areas such as education and infrastructure. Michigan also has an Earned Income Tax Credit that allows lower income workers to retain more of their income. The State Legislature intends to eliminate this credit and instead push those funds into Michigan’s roads.

In addition to the Earned Income Tax Credit that exists in Michigan, and 23 other states (including Oregon), there is also a federal one, according to the National Center for Children in Poverty.

The importance of income taxes has grown since reliance on property tax values has declined in recent years, according to the National Conference of State Legislatures.

With Michigan’s sales and gross receipt taxes making up 50 percent of the state’s tax generated revenue in 2014, it ranked 19th for percent of sales tax making up a state’s tax base. Texas ranked first with 83 percent of its tax base being made up of sales taxes. Texas is one of the 17 states in the U.S. that does not levy property taxes at the state level, though it does have property taxes at the municipal and county level. Other states that do not levy property taxes (at the state level) and are among the 10 states with the highest percentage of revenue derived from sales taxes include: Florida (2), South Dakota (3), Tennessee (6) and Hawaii (7). Indiana was the only Midwestern state of the 10 states with the largest portion of their tax base being made up of sales taxes. In 2014, 62 percent of Indiana’s tax revenue was earned through sales taxes.

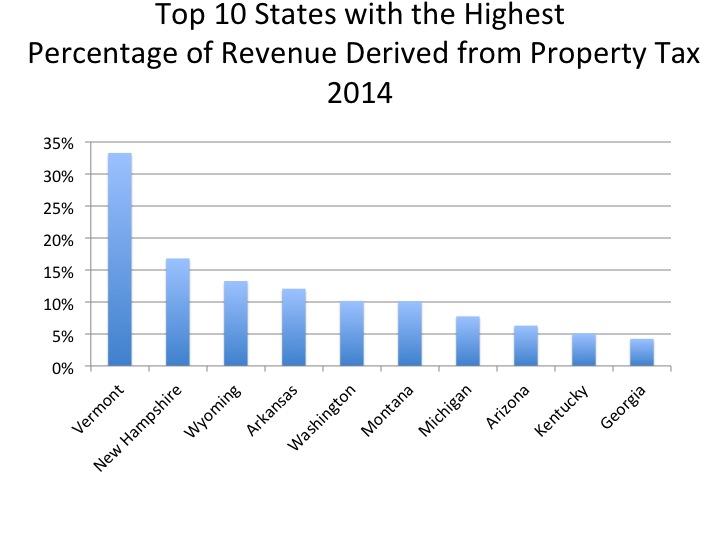
Out of the 33 states in the U.S. that levy property taxes, Michigan ranked seventh for the percent of tax revenues derived from property taxes. In total, about 8 percent of the state of Michigan’s tax revenues, or $1.8 billion, came from property taxes. Vermont ranked at the top, with 33 percent of its state tax revenues comprised of property taxes.

Ann Arbor’s renter occupancy rate is highest in the region

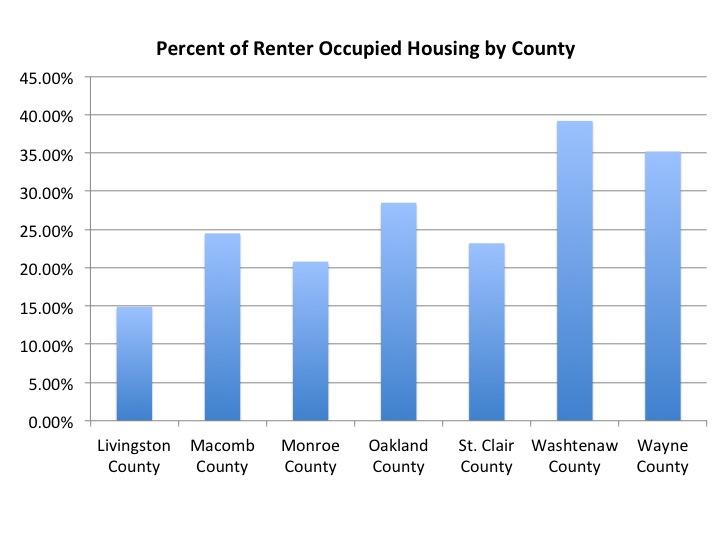
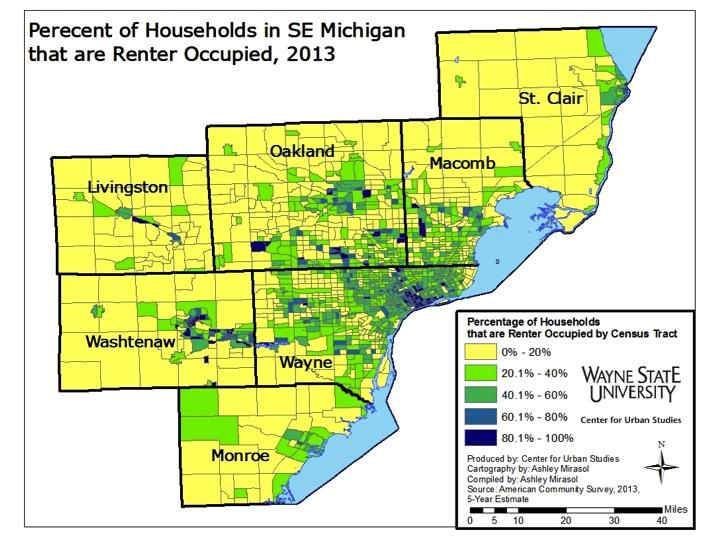
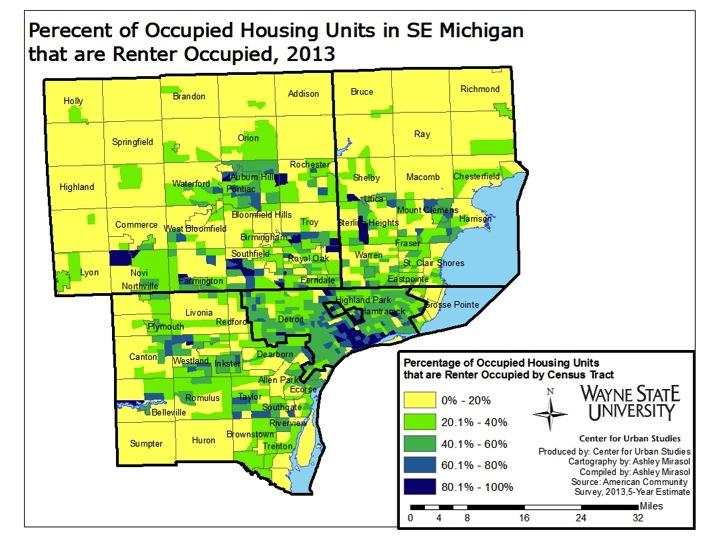
Renter-occupancy in the Southeast Michigan makes up only about a quarter of the region’s housing tenure rates, according to the 2013 American Survey. The majority of municipalities in the region had fewer than 20 percent of residents residing in a rental property. However, there were several cities near Detroit with renter occupancy rates above 35 percent. Washtenaw County had the highest overall renter occupancy rate at 39.2 percent probably because of the number of students attending universities there; Wayne County came in second to that at 35.2 percent.

As defined by the American Community Survey, residency is defined as where an individual was staying at the time of the survey, so long as they were, or intended to be there, for two months or longer.

According to the Joint Center for Housing Studies of Harvard University (JCHS) renting has been an increasing nationally. For example, in 2013 about 43 million households (or more than 35 percent of the all U.S. households) rented rather than owned a home. JCHS attributed the changing homeownership rates largely to the Great Recession. JCHS suggested that following 2008, homeownership was perceived as more risky as people witnessed the large wave of foreclosures that occurred, the drop in home values, and the costs of relocating in order to find better and more stable employment. The freedom renting provides, particularly for millennials, was noted as another reason why the rental market is growing. For these reasons, as well as the expected increase of immigrants coming to the U.S., over the next 10 years, JCHS predicted that the number of renter households will increase by up to 4.7 million by 2023.


Although renting is growing nationally, the JCHS states that rates are higher in central cities where land prices are high and r pool is made up of those whose incomes are below $30,000. In terms of age, the JCHS said low income housing is centralized. The Joint Center said more millennials tend to rent compared to older generations, such as the baby boomers.

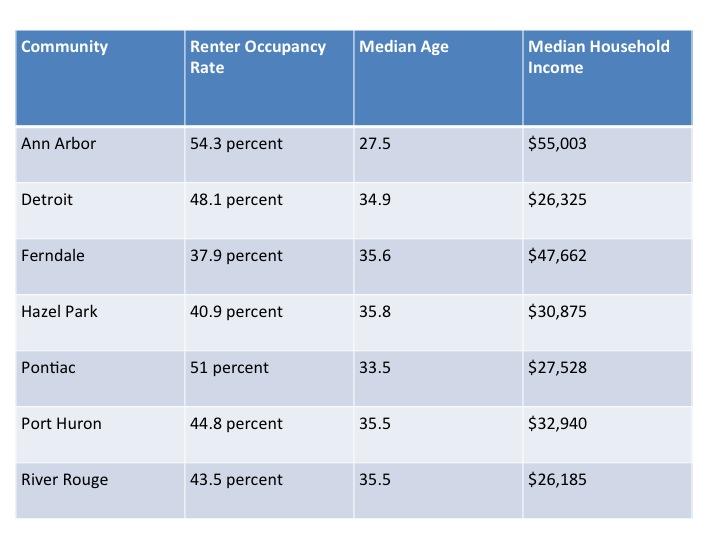
In the seven counties of Southeastern Michigan, 26.6 percent of households were renter occupied in 2013. Among municipalities, Detroit was a hub for rental occupancy in the region: 48.1% of households being renter occupied. There were also pockets of high rental residency outside the city. Many of those locations border the city of Detroit. For example, Ferndale had a renter occupancy rate of 37.9 percent, Hazel Park’s rate was 40.9 percent, and the city of River Rouge’s was 43.5 percent.

Pontiac, the county seat of Oakland County, had a renter occupancy rate of 51.0 percent, a rate higher than Detroit’s. As noted earlier, millennials and those with incomes below $30,000 a year are more likely to rent. The median age in Pontiac in 2013 was 33.5 years and the median household income was $27,528.

The city of Ann Arbor’s renter occupancy rate was 54.3 percent, also above Detroit’s rate. While Ann Arbor’s median income in 2013 was $55,003, it is home to the University of Michigan, which has a student population of about 43,000. A median age of 27.5 and the large student population better explains the high rental occupancy rate there.

Other pockets of high rental occupancy rates were along the I-275 corridor, near Port Huron in St. Clair County and along Lake Erie and the western border of Monroe County.

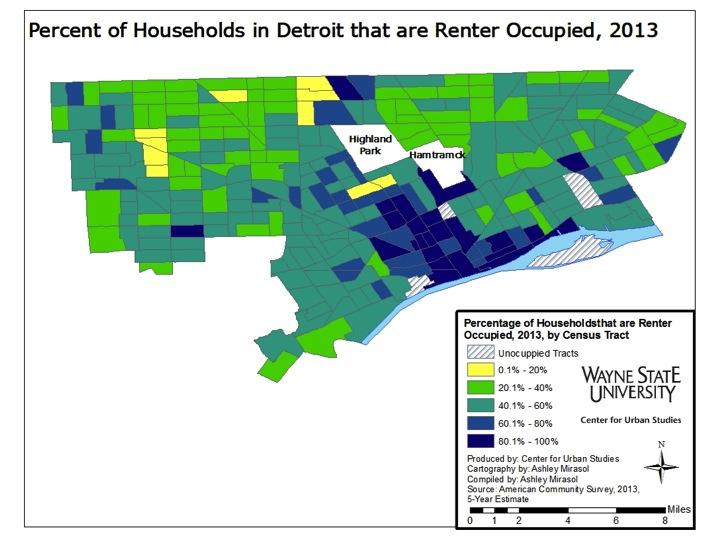
The city of Detroit had one of the highest rates of renter occupied households in the seven county region at 48.1 percent. There were only eight census tracts in the city where 20 percent or fewer of the homes were not renter occupied. The areas in the city with the highest renter occupied rate were the downtown area, Midtown (where Wayne State University is located), and the Jefferson East area. Additionally, the median income in Detroit was $26,325 in 2013 and the median age was 34.9.

As one of the many efforts to revitalize Detroit, companies and organizations such as Wayne State University, the Detroit Medical Center, Henry Ford Health Systems and Quicken Loans have offered employees monetary incentives to live in the city of Detroit. These incentives are offered through the Live Midtown and the Detroit Live Downtown programs and could also be seen as a reason why the rental rate is what it is in Detroit. In addition to city’s median income and age showing a link to the JCHS’ explanation for high rental rates, we also know that certain areas in Detroit (such as Midtown and Downtown) are becoming more attractive to people because of the night life, creative outlets, parks and proximity to sporting and entertainment events.

Detroit’s unemployment rate on the decline

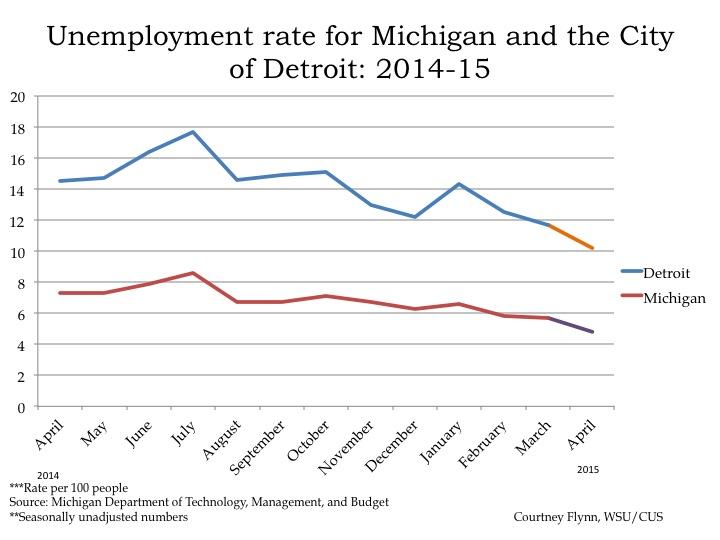
  • From March 2015 to April 2015, the unemployment rate across the state and in the City of Detroit’s decreased (monthly);
  • The Purchasing Manager’s Index for Southeast Michigan increased from April 2015 to May 2015 (monthly);
  • Commodity Price Index decreased from April 2015 to May 2015 for Southeast Michigan (monthly);
  • Standard and Poor’s Case-Shiller Home Price Index for the Detroit Metropolitan Statistical Area continue to increase.

According to the most recent data provided by the Michigan Department of Technology, Management, and Budget, the unemployment rate for the state of Michigan decreased from 5.7 percent in March to 4.8 percent in April. During this same period, unemployment in the city of Detroit also decreased from 11.7 percent in March to 10.2 percent in April.

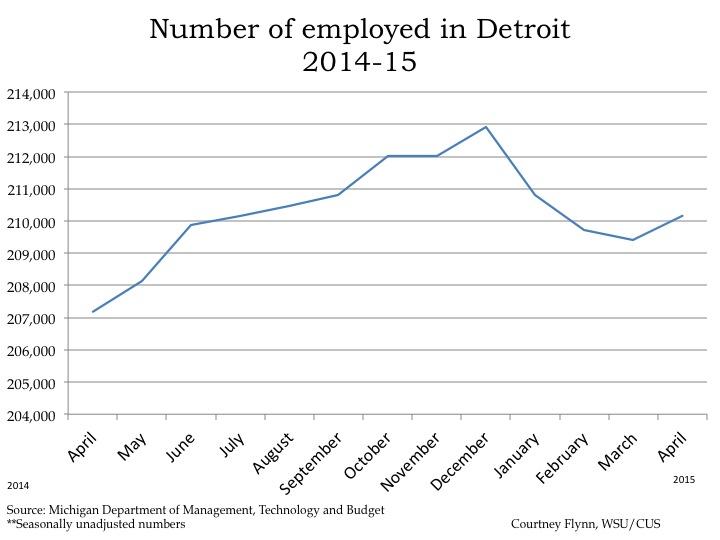
From March to April, the number of people employed in the city of Detroit increased by 744, leading to a total of 210,161 people employed in April.

The above chart shows the number of people employed in the auto manufacturing industry in the Detroit Metropolitan Statistical Area (MSA) (Detroit-Warren-Livonia) from April 2014 to April 2015. From March to April the number of people employed in this industry declined by 1,400, to a total of 105,100. Employment in this industry in the Detroit Metropolitan Statistical Area has been decreasing since February.

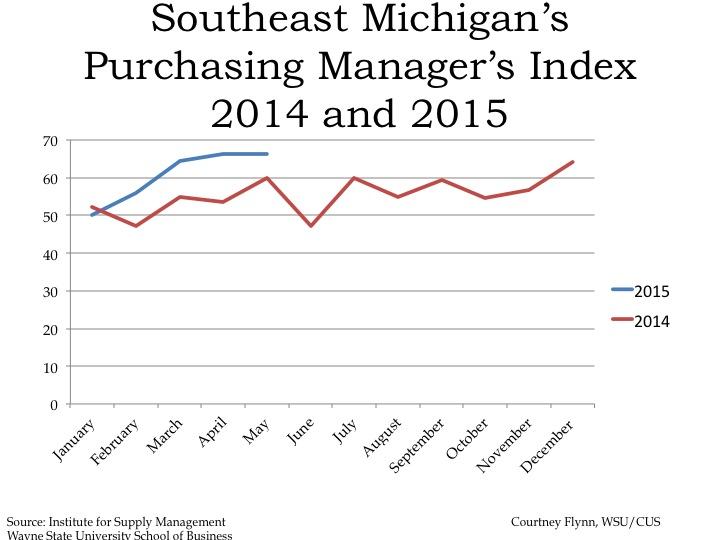
The Purchasing Manger’s Index (PMI) is a composite index derived from five indicators of economic activity: new orders, production, employment, supplier deliveries, and inventories. A PMI above 50 indicates the economy is expanding.

According to the most recent data released on Southeast Michigan’s Purchasing Manager’s Index, the PMI for May 2015 was 66.4, an increase of 0.1 points from the prior month. It was also an increase of 6.4 from May of 2014.

The above charts show the Standard and Poor’s Case-Shiller Home Price Index for the Detroit Metropolitan Statistical Area. The index includes the price for homes that have sold but does not include the price of new home construction, condos, or homes that have been remodeled.

According to the index, the average price of single-family dwellings sold in Metro Detroit was $101,530 in March 2015. This was an increase of approximately $3,130 from the average price in February 2015. Since March of 2014, prices have increased by $3,330.


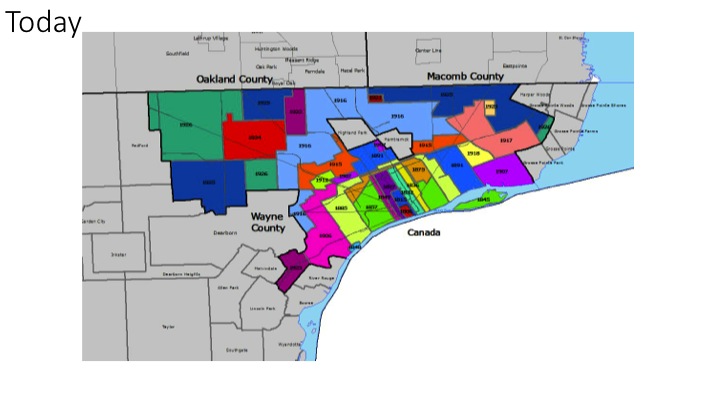
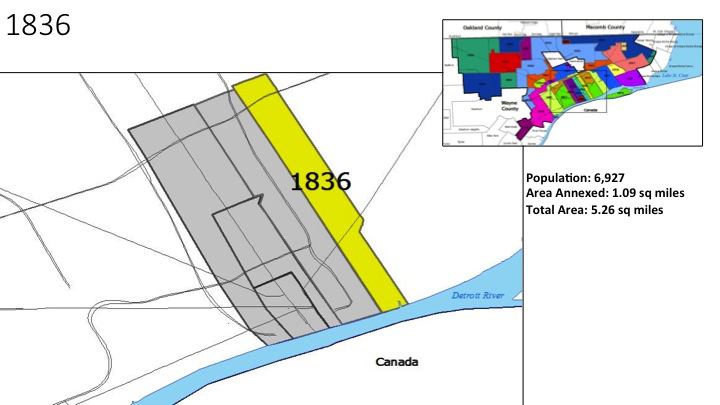
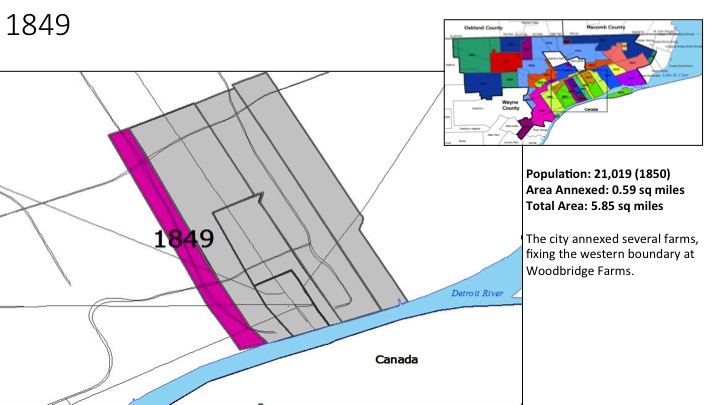
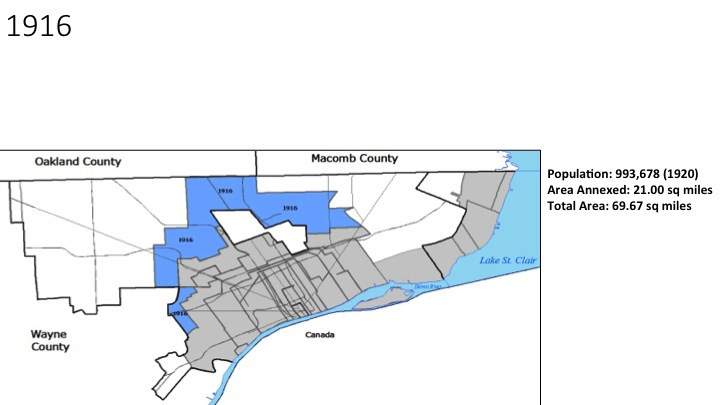
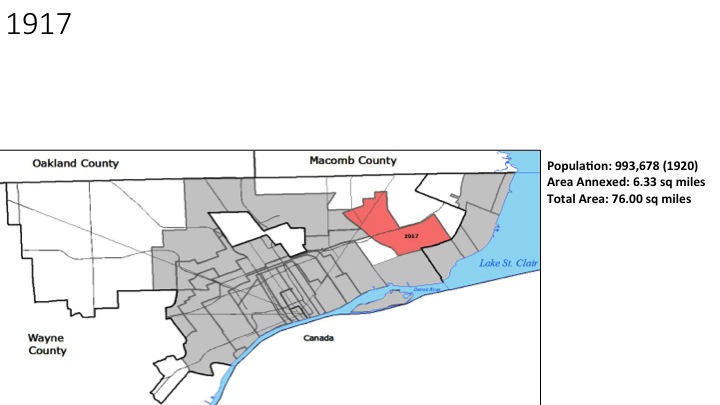
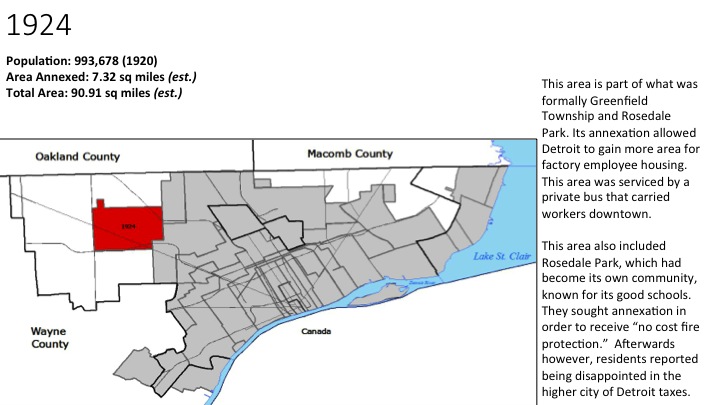
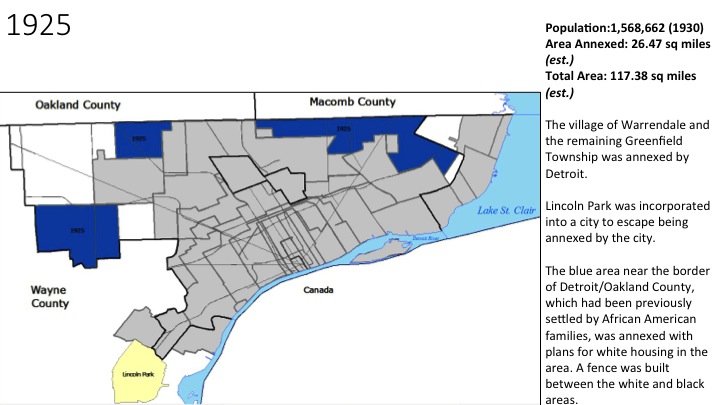
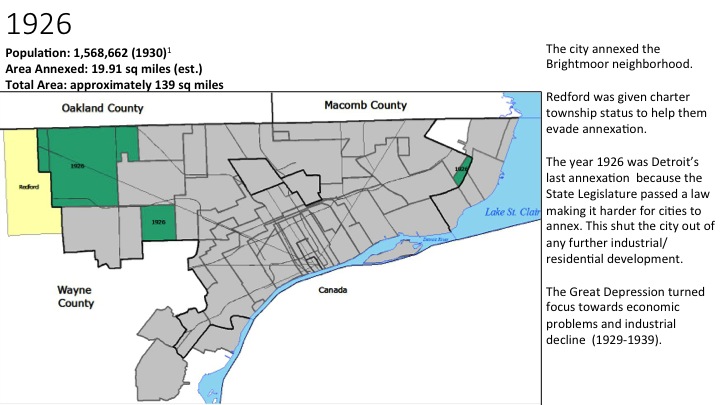
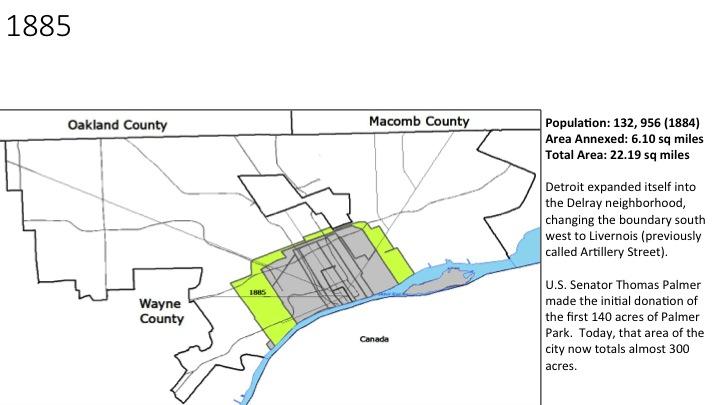
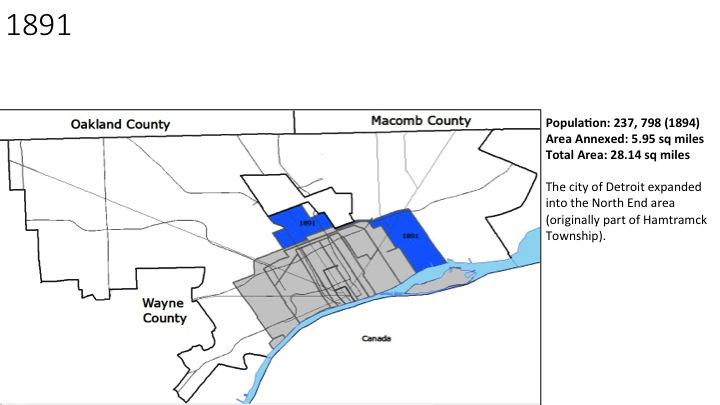
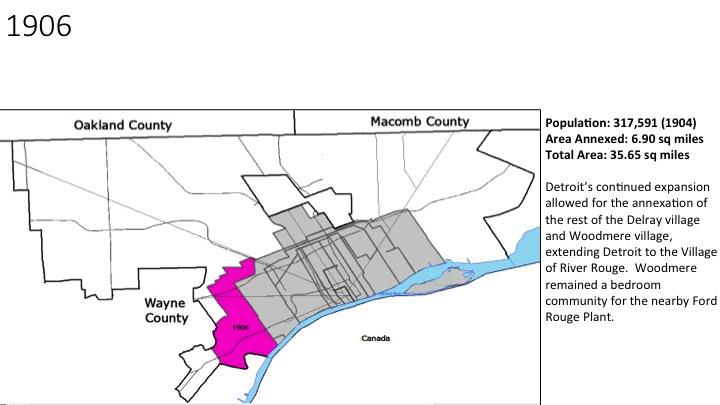
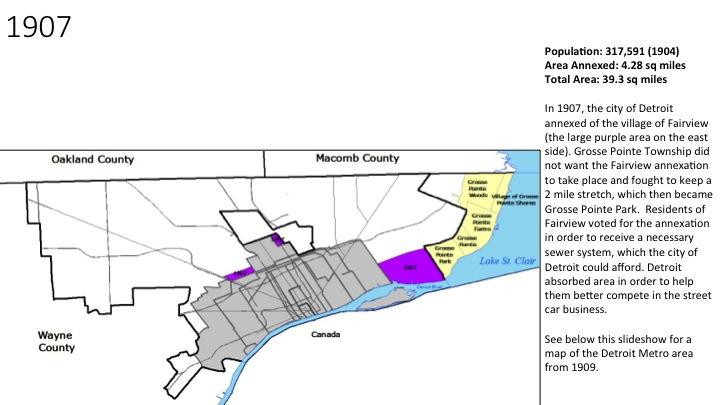
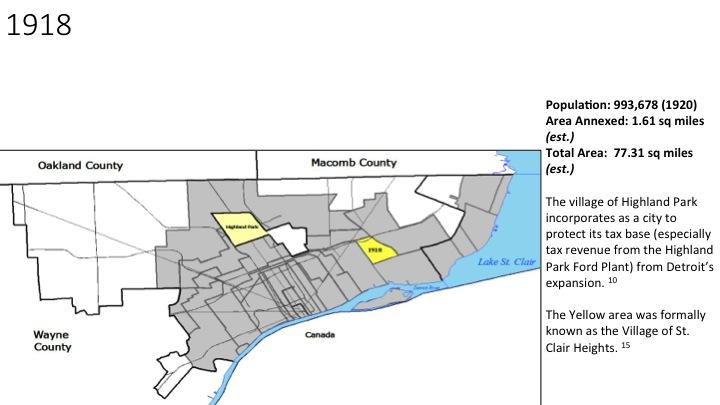
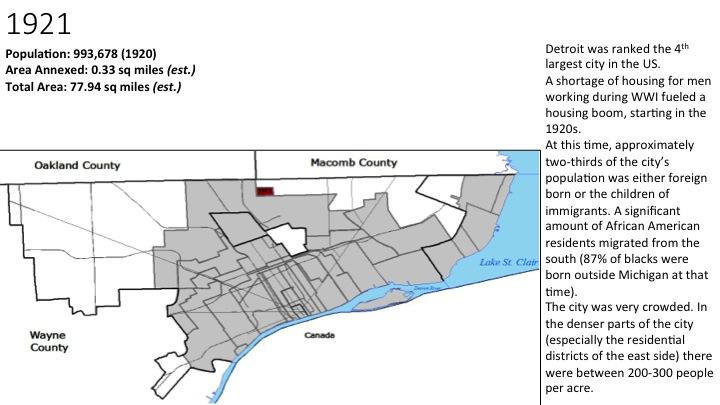
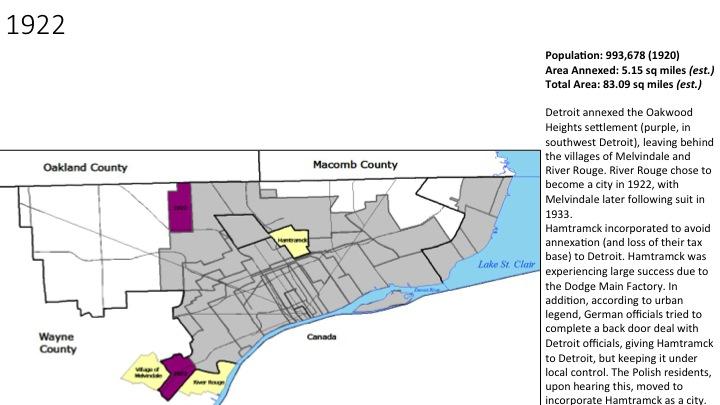
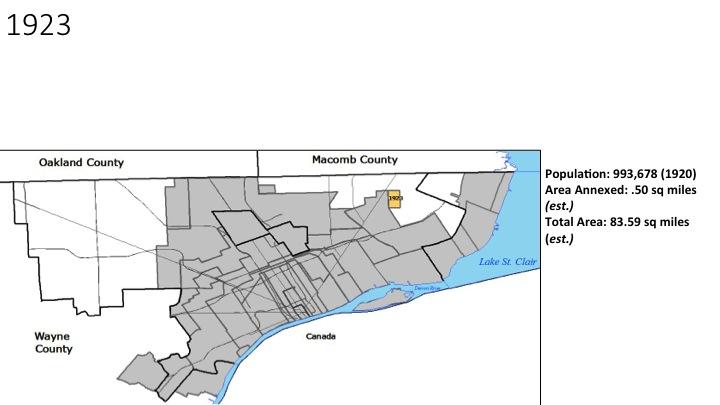
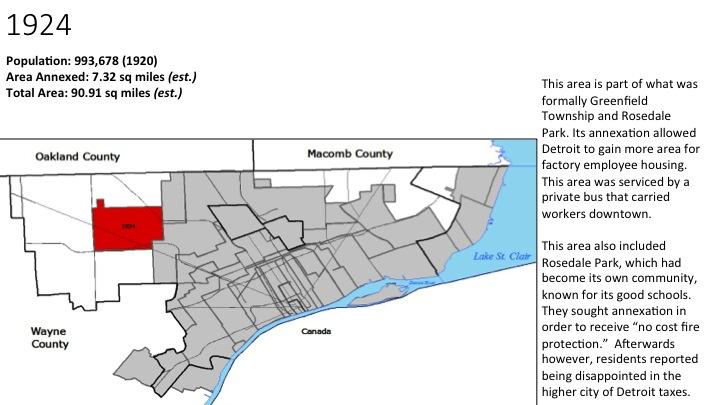
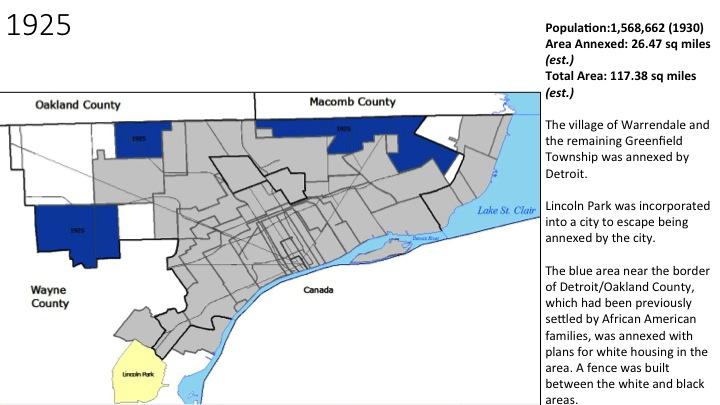
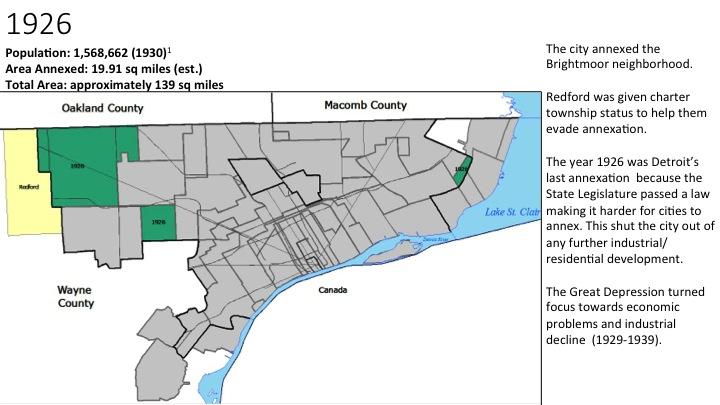
Detroit Annexation 1806-1926

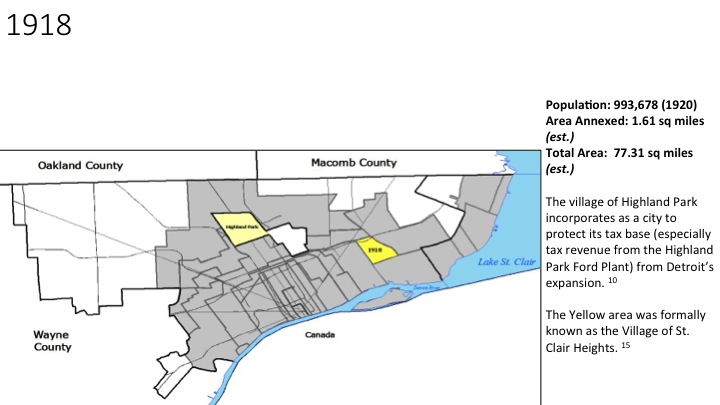
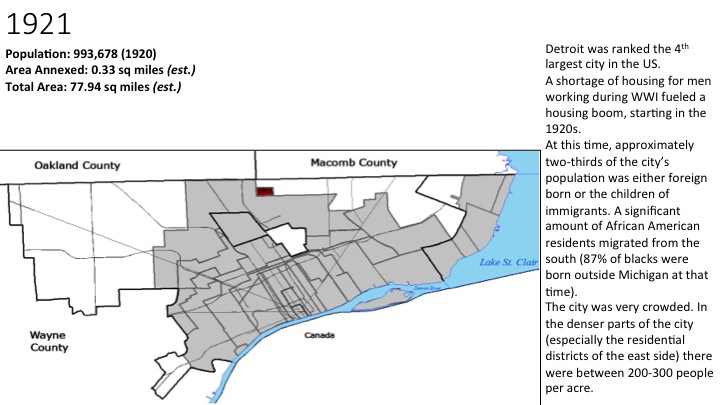
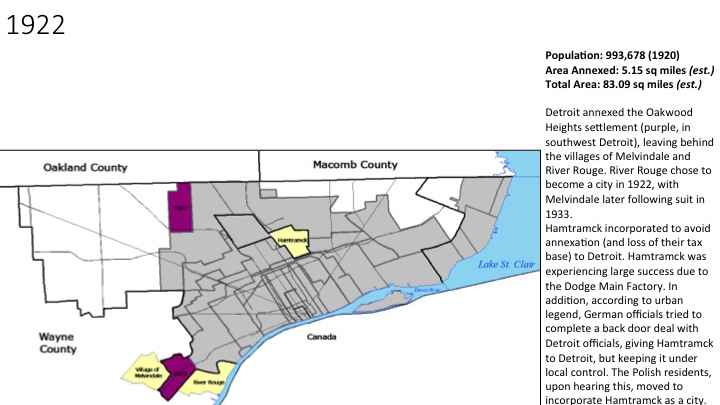
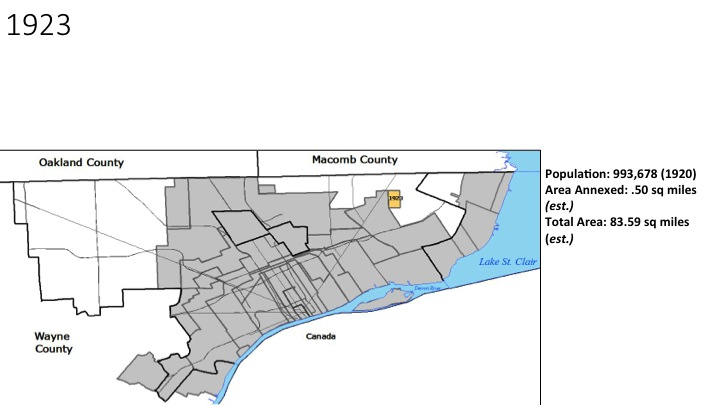
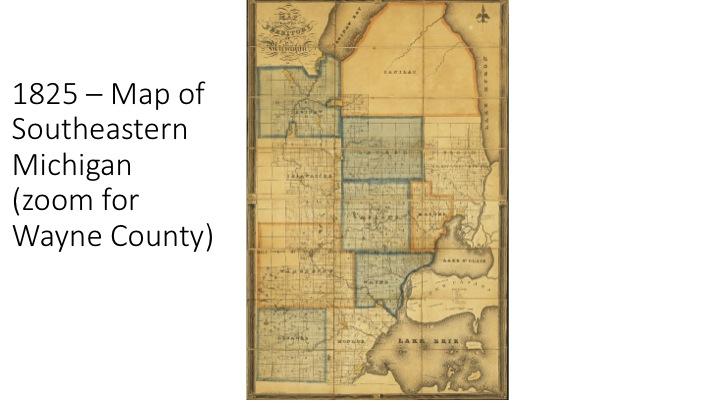
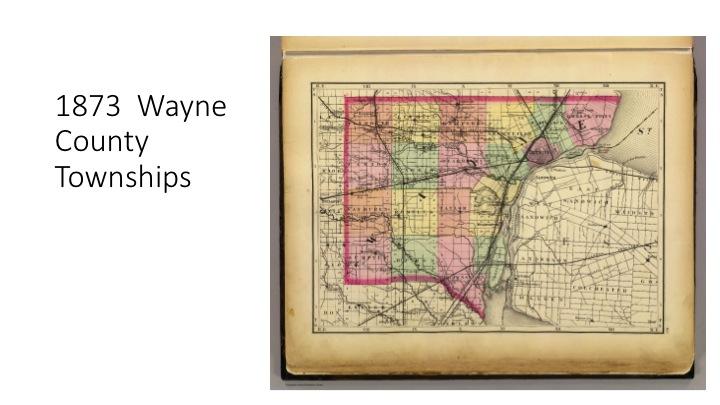
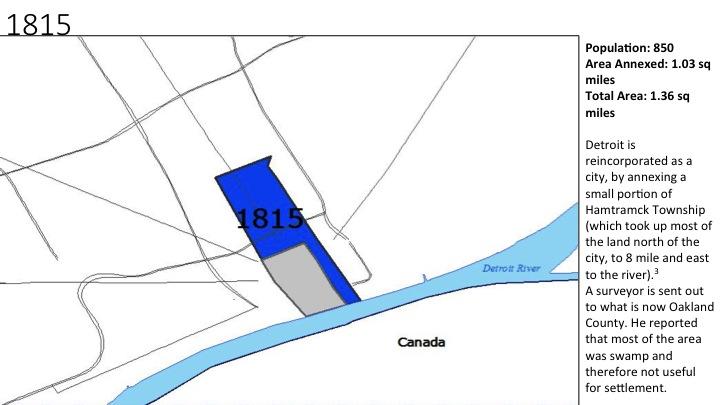
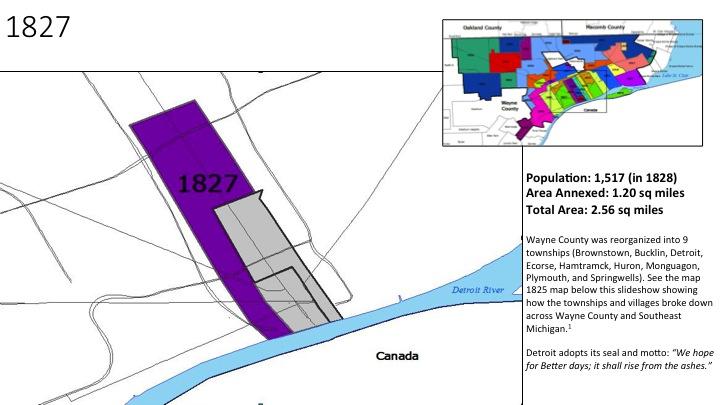
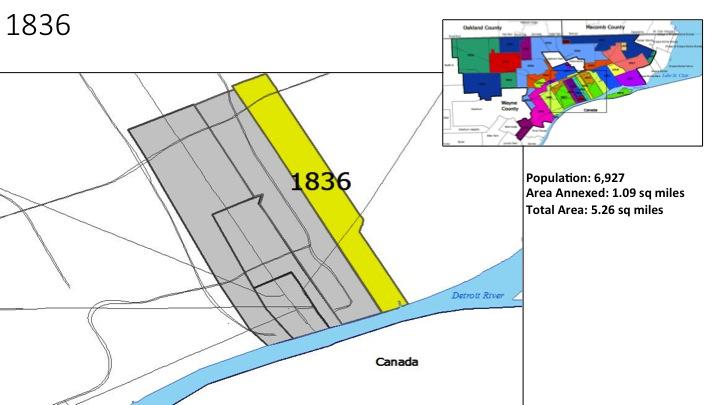
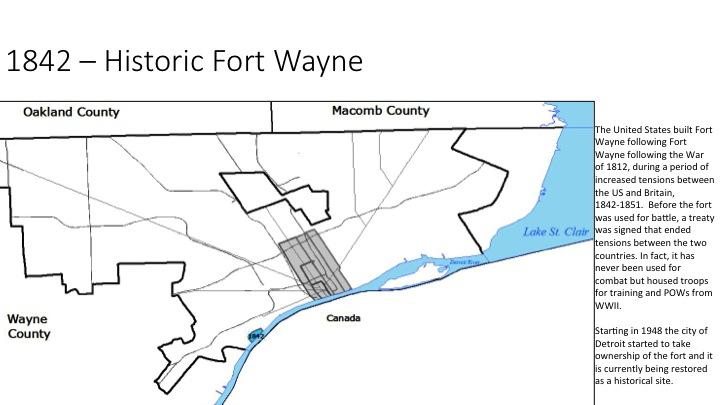
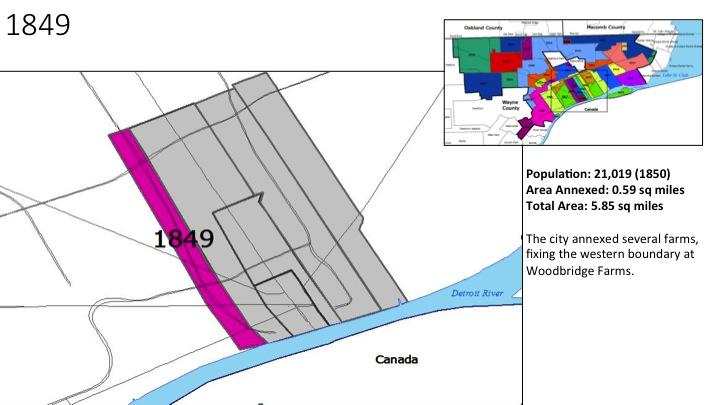
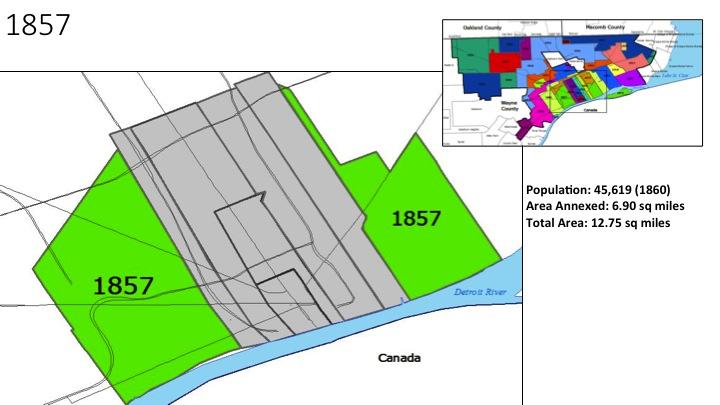
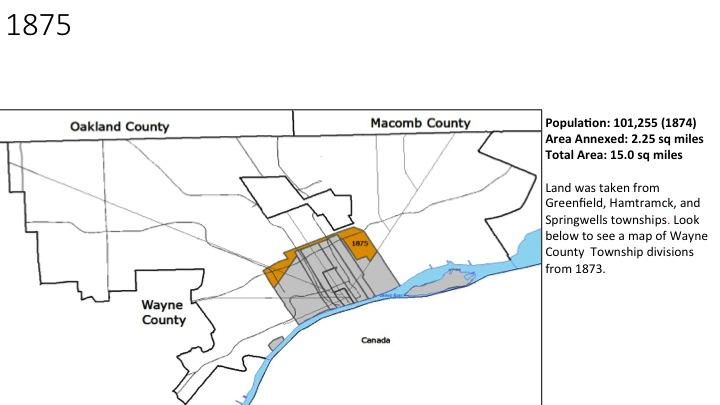
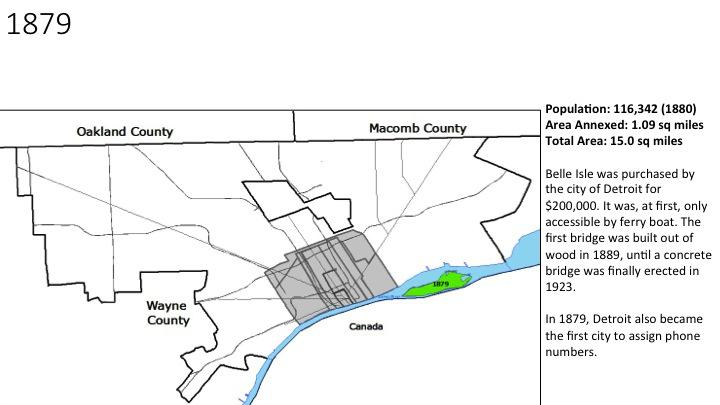
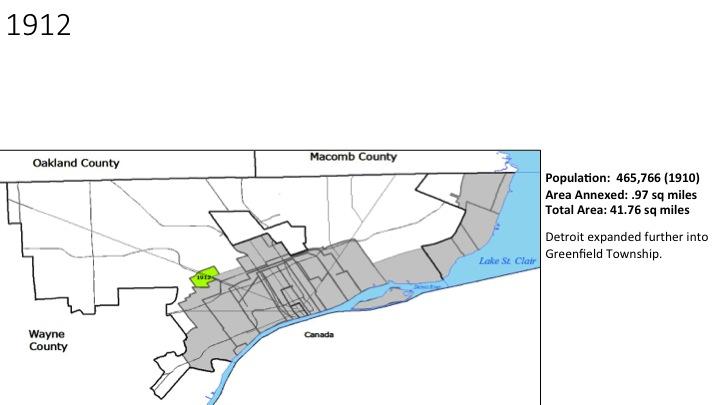
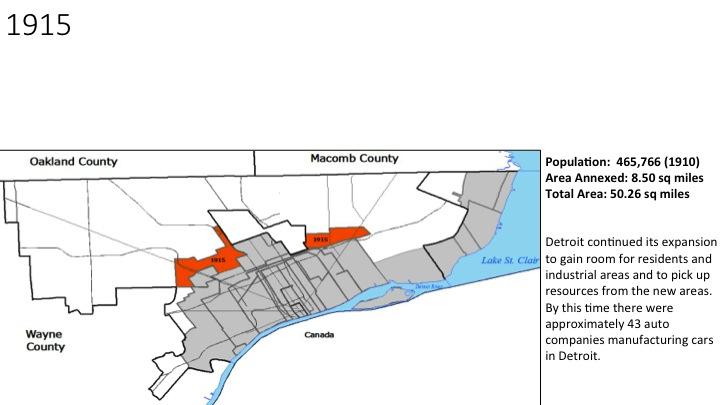
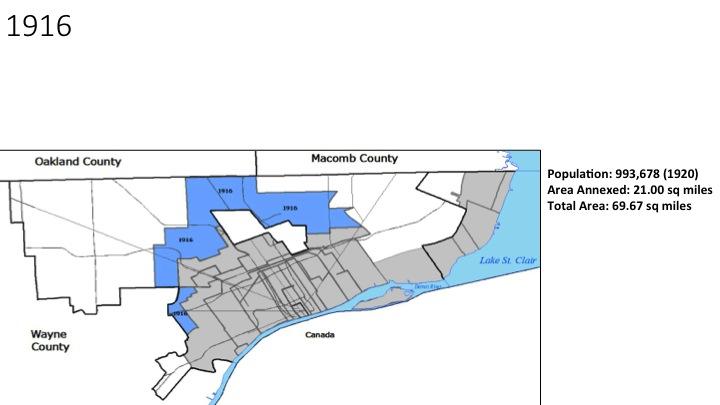
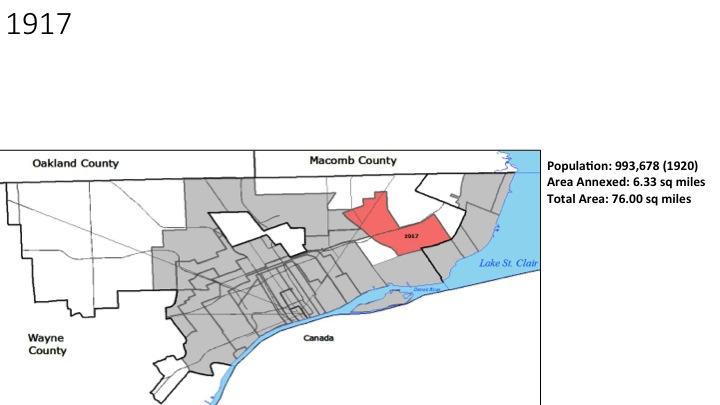
Beyond the city proper, most early land annexations involved taking control of land that was undeveloped or farmed. At that time most of Wayne, Oakland, and Macomb counties were covered in swampy areas and drainage of these swamps allowed settlement into the new areas of Southeast Michigan.

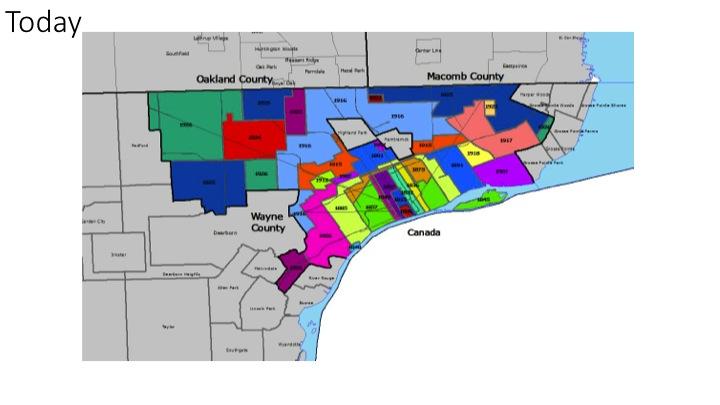
Villages vs. City – Cities incorporate in order to  have more power than a village designation. Villages are not autonomous to the townships they reside in and is vulnerable to annexation by neighboring cities that are looking to increase their tax base. Villages benefit from joining larger cities because they can take advantage of their infrastructure and city services. Throughout the development of the City of Detroit and Metro area, many smaller villages were formed. The ability to stand up to annexation came down to a village’s resources and the residents voting to join or form a larger city.

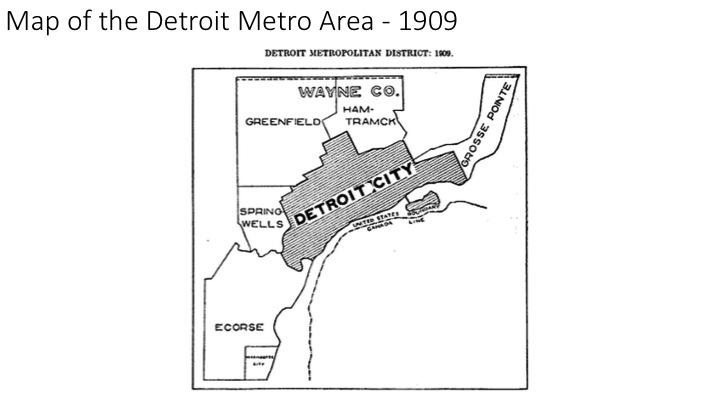
After 1909 –  annexations were made much harder. Home Rules for cities and villages made it easier for the surrounding communities to both incorporate and avoid joining the City of Detroit. These home rules have set up something of a “turf war” with residents/politicians creating a dysfunctional system where they compete over resources, rather than working together as a regional unit.

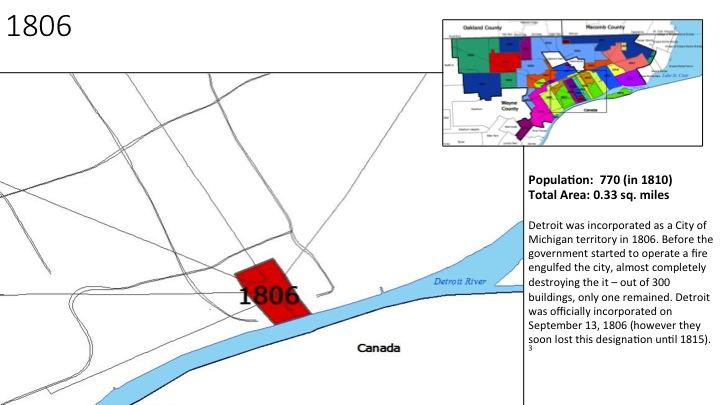
This post examines how Detroit grew in size from 1806 to 1926. However, there are still questions as to what caused the city to stop annexing. In future posts we will further delve into what caused the city to stop annexing additional lands and what consequences the city of Detroit has experienced because of this.

For a close up of the images in the slideshow please scroll to the bottom of this post.

Detroit Annexation Images

WORKS CITED

1.When Detroit Was Young by Clarence M. Burton

2.Weber, P (2013). The rise and fall of Detroit: A timeline. The Week. Retrieved from: http://theweek.com/articles/461968/rise-fall-detroit-timeline

3.The Detroit Historical Society. (2015). A Timeline of Detroit. Retrieved from: http://detroithistorical.org/learn/timeline-detroit/early-american-detroit-1787-182

4.Kowalski, G. (2002). Hamtramck: The Driven City. Arcadia Publishing. Chicago, IL.

5.Historic Fort Wayne Coalition. (2011). Historic Fort Wayne’s History. Retrieved from: http://www.historicfortwaynecoalition.com/fortabout.html

6. Burton, C., Stocking, W., Miller, G ((YYYY). The City of Detroit, Michigan, 1701-1922

7.Checklist of Printed Maps of the Middle West to 1900, 5-2112; Karpinski, 478; Phillips, 1960; Phillips Maps of America, p. 427; Miles, Michigan atlases and plat books, 2; LeGear, Atlases of the United States, L1754

8.The Detroit Historical Society. (2015). A Timeline of Detroit. Retrieved from: http://detroithistorical.org/learn/timeline-detroit/early-american-detroit-1787-1820

9.Belle Isle Conservancy. (2015). History of The Park. Retrieved from: http://belleisleconservancy.org/learn-more/history-of-the-park/

10.http://www.gphistorical.org/timeline.html

11.http://www.modeldmedia.com/features/fairview17008.aspx

12.Sauer, E.A., Perry, C.M. (1917). Perry’s Guide of Detroit and Suburbs: A Complete Reference to the Location of Streets, Steam, and Electric Car lines, Corner House Numbers, Etc. and the Latest Information about the City, It’s Manufactories, Churches, Schools, Parks and Public Buildings. Sauer and Perry: Unknown.

13.https://books.google.com/books?id=yTQdAQAAIAAJ&pg=PA43&lpg=PA43&dq=village+of+st.+clair+heights+detroit+annexation+1918&source=bl&ots=I3LnEWPRbV&sig=srY9tNUN2HxI26GUXCoXo9zmv-M&hl=en&sa=X&ei=7PFAVYzlDIixsAXyjIHgDw&ved=0CC0Q6AEwAw#v=onepage&q=village%20of%20st.%20clair%20heights%20detroit%20annexation%201918&f=false

14.Farley, R., Sheldon, D., Holzer, H. (2000). Detroit Divided. Russell Sage Foundation: New York, NY.

15.Kowalski, G. (2002). Hamtramck: The Driven City. Arcadia Publishing. Chicago, IL.

16.Oliver, Z, (1982). The Changing Face of Inequality: Urbanization, Industial Development and Immigrants in Detroit, 1880-1920. University of Chicago Press. Chicago, IL

17.http://www.detroittransithistory.info/Routes/Tireman-JoyHistory.html

18.Crabgrass Frontier: The Suburbanization of the United States Paperback – April 16, 1987 by Kenneth T. Jackson; http://detroit1701.org/Carver%20Elementary%20School.html

19.Map of the surveyed part of the territory of Michigan.(1825). Made by Orange Risdon. Engraved in Albany, New York by Rawdon, Clark & Co, and published by Orange Risdon.​ Taken from https://www.lib.msu.edu/branches/map/michigan/#OtherLocalMaps

20.Checklist of Printed Maps of the Middle West to 1900, 5-2112; Karpinski, 478; Phillips, 1960; Phillips Maps of America, p. 427; Miles, Michigan atlases and plat books, 2; LeGear, Atlases of the United States, L1754

21.Bureau of the Census. (1910). Thirteenth Census of the United States Taken in the Year 1910: Manufacturers, 1909, General Report.

22.Board of County Auditors, Detroit Michigan (1926). Manual: County of Wayne- Michigan: 1926. DetroitMichigan. Retrieved from: https://archive.org/details/manualcountyofwa00wayn on May 26, 2015.

Detroit, St. Clair County have highest confirmed rate of child abuse/neglect victims in the region

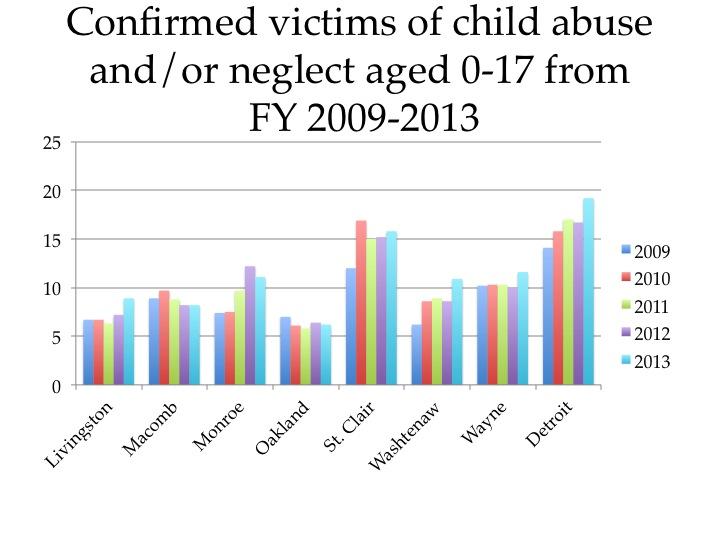
From 2009 to 2013, St. Clair County consistently had the highest rate of confirmed victims of child abuse and/or neglect in the seven county region, according to the Michigan League for Public Policy and Kids Count (these organizations obtained their data from the Michigan Department of Human Services). However, for four of those five years, Detroit’s rate of confirmed child abuse/neglect victims far exceeded that of St. Clair County.

All rates discussed in this post are per 1,000 children ages 0-17, unless otherwise noted. These numbers reflect an unduplicated count of children in a given fiscal year where the alleged abuse or neglect was confirmed after an investigation, according to the Michigan Department of Human Services.

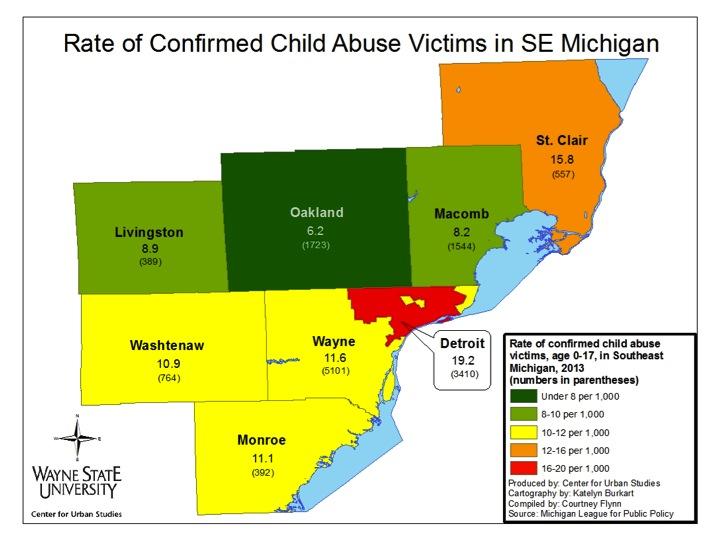
The map above shows the rate and number of confirmed victims of child abuse/neglect for the region in fiscal year 2013. Detroit, which is the only Michigan city with such information available through the data source, had a higher rate than the counties (19.2) in 2013. This rate of 19.2 confirmed victims of abuse and/or neglect per 1,000 children ages 0-17 was equivalent to 3,410 total cases.

As already noted, St. Clair County had the highest child abuse/neglect victim rate of the counties in the region in 2013 at 15.8; this was 557 confirmed victims.

In 2013, Oakland County had the lowest child abuse/neglect victim rate in the region. The rate was 6.2, which equaled 1,723 confirmed victims.

The rate of confirmed child abuse/neglect victims for the State of Michigan in 2013 was 14.9 per 1,000 children.

With the exception of 2010, from 2009 to 2013, Detroit had higher rates of confirmed child abuse/neglect victims than the counties in the region. In 2010, St. Clair County had the highest rate at 16.9 per 1,000 children; Detroit’s rate was 15.8 per 1,000 children at that time. Additionally, Detroit experienced its largest rate increase between 2012 and 2013; the rate increased from 16.7 to 19.2 per 1,000 children. Between 2012 and 2013, Macomb, Oakland, and Monroe counties were the only ones that did not experience a rate increase. Between 2012 and 2013, Macomb County’s rate remained the same at 8.2, while Monroe County’s rate decreased from 12.2 to 11.1 and Oakland County’s rate decreased from 6.4 to 6.2.

Macomb and Oakland counties were the only counties in the region that experienced rate decreases between 2009 and 2013.

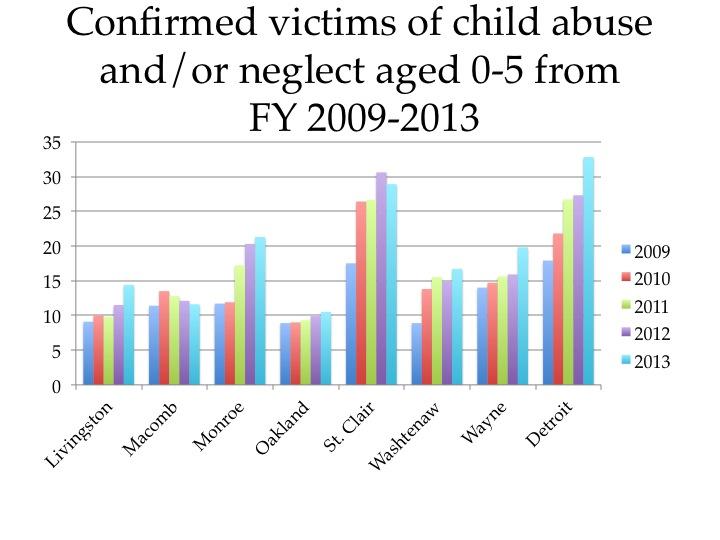
In the above chart, we look at the rate of confirmed child abuse/neglect victims for children between the ages of 0-5 in the region. Again, we see that Detroit and St. Clair County had the highest rates. In 2013, Detroit’s rate was 32.8, while St. Clair County’s was 28.9 per 1,000 children. In 2009, 2010, and 2012, St. Clair’s rates (17.5, 26.4, 30.6, respectively) were higher than Detroit’s (17, 21.8, 27.3, respectively).

For all the years examined, Oakland County had the lowest confirmed child abuse/neglect rates in the region for children ages 0-5. In 2009, its rate was 8.9 and by 2013, its rate had increased to 10.5. Overall, there was a general trend of rate increases across the region. Detroit had the largest rate increase between 2009 and 2013; its rate increased by 15.8 in that five-year time frame.

Although Macomb County’s rate increased by 2.1 between 2009 and 2010, it is the only county in the region that experienced a consistent downward trend in the confirmed child abuse/neglect victim rate between 2010 and 2013, leaving it only .2 points higher than its 2009 rate. Of the counties examined, this was the closest any county in 2013 was to its rate in 2009.per 1,000 children in 2010. But since 2010 the rate has decreased each year.

NYT: Home-price growth driven by multiple economic factors

A recent graph produced by the New York Times shows that while home prices are bouncing back across the U.S. there are different factors driving those increased prices. For Detroit, the cost of purchasing a home is increasing by the lack of supply while in Grand Rapids price is being driven up because of demand. To see the full economics on the growth of home prices in metropolitan areas in Michigan and across the U.S. click here to see the NYT graph based off of a report by Fitch Ratings.