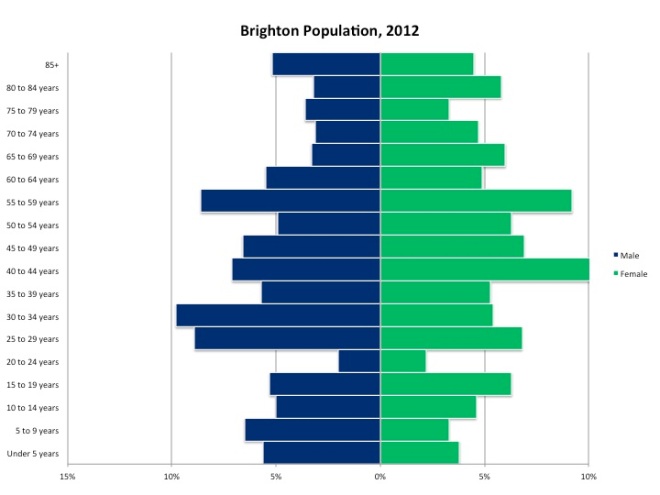
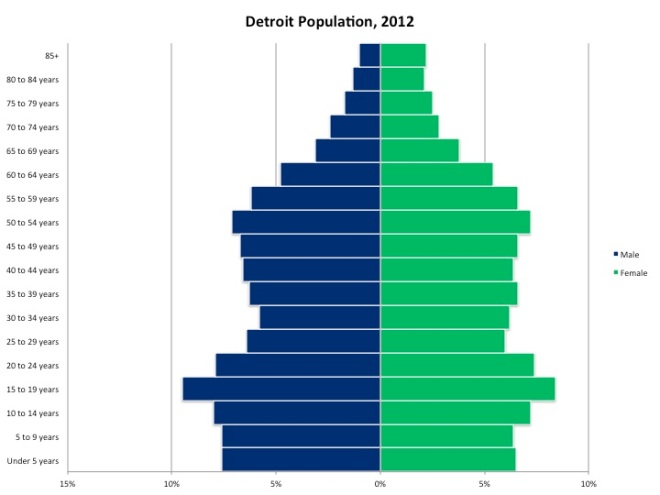
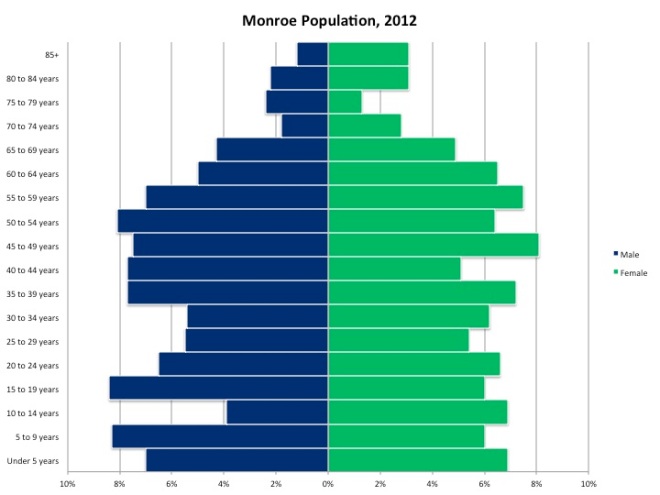
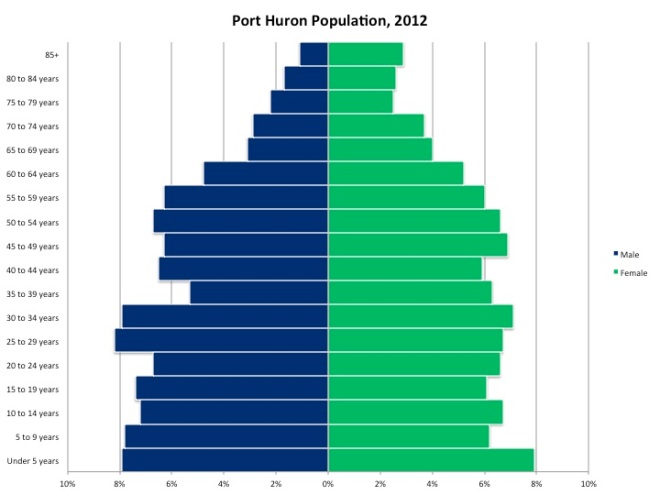
In this post we examine the age distributions of the 2012 population by displaying the data in population pyramids for the following cities: Ann Arbor (Washtenaw County), Brighton (Livingston County), Detroit (Wayne County), Livonia (Wayne County), Monroe (Monroe County), Port Huron (St. Clair County), Sterling Heights (Macomb County),and Troy (Oakland County). For each city the percent of the population in the age groups listed on the y-axis are displayed for both males and females. The age groups with the wider arm in the pyramid represent age groups that make up a larger percent of the city’s overall population. These cities were chosen because they are the largest cities in each of the seven counties of Southeast Michigan; Livonia was included in addition to Detroit to highlight what differences may exist between the county’s two largest cities. All population data was taken from the American Community Survey, 2012-5 year estimates. They are listed in alphabetical order. Note that the scale for the City of Ann Arbor pyramid is different in order to accommodate local patterns, so readers should attend closely to the scales.
In addition to a population pyramid showing age distribution of the population, it also sheds light on the birth rate, death rate and life expectancy of the population. There are general shapes to a population pyramid: a pyramid, a box or barrel, and an inverted pyramid. These type of pyramids represent the following:
- Pyramid: a developing nation, or in this case city, with a slow growth rate, high birth rate, and often a short life expectancy.
- Barrel: a nation or city that is already well established with a low infant mortality rate, slow population growth, and high life expectancy.
- Inverted pyramid: a nation or city with negative growth, which is associated with a low birth rate, a shrinking population and low life expectancy.
In this post, one sees substantially diverse pyramids across the cities. One visual pattern, consistent with all other data, is the far higher share of women living to greater ages than men.
Note: Ann Arbor’s scales are substantially different than the other charts to accommodate the large college age population.
In 2012, the majority of the population in Ann Arbor, which is home to the University of Michigan, was ages 15 -19 and 20 -24: for females 31.5 percent of the population was represented in these two age groups and for males and 38.5 percent of the population was represented. Of all the age groups, the 20-24 one was the most represented for males and females: for females, 19.3 percent of the population was aged 20-24 and for males 20.7 percent of the population was aged 20-24 in 2012. Aside from the population bulges for the college-age students, population growth was fairly stable, as can be seen by the similar age-group representations throughout the pyramid. However, population among children is much lower than some other cities in this post.
In 2012 in Brighton, 51.6 percent of the male population was between the ages 25 and 59 in 2012 and 70.7 percent of the female population was in that age range. The age group of 40-44 had the highest percentage of females in 2012, with 10.6 percent of the female residents being in that age range. For males, the most common age group was between the ages of 30 and 34; 9.8 percent of the male population was in that age range. In Brighton, the 20-24 age group was the least numerous, with 2 percent of males in Brighton being in that age group and 2.2 percent of females. Brighton is the only city in this post where there were more older men than women. This can be seen by the fact that the percent of males aged 85 and above was 5.2 percent while only 4.5 percent of females were aged 85 and above.
The city of Detroit compared to the other cities in this post, with the exceptions of Port Huron and Monroe (for females) had a relatively high birth rate, as can be seen by the fact 32.7 percent of the males in the city were aged 19 or below and 28.5 percent of the females in Detroit were below the age of 19 in 2012. According to the Michigan Department of Community Healthy, the city’s birth rate in 2012 was 14 per 1,000 residents; the state’s was 11.4. Detroit’s population bulge occurred in the 15-19 age group for both males and females. Also, in 2012, according the Michigan Department of Community Health the infant mortality rate in Detroit was 15 while the state of Michigan’s was 6.9.
As the population ages, the chart shows a more traditional male-to-female ratio in the older years, unlike in Brighton. Starting with the 60 to 64 age grouping, there began to be a larger difference between the percent of males represented versus the percent of females represented in the population. In total, 14.3 percent of the males in Detroit were aged 60 and above in 2012 compared to 18.8 percent of females who were aged 60 and above.
For the city of Livonia, the population bulge in 2012 was between the ages of 45 and 59 for both males and females (25.2% of both males and females where in this age range), highlighting the baby boomers, who would have been between the ages of 47 and 66 in 2012. Overall, the population pyramid for Livonia’s population in 2012 shows that the population was middle aged. For males, the age group with the highest representation was the 50-54 percent age group with 8.9 percent. For females, the 50-54 age group had the highest representation at 9.2 percent.
The population pyramid shows Monroe’s population was fairly stable, with a fewer percentage of both males and females in the 25-34 age range. Also, aside from those five-year ranges aged 70 and above, males between the age of 10 and 24 years of age were the smallest group at 3.9 percent, indicating an aging population.
In 2012, Port Huron’s population pyramid showed that the population was slightly growing, because of the high dependent population, which is those age 9 and under, and overall pyramid shape to the population distribution, with a wide base and narrow top, closely resembling a pyramid. At that time, 26.9 percent of females in Port Huron were 19 or under and 30.3 percent of males were 19 or under. In Port Huron in 2012 the birth rate was 14 per 1,000 residents, compared to the state’s rate of 11.9.
The population pyramid above, which represents Sterling Heights, is more stable, seeing as how a majority of the age groups represented in the chart made up similar percentages of the population in 2012. For males, the 45-49 age group was the most represented at 7.9 percent and for females the 50-54 age group had the highest representation at 7.8 percent. Sterling Heights, like Livonia, shows a bulge in the population just beyond child-bearing years, but still of working age.
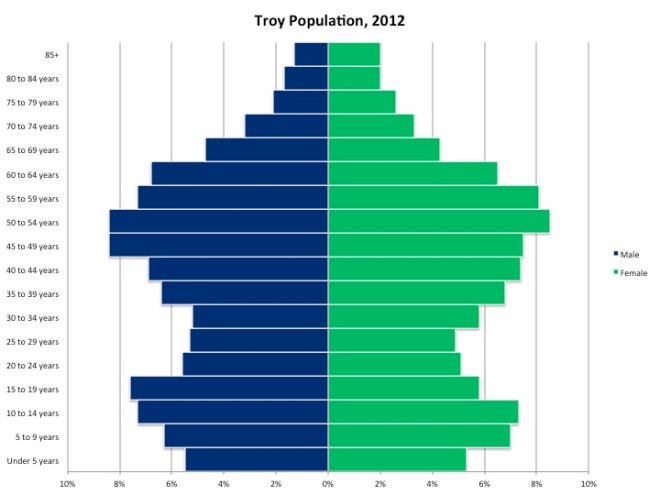
For the city of Troy, those between the ages of 35-69 and 5-19 for both males and females were part of the population bulges. For males, the age groups of 45-49 and 50-54 each had the highest representation of the population at 8.9 percent. For females, the 50-54 age group had the highest representation at 8.4 percent. In addition to the middle-age population bulge, this chart shows that in recent years birth rates started to decline, as can be seen from the transition from the under 5 years of age group up through the 15-19 years of age group. For example, in 2012 the birth rate per 1,000 in the city of Troy, according to the Michigan Department of Community Health, was 9.8 per thousand residents (this is less than the state’s and far less than Detroit’s 14). Those under 5 years of age for males made up 5.5 percent of the male population, and females under the age of 5 made up 5.3 percent of the female population.

