Southeastern Michigan Poverty Levels Drop Slightly

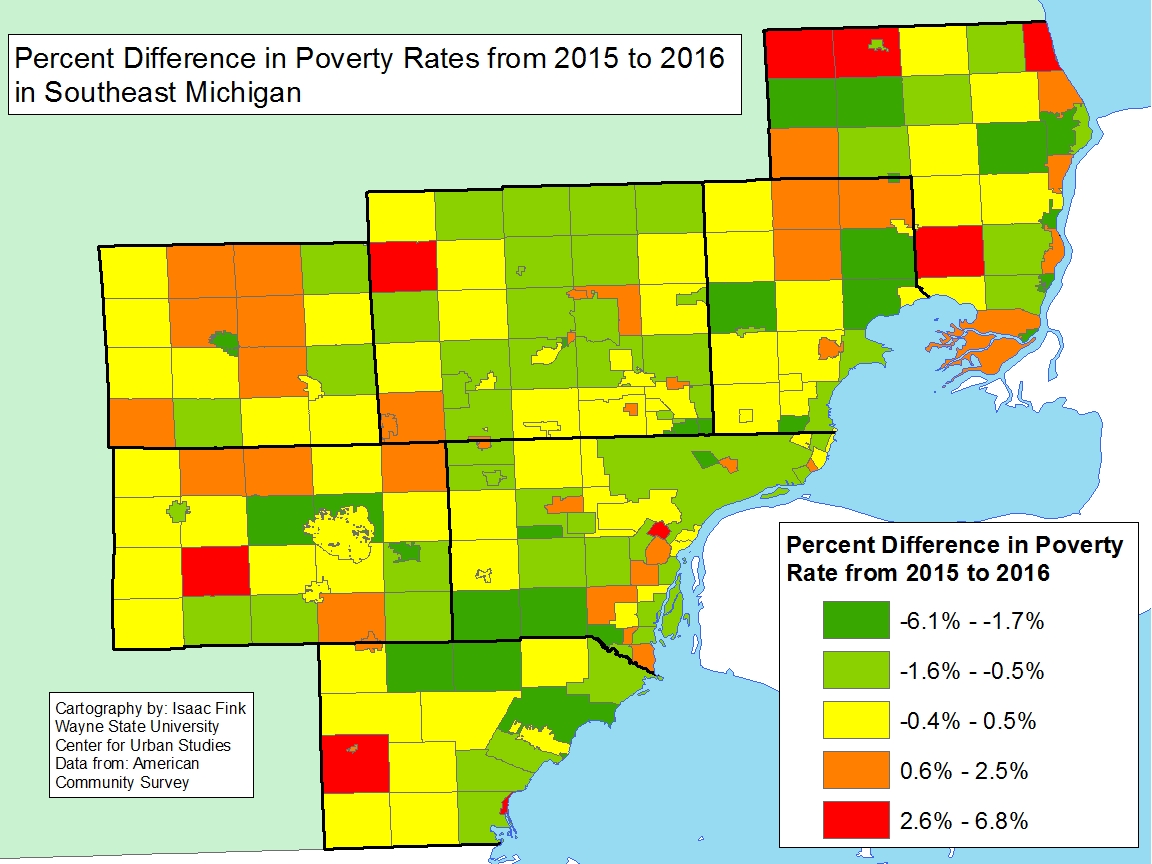
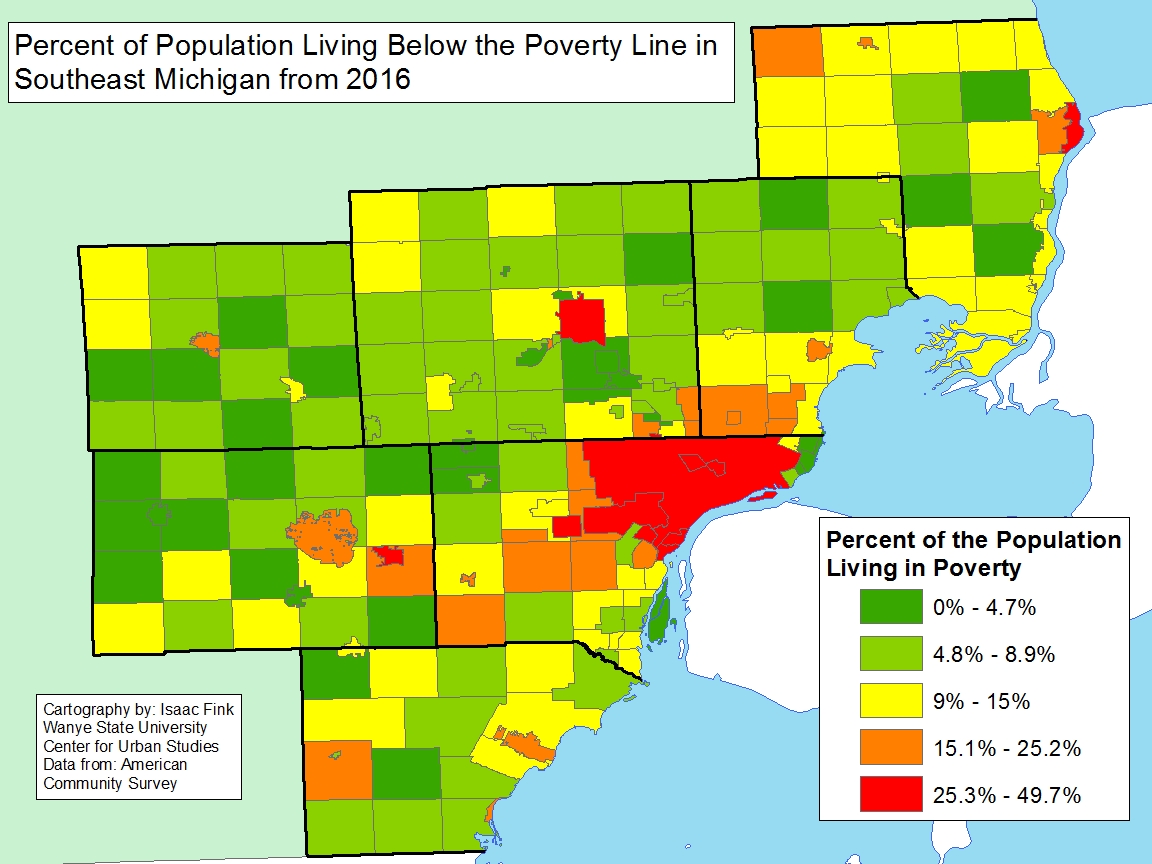
Throughout Southeastern Michigan, majority of the communities in the region experienced a decrease in the percentage of residents living below the poverty level between 2015 to 2016, according to data from the U.S. Census Bureau. In 2016, a family of four was considered to be living at the poverty level with an annual income of $24,250, according to the U.S. Department of Health and Human Services; this was the same for 2015.

Southeastern Michigan was -0.2 percent. However, Summerfield Township in Monroe County experienced a 7 percent increase in the percentage of residents living below the poverty level between 2015 and 2016. In 2015, 9 percent of residents in Summerfield Township lived below the poverty level and in 2016, 16 percent of residents lived below the poverty level. Of the 28 municipalities (out of 213 in Southeastern Michigan) where there was a 1 percent or higher increase in the poverty level between 2015 and 2016, the majority were located in the rural suburbs of the region.


The municipality with the largest percentage decrease in residents living in poverty was Port Huron Township in St. Clair County at -5 percent. In 2015, 23 percent of the residents in Port Huron Township lived below the poverty level and by 2016 that decreased to 18 percent.

While there was an overall average decrease in the percentage of residents living in poverty between 2015 to 2016, the two cities with the highest overall percentage of residents living below the poverty level experienced an increase. In 2016, about 50 percent of the residents in Hamtramck lived below the poverty level; this was a 2.4 percent increase from 2015. In 2016, Highland Park had about 47 percent of its residents living below the poverty level, which was an increase of 2.5 percent.


Detroit

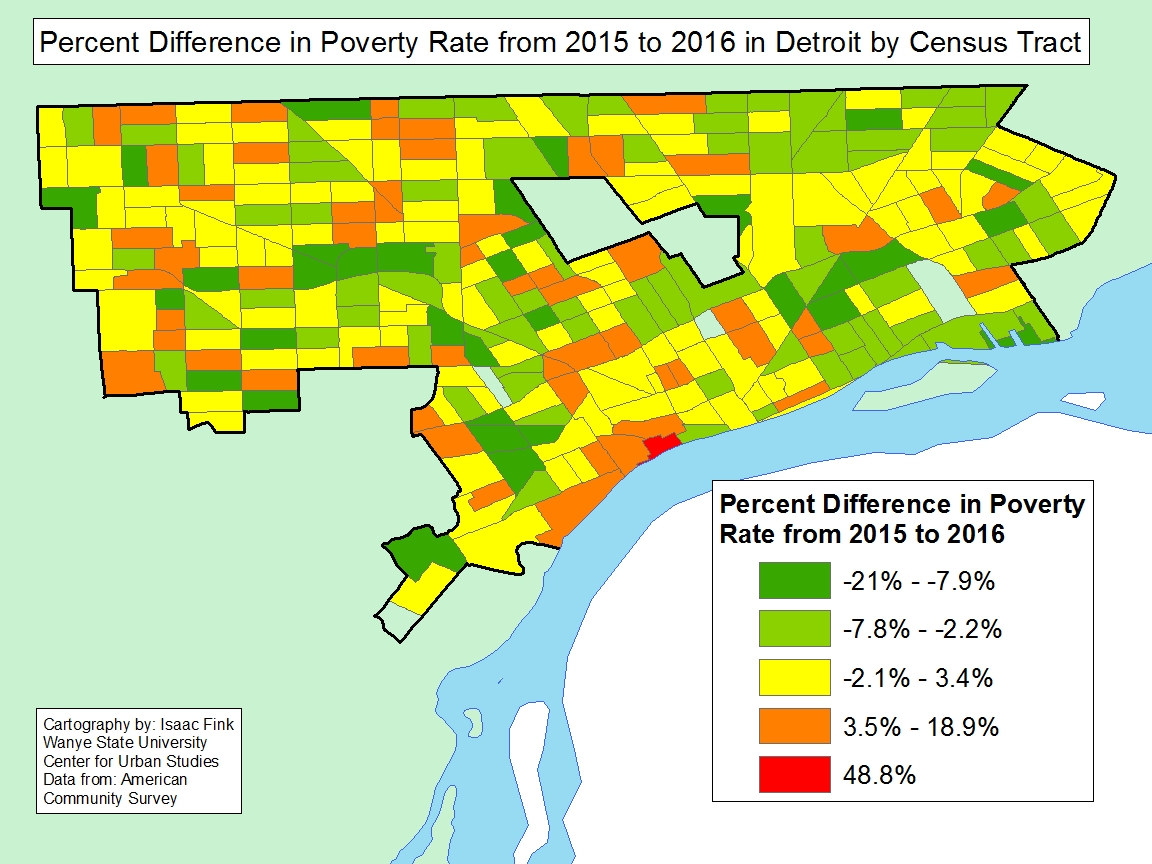
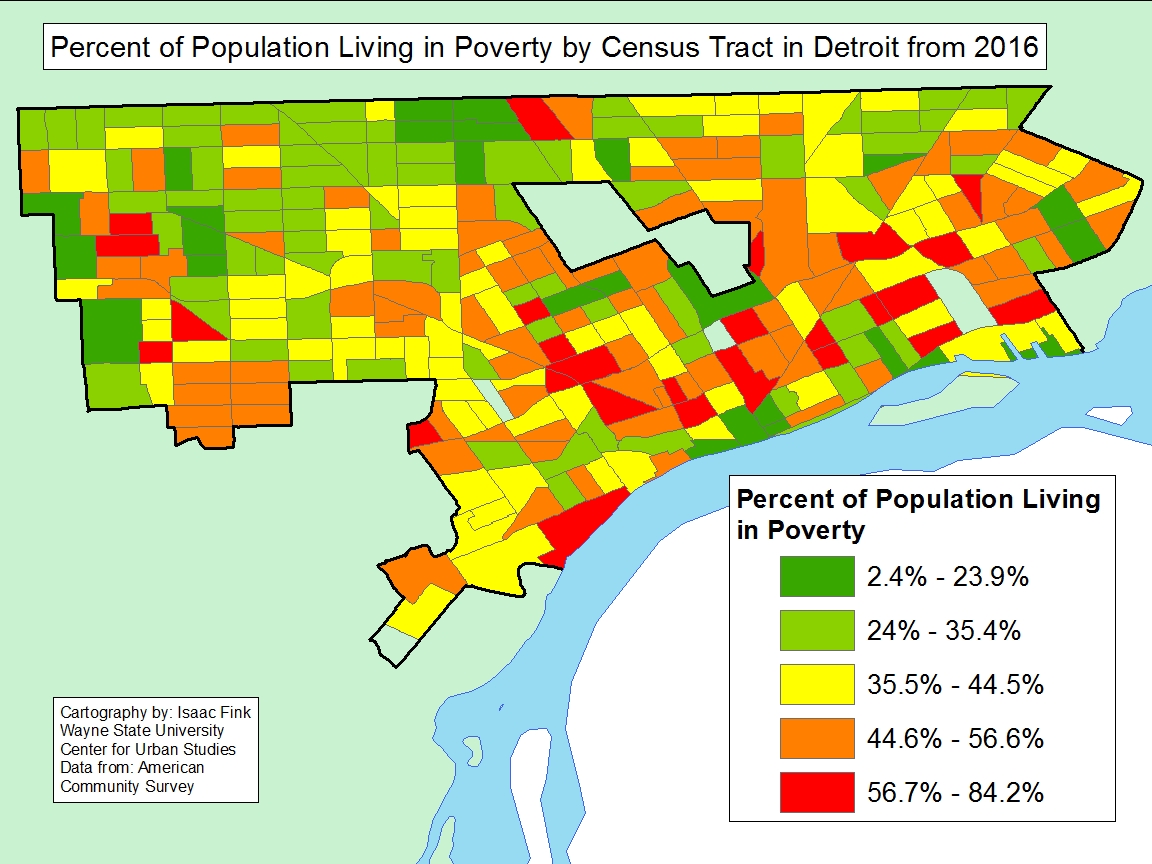
In 2016, about 39 percent of residents in Detroit lived below the poverty level, which was a decrease of 1 percent from 2015. A closer look at the Census tracts in Detroit though show that poverty levels did not decrease across the board. One Census tract specifically, which is located along the Detroit River in Southwest Detroit, experienced a 49 percent increase in the percentage of residents living below the poverty level. In addition to that Census tract, several others surrounding it also experienced poverty level increases up to 19 percent.

When looking at the Census tracts east of Hamtramck, with the exception of seven, all experienced a decrease in the percentage of residents living below the poverty level. It was this area of the City of Detroit that had the fewest number of Census tracts with percentage increases in the poverty level but also had among the highest poverty levels in 2016. It was just west of Highland Park though that had the most number of Census tracts with poverty levels below 35 percent in 2016.

Overall, the most recent poverty data released by the U.S. Census Bureau does show that poverty levels are decreasing, but not a rapid rate. The data also shows that there were 19 municipalities in the region with 20 percent or more of residents living below the poverty level. While this was a decrease from the 23 municipalities with the same statistic in 2015, the numbers still tell a story that Southeastern Michigan isn’t climbing out of poverty rapidly. We will need many years of broad based economic growth to reduce poverty levels substantially.
Detroit Childhood Poverty Increases 23 Percent Since 2000

Childhood poverty in Detroit has increased about 23 percent since 2000 and about 10 percent since 2010, according to data from the U.S. Census Bureau. In 2015 it was reported that the percentage of children under the age of 18 living in poverty in Detroit was 57.1 percent. This is compared to 46.9 in 2010 and 33.9 in 2000.

According to the U.S. Department of Health and Human Services, the poverty threshold for an individual in 2015 was an annual earning of $11,770 and for a family of four it was $24,250.  In 2010 the poverty threshold for an individual was $10,830 and for a family of four it was $22,050. In 2000 the poverty threshold for an individual was $8,350 for a family of four was $17,050.

2015

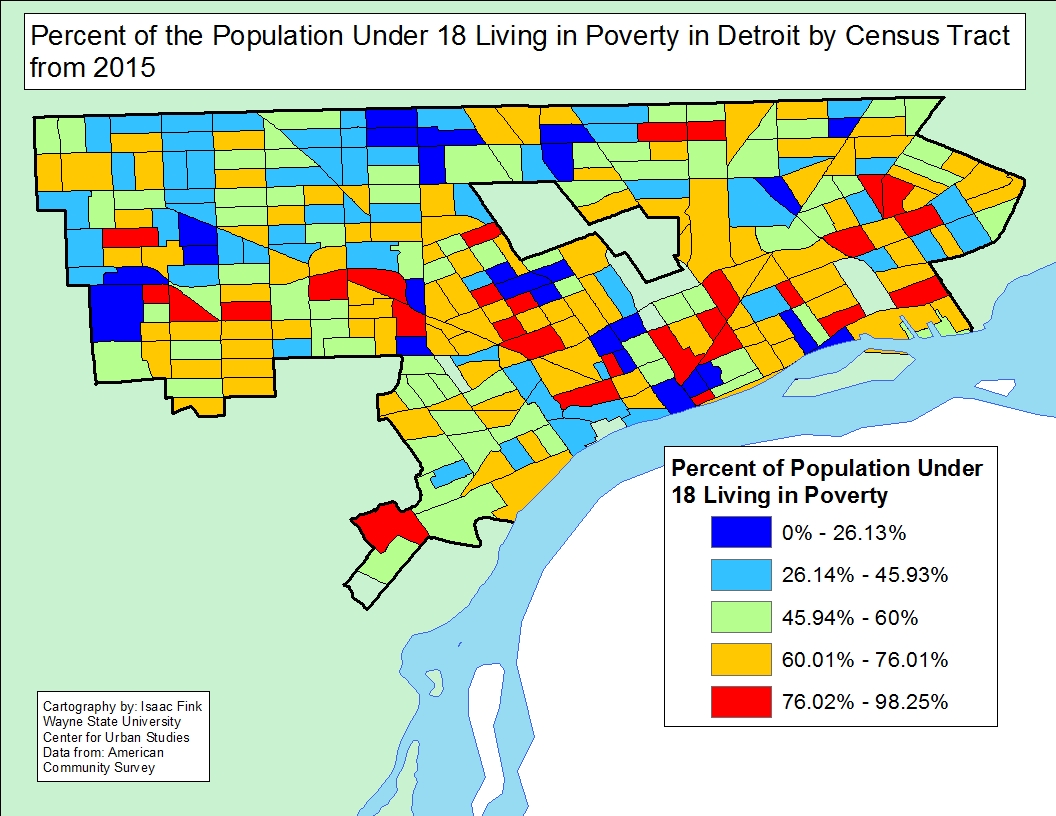
In 2015, there were 29 Census tracts where between 76 and 98 percent of children were living in poverty. Of these Census tracts, 14 were located east of Hamtramck, with four located along Gratiot Avenue (the southern portion). On the western side of the City of Detroit, there were five Census tracts with between 76 and 98 percent of children were living in poverty along Grand River Avenue. Also, there were seven Census tracts with between 76 and 98 percent of children living in poverty west of Livernois Avenue.

2010

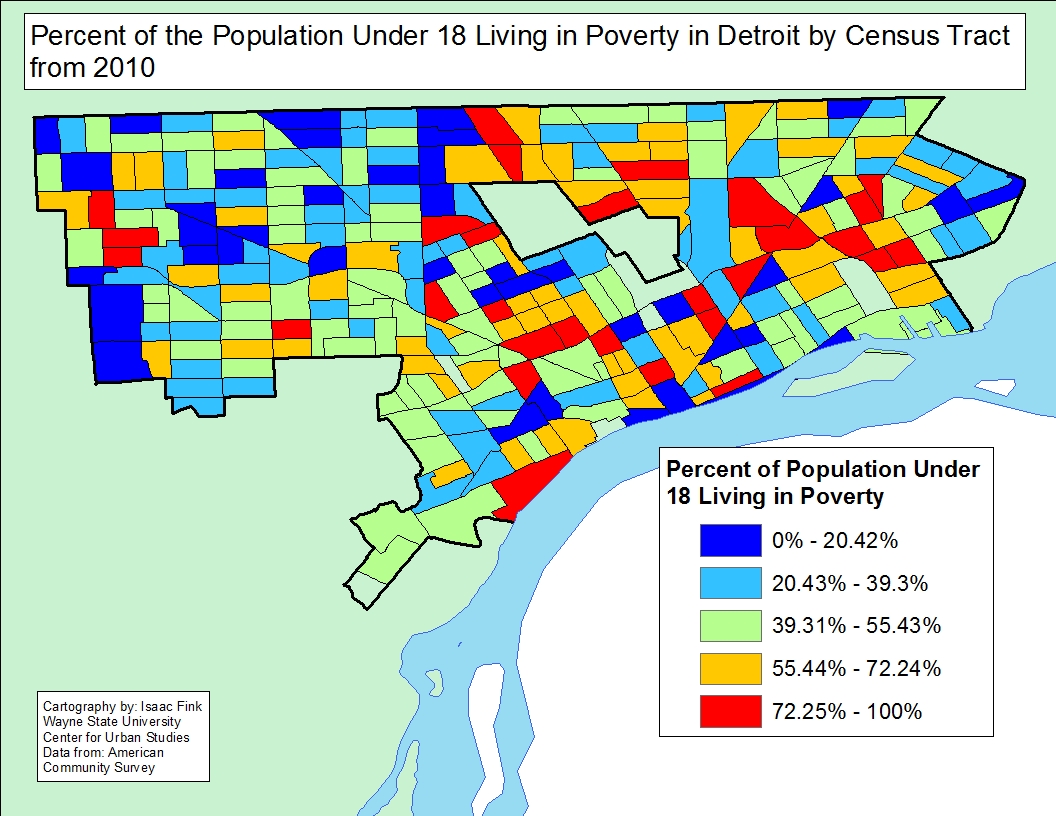
In 2010 the percentage of children living in poverty in Detroit was 47 percent. The majority of the Census tracts west of Livernois Avenue had less than 56 percent of children living in poverty. There were 29 Census tracts where more than 72 percent of children were living in poverty and 25 of those were located east of Livernois Avenue.

2000

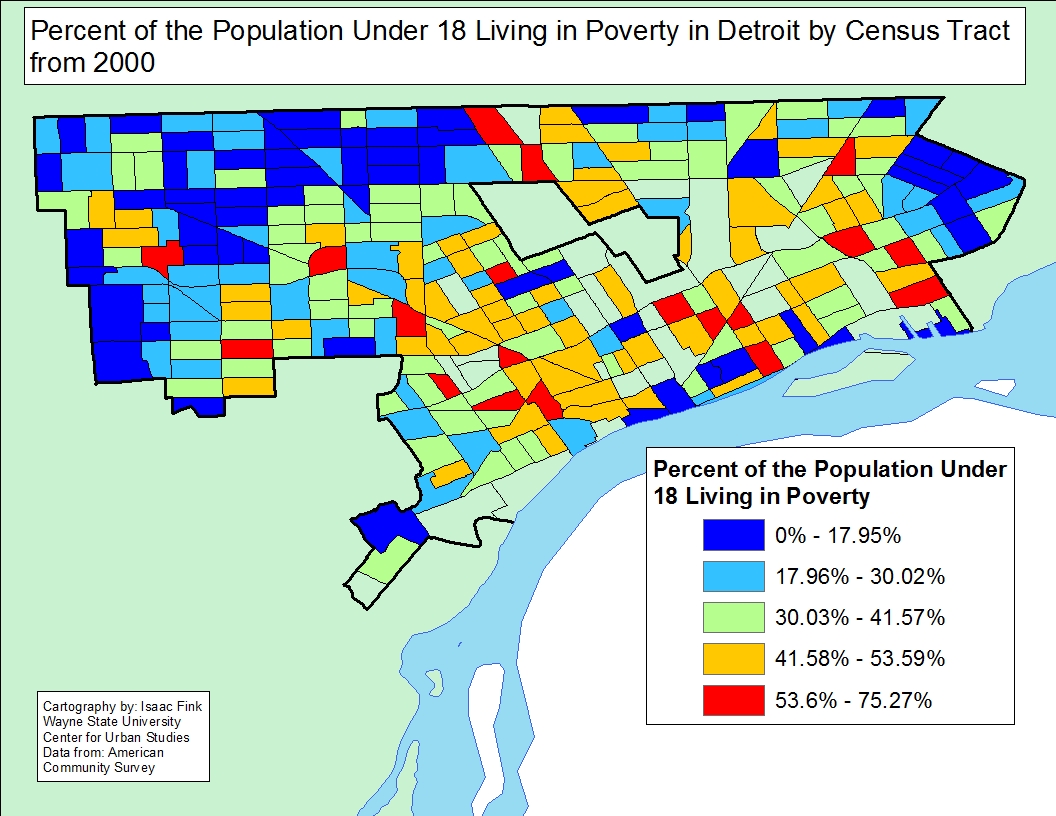
In 2000, 34 percent of children were living in poverty; this was the lowest percentage among the three years being compared in this post. A look at the map shows that majority of the Census tracts on the west side of the City had less than 31 percent of children living in poverty. Just west of Livernois Avenue is where majority of the Census tracts with more than 42 percent of children living in poverty were located. In total, there were 19 Census tracts where 53 percent or more of children lived in poverty in 2000.

Child Poverty Percent Change 2000-15

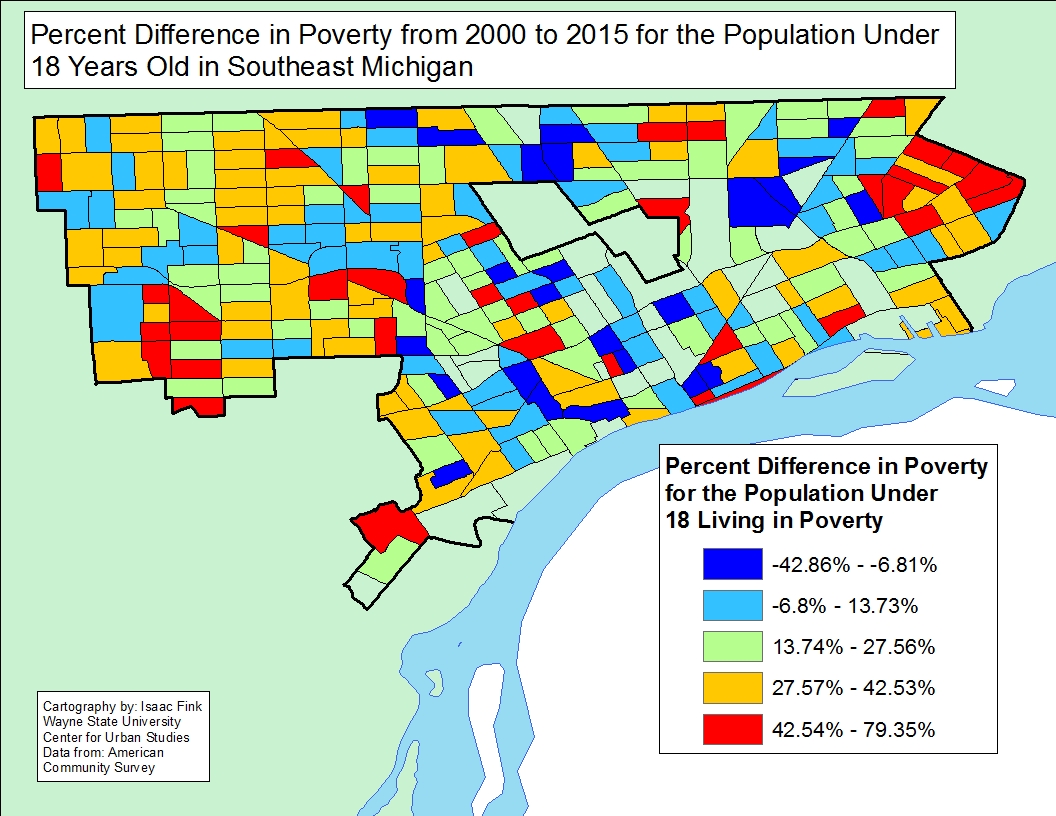
Between 2000 and 2015 there was a 23 percent increase in the percentage of children living in poverty in Detroit. A large part of that increase came from 36 Census tracts where there were percentage increases between 43 and 79 percent of children living in poverty. A handful of these Census tracts were located along Grand River Avenue. One of those Census tracts was the same as one of the 2015 Census tracts with the highest percentage of children living in poverty. In addition to large percentage increases in areas along the Grand River and Gratiot corridors, there were also two clusters of Census tracts in Detroit where there were increases between 43 and 79 percent of children living in poverty. One cluster was in the eastern portion of the City in the Denby neighborhood area, and the other was in the eastern portion of the City in the Brightmoor/Cody area. While majority of the Census tracts in the City experienced percentage increases in the percent of children living in poverty between 2000 and 2015, there were a number of Census tracts that experienced percentage decreases. While there weren’t large clusters experiencing such decreases, many of these Census tracts were located in the central area of Detroit.

Child Poverty Percent Change 2010-15

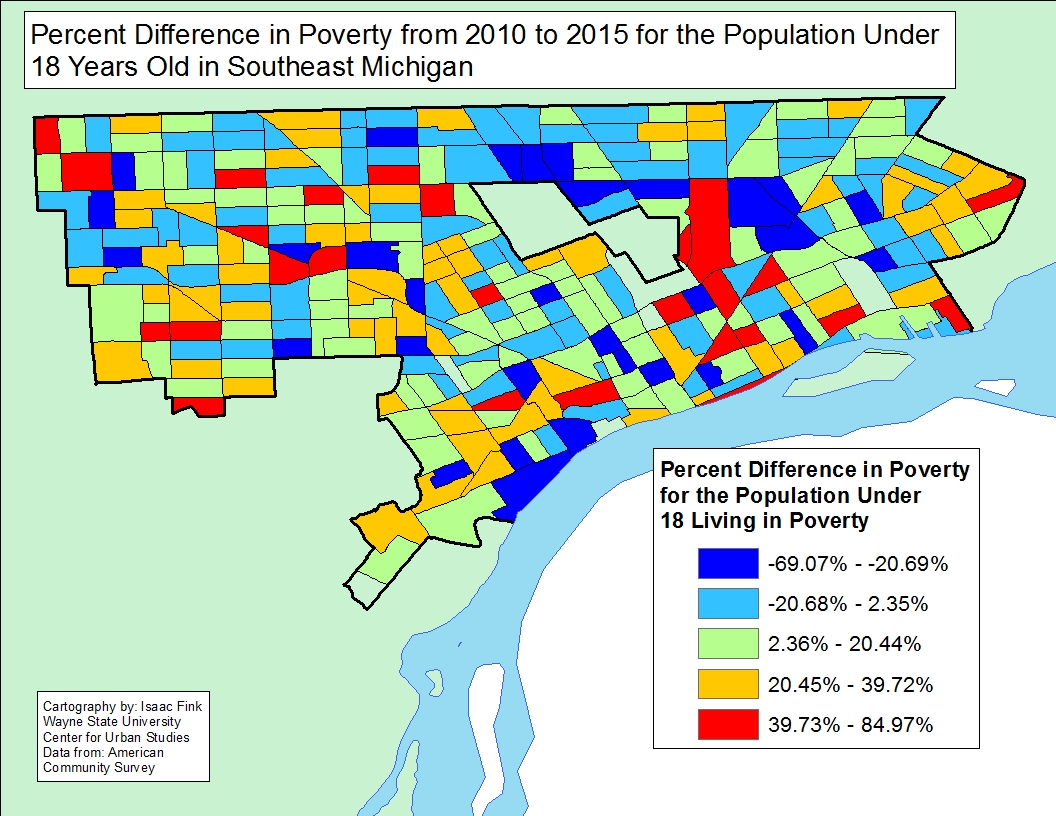
Between 2010 and 2015 there was a 10 percent increase in the percentage of children living in poverty. The map shows there were fewer Census tracts that experienced the highest tier of percentage increases for children living in poverty for the 2010-15 time frame than the 2000-15 time frame. In total, there

were 26 Census tracts where there was between a 40 and 85 percent increase in the percentage of children living in poverty in Detroit. Of these Census tracts, four were located along Grand River Avenue and another three were located along Gratiot Avenue.. On the opposite side of the spectrum, there were about 30 Census tracts with decreases between 21 and 69 percent in the percentage of children living in poverty. There were about 10 more Census tracts in the 2010-15 time frame than the 2000-15 time that experienced the highest tier in percentage decreases in the percentage of children living in poverty.

This deep dive into the percentage of children living in poverty in Detroit in 2015, and how those percentages have changed since 2000 and 2010, shows that poverty in the City is increasing across most neighborhoods, though the pace and breadth of increases has slowed since 2010. Our previous posts show that regionally childhood poverty is increasing at a faster rate than overall poverty levels, and Detroit is no exception to this. In our last post we suggested the need for job development and training in Detroit neighborhoods to allow individuals-particularly young adults-to have greater opportunities to participate in the labor force. Such opportunities for Detroit residents would also be an avenue to decrease the rate of childhood poverty.

Poverty, Unemployment Rates Higher for Young Adults in Detroit than City’s Overall Rates

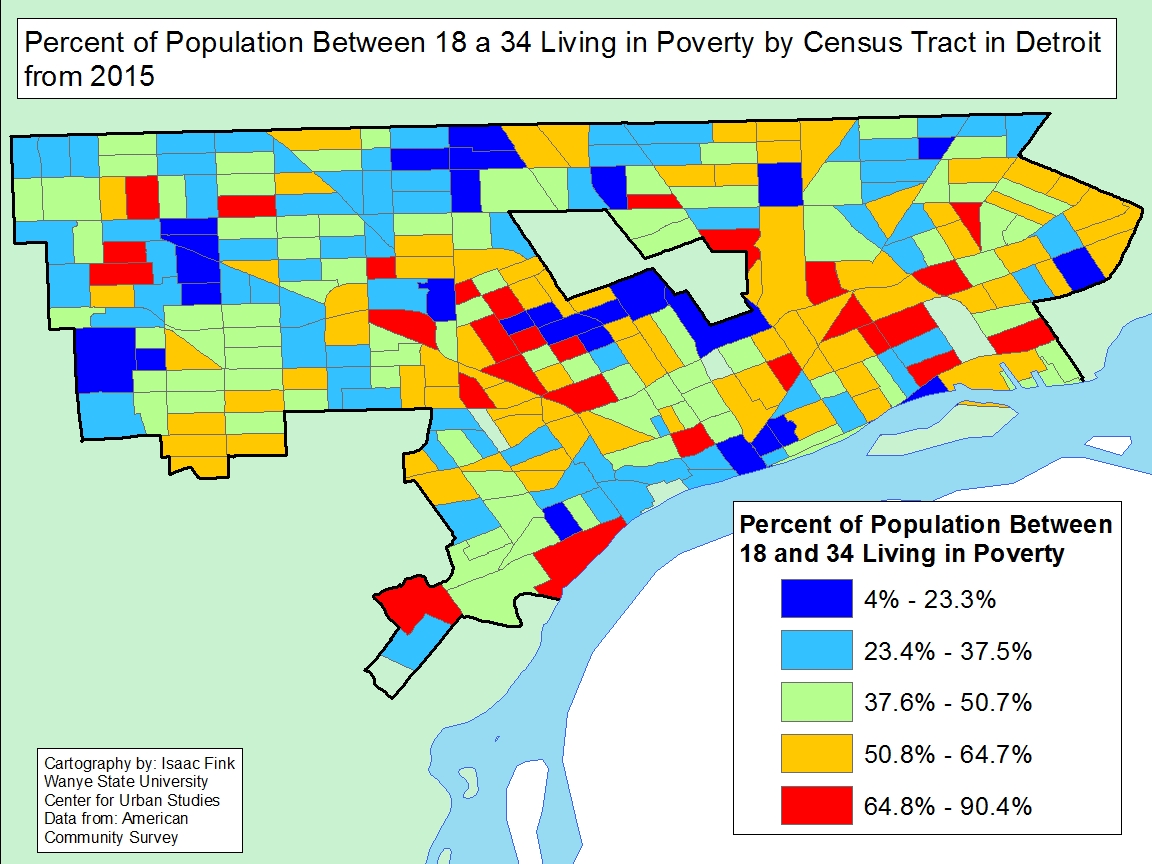
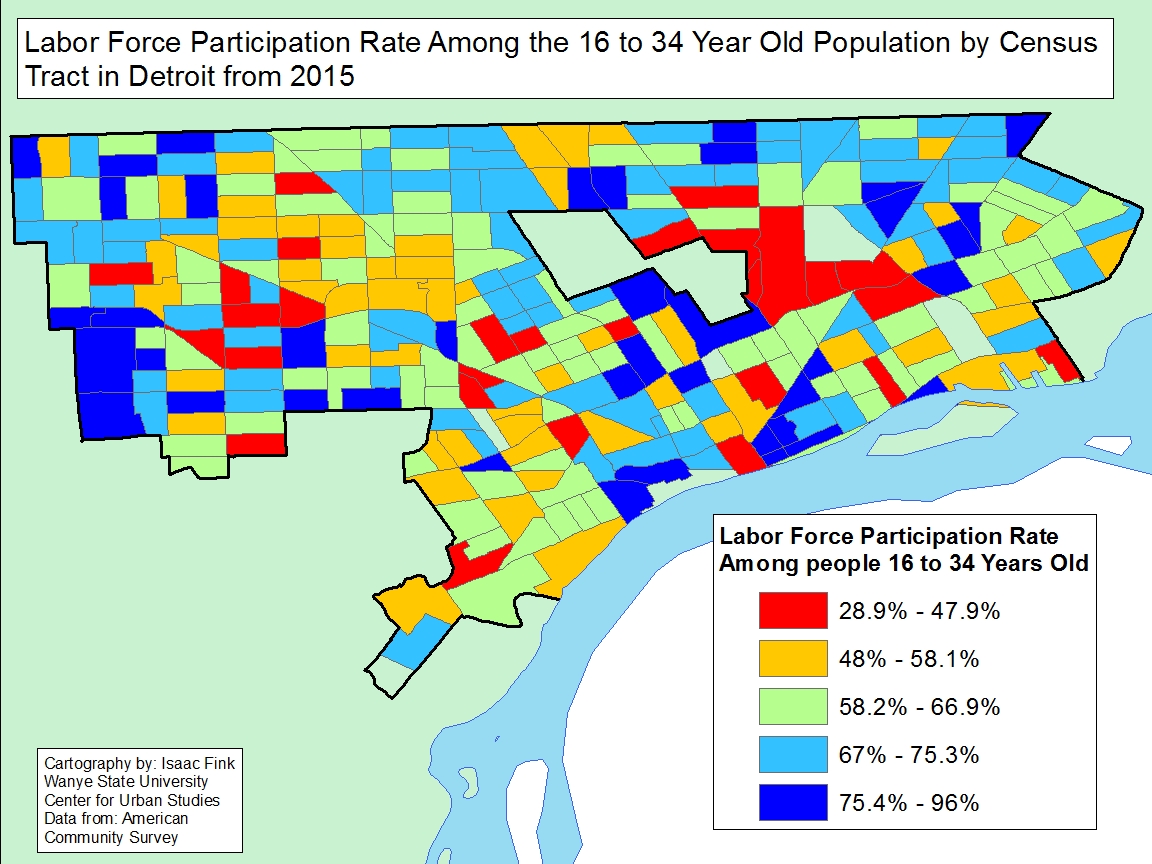
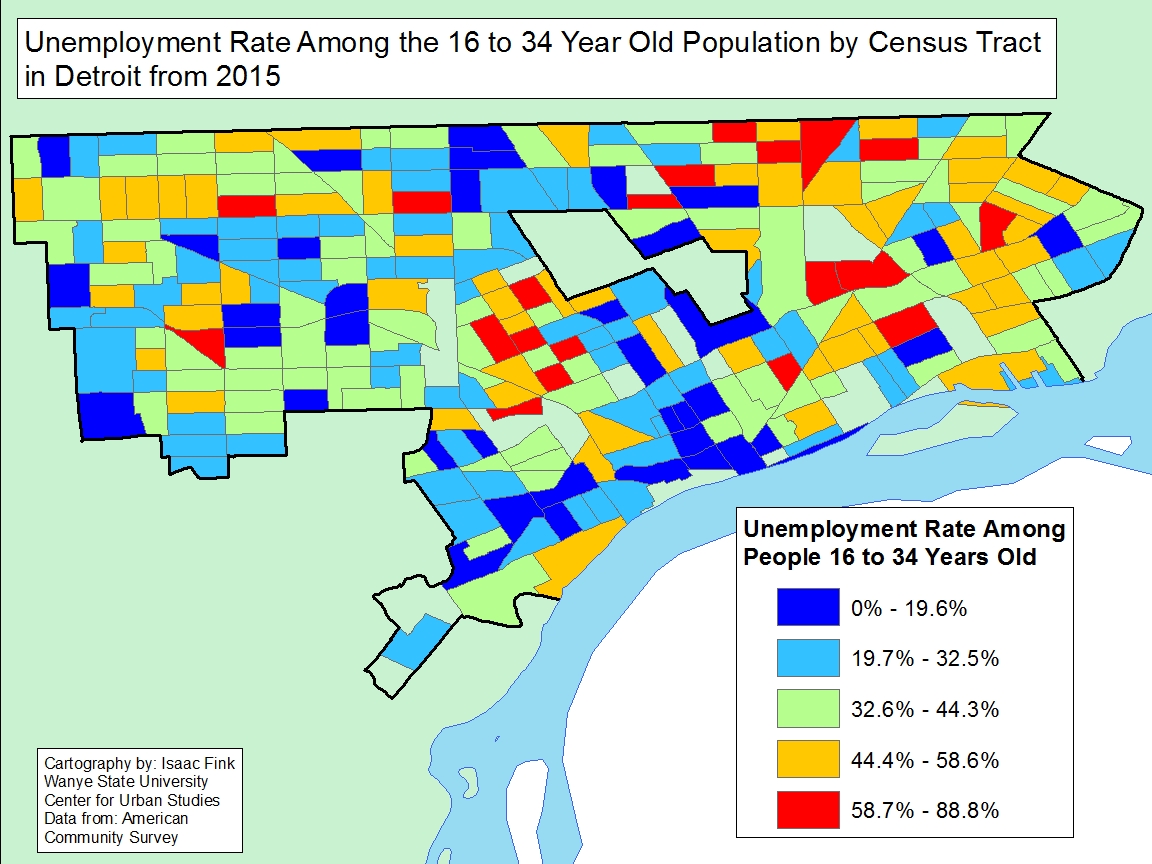
In the City of Detroit the percentage of young adults (categorized as 16 to 34-year-olds in this post) living at or below the poverty level in 2015 was 42 percent, with the labor force participation rate for that same age group being 64 percent and the unemployment rate being 35 percent. Two out of three of these rates were above those for the City of Detroit overall. In 2015 the percent of all Detroit residents (including children) living below the poverty level was 40 percent, the labor force participation rate was 63 percent and the unemployment rate was 13.2 percent.

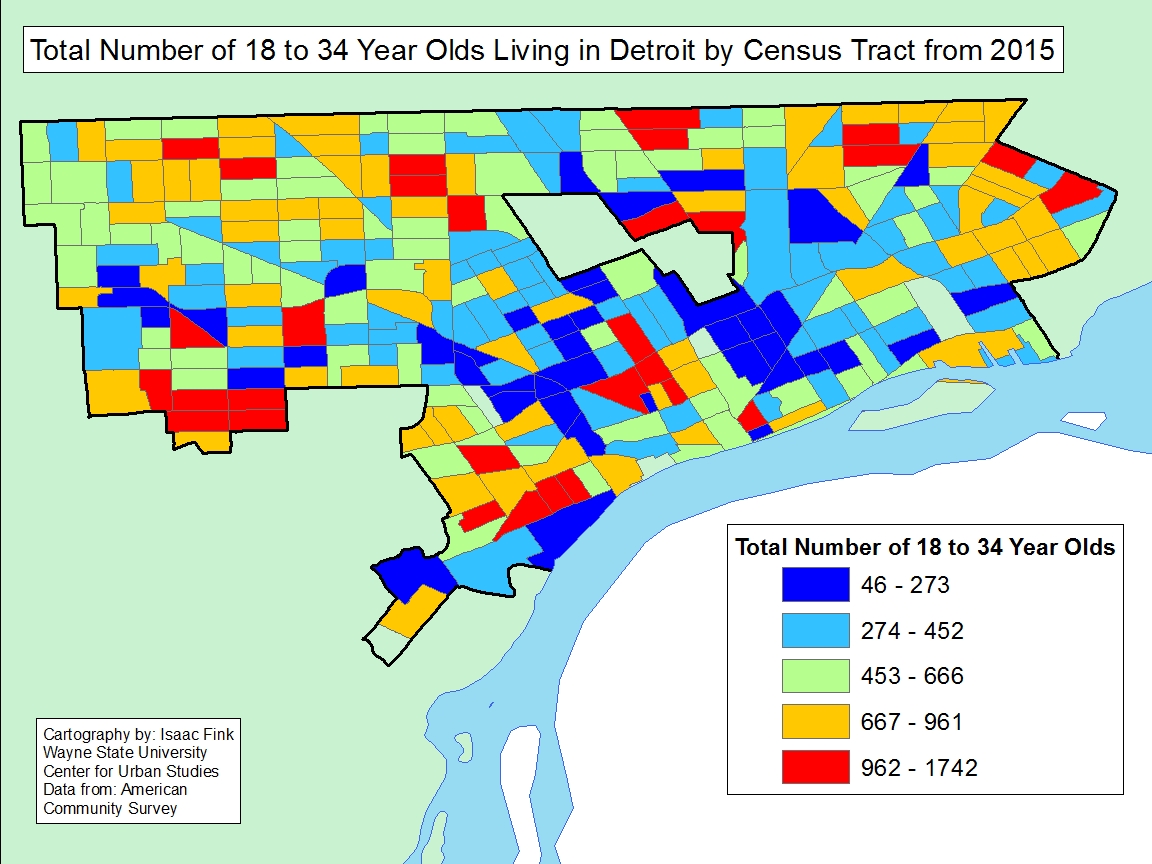
While the trend for these above mentioned rates for the young adult population was to be above the overall rates for the City, a deeper look at the rates showed they varied across Census Tracts in the City. For example, Census Tracts with the highest percentage of young adults living in poverty were along Grand River on the West Side and along Gratiot on the east side of the City. On the east side of the City, majority of the Census Tracts had between 50 and 90 percent of young adults living at or below the poverty level. Fortunately some of these same Census Tracts had among the lowest populations of young adults living there, with several having between 46 and 452 young adult residents residing in each Census Tract.

In the northeastern portion of the City, there were about a dozen Census Tracts with among the highest number of young adults living there, with numbers ranging between 667 and 1,742. These Census Tracts also had some of the highest labor force participation rates, as did a pocket in the western portion of the City of Detroit, along with several other pockets throughout the City. The tracts with the low labor force participation rates (29-48 percent) were frequently the same ones that had the highest percentage of young adults living at or below the poverty level; these Census Tracts are just east of Hamtramck. An individual is considered part of the labor force if they have a job or are actively seeking one. The labor force participation rate is the percentage of adults who are members of the labor force.

Two of these Census Tracts just east of Hamtramck also had among the highest unemployment rates for young adults, ranging between 59 and 89 percent. Overall in the City there were only 20 Census Tracts where between 59 and 89 percent of young adults were unemployed. Again, some of the tracts arrayed along Grand River on the west and Gratiot on the east had very high unemployment rates.

There are some tracts where high poverty, labor participation and unemployment rates overlap, but this is not the case for a majority of the Census tracts. At the same time the data tend to indicate a larger percentage of young adults are unemployed and, thus, living in poverty than the overall Detroit population. Clearly, getting more young adults employed must be a very high priority, and given that the national rate of unemployment is approaching 4 percent, there should be opportunities to connect these young adults to the labor market. Clearly it should be a priority to target job development and training programs to areas near Central High School along Grand River, as well as along Gratiot and in the Osborn and Demby areas.

Infant Mortality Rate Highest in Wayne County

In Southeastern Michigan, Wayne County had the highest infant mortality rate in 2016 at 8.3 deaths per 1,000 births, according to data from the Michigan Department of Health and Human Services. Of the 23,146 births in Wayne County in 2016 there were 192 deaths. St. Clair and Washtenaw counties had the second highest rates in the region, each at 5.7 deaths per 1,000 births. In St Clair County there were nine infant deaths out of the 1,591 births in 2016 and in Washtenaw County there were 21 infant deaths of the reported 3,695 births that year. Of the seven counties Livingston County had the lowest infant mortality rate. According to the data, there were four infant deaths in Livingston County in 2016 of the reported 1,783 births.

The Michigan Department of Health and Human Services data shows that every other county in Southeastern Michigan, with the exception of Washtenaw County, also experienced a decline in its infant mortality rate between 2015 and 2016. For Washtenaw County the infant mortality rate for 2016 was reported at 5.7 deaths per 1,000 births and for 2015 it was 3.8 deaths per 1,000 births.


Historical data from the Michigan Department of Health and Human Services shows the 2016 infant mortality rate of 8.3 for Wayne County is the lowest it has been since at least 1989. Data from the department shows that in 2015 the infant death rate in Wayne County was 9.5, in 2014 it was 9.3 and in 2013 it was 9.1. These rates, aside from the 2016 rate, were also the lowest reported rates for Wayne County since at least 1989.


According to an August Detroit News article infant mortality rates have declined in Detroit. The article discusses how research correlates higher rates of infant death to disparities such as poverty, access to food and lack of access to education, transportation and health care. In 2016 the infant mortality rate for Detroit was reported at 13.1 per 1,000 infants and in 2015 it was reported at 14.4. The infant mortality rate for the state of Michigan in 2016 was 6.8 deaths per 1,000 births.


While data shows that infant death rates are decreasing in Southeastern Michigan there are still concerns over pregnancy related maternal death rates in Michigan. Drawing Detroit is working with the Michigan Department of Health and Human Services to obtain this data to examine how rates have changed over recent years.


Distribution of Public Assistance Benefits Often Overlaps in Detroit

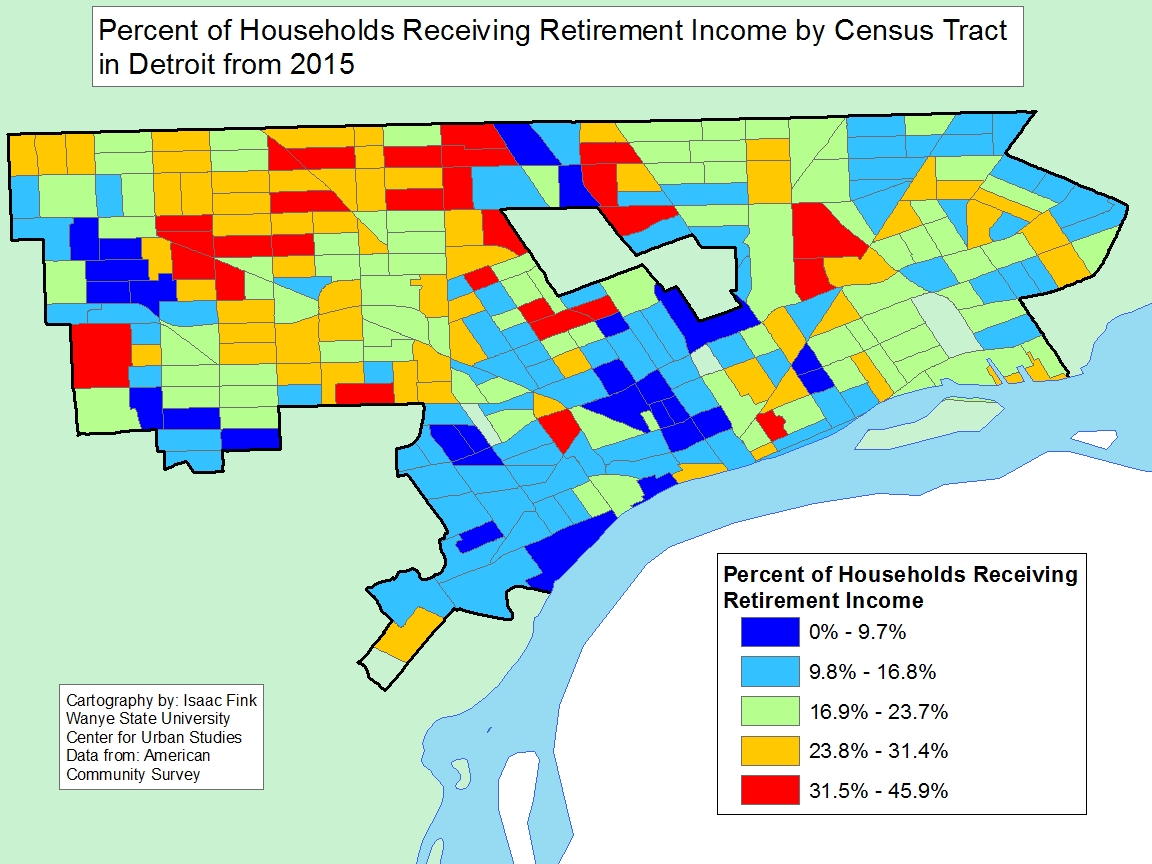
In examining Census data from 2015 we see that households throughout Detroit receive various forms of public assistance, in addition to incomes such as retirement, social security, and/or supplemental social security. The data presented in this post shows that, often, Census tracts with a higher percentage of households that received a retirement income had lower percentages of households that received public cash assistance and/or food stamps.

When examining the retirement income map the data shows that the Census tracts with the highest percentage of households that received retirement income were in the northern and western portions of the City. In addition, there was a handful of Census tracts east of Woodward Avenue with upwards of 34 percent of households earning a retirement income. Conversely, there were more than 80 Census tracts, primarily located southwest of Highland Park and Hamtramck, where less than 17 percent of the households receive a retirement income.

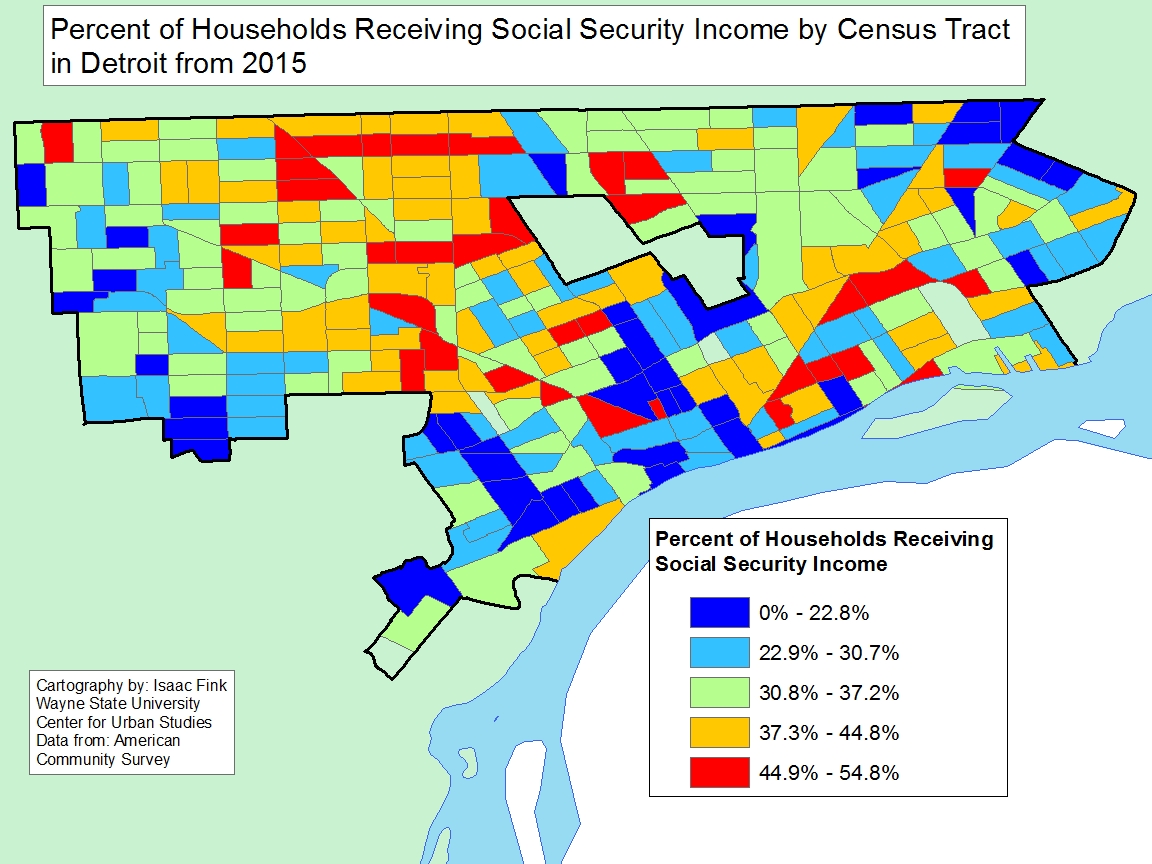
There were 29 Census tracts in Detroit where 44.9 percent or more of households relied on Social Security as part of their income and, on the opposite side of the spectrum there were about 40 Census tracts where 22.9 percent of those households, or less, relied on Social Security as part of their income. There was often an overlap in Census tracts with the highest percentages of households receiving retirement income and the highest share of households on on Social Security. But, there were differences across these maps as well. For example, many parts of Southwest and Midtown had both large percentages of residents receiving both retirement income and Social Security.

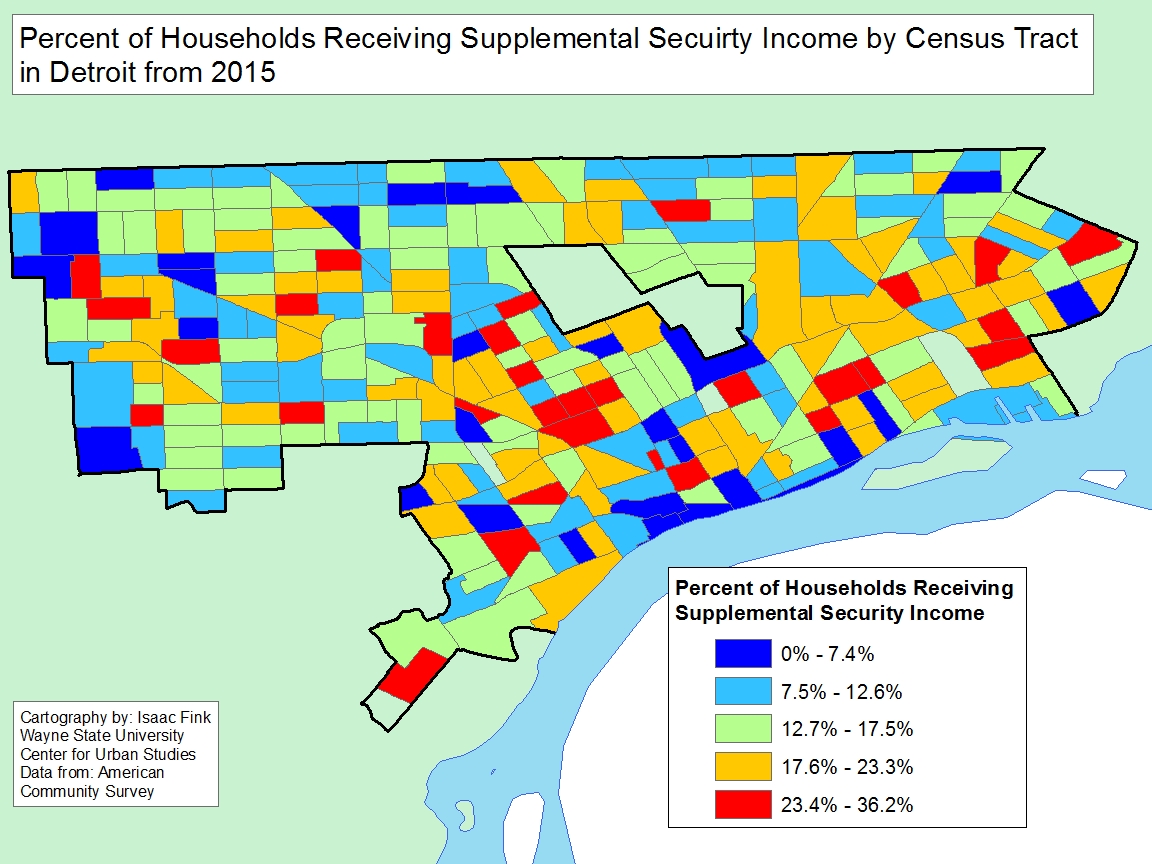
There was less of an overlap on Census tracts with the highest percentage of households receiving Social Security and tracts where many residents received Supplement Social Security benefits. In order to be eligible for Supplemental Social Security an individual must be: age 65 or older, blind or disabled and have a limited income and resources. Additionally, there was an overall higher percentage of households receiving Social Security benefits than Supplemental Social Security benefits. The Census tract with the highest percentage of households receiving Supplemental Social Security had 36.2 percent of households receiving Supplemental Social Security, while the highest tract for Social Security was  54.8.

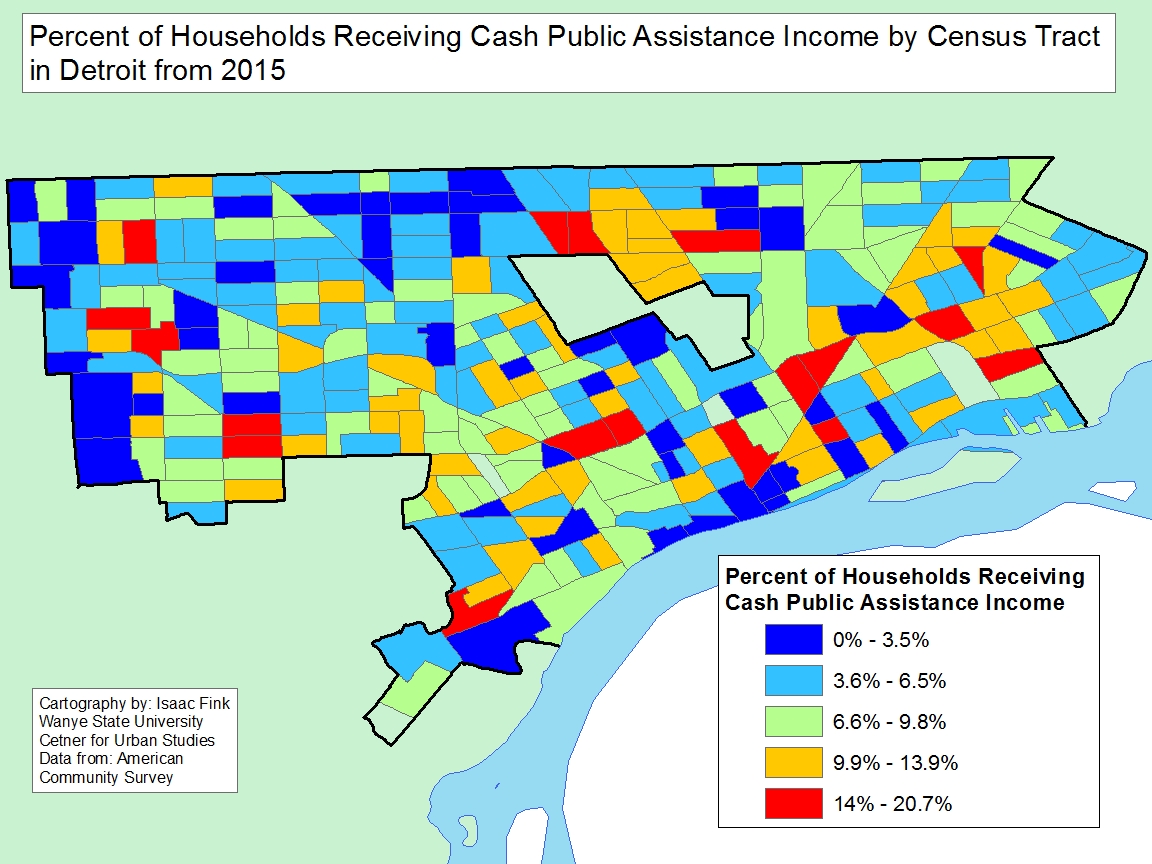
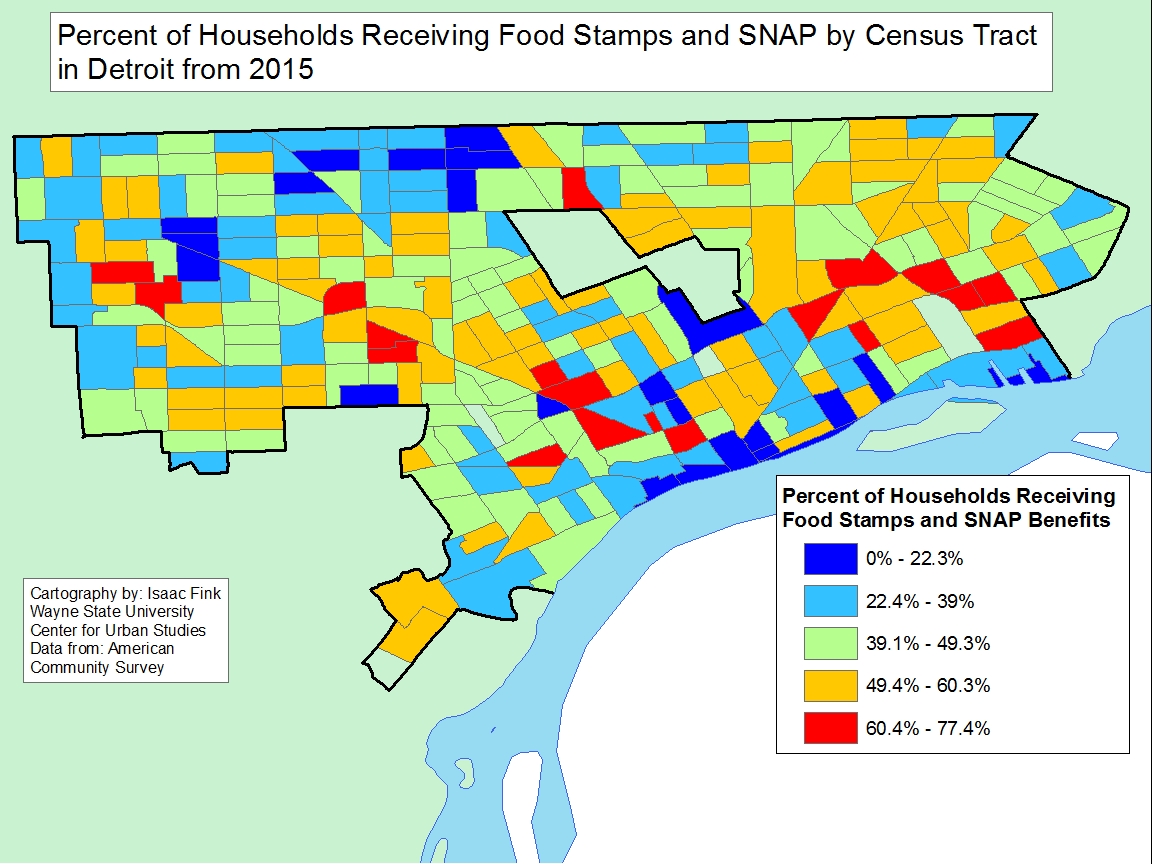
The areas in which there was the overlap for the highest percentages of households receiving a certain income or benefit was in the Census tracts where for households receiving public cash assistance and food stamps. For example, there was a cluster of Census tracts along and to the east of Gratiot where up to 20.7 percent of households received cash assistance and up to 77.4 percent of households received food stamps. The data indicate that in 19 tracts between 60.4 and 77.4 percent of the households receive food stamps, and in over 80 tracts between 49.4 and 60.3 percent of residents receive food stamps. To be eligible for food stamps a family of four cannot earn more than $31,240 a year. In order to be eligible for public cash assistance an individual must have a child, have under $3,000 in cash assets and under $25,000 in property assets. The thresholds that households must meet to receive both types of these forms of government assistance, showcases how, particularly in the red colored Census tracts, incomes are among the lowest.

Overall, this post highlights how households in the City of Detroit rely on various forms of benefits and incomes. Clearly there are many retired households living on either retirement income or social security. These households are often, though not always in the same general neighborhoods. People that rely on food stamps and public assistance sometimes overlap with these neighborhoods, but they often concentrate in other areas. There are also areas—often including Downtown,  Midtown, East Jefferson and the far west neighborhoods–where far fewer households rely on any form of retirement income or public benefits.