The Motor City and Automotive Industry still dictate state’s export economy

The Southeast Michigan region was the fifth largest export market in the United States in 2013 according to U.S. Census Bureau Statistics, with more than $53.9 billion in exports. In the same year, the state of Michigan reported $58.7 billion in exports, making the region (which includes Lapeer County in the Southeast Michigan) responsible for 91.8 percent of the state’s export economy. This post explores the role of exports in the regional economy and examines how trade connects the region to the world economy.
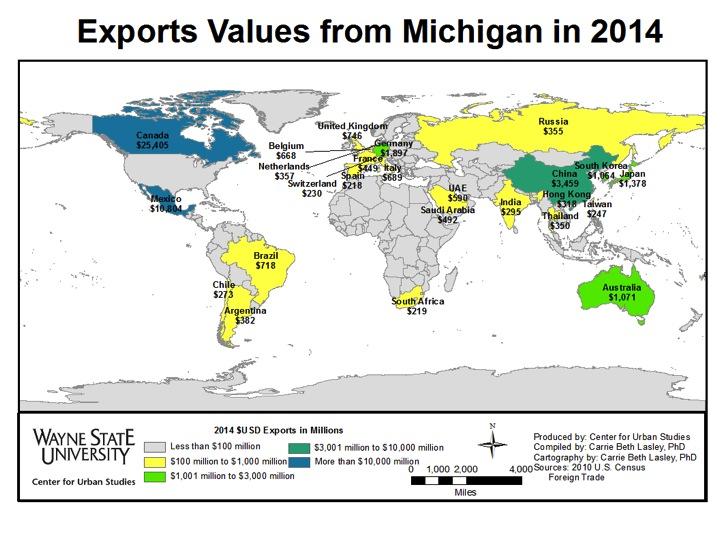
The map above shows the top 25 export recipients receiving goods originating in Michigan in 2014. In 2014, Michigan exports accounted for 3.4 percent of the national export total, by value. Among the top 25 export recipients are countries on six of seven continents. The strongest partnership is with neighboring Canada at more than $25,405 million. Fellow North American Free Trade Agreement (NAFTA) partner Mexico follows Canada, but is well behind at $10,804 million.

Export statistics support Michigan’s case as a leader in automotive manufacturing, and this is driven by Detroit. Of the top 25 products being exported, 21 were automotive parts or vehicles; they comprised 45.4 percent of all exports from the state of Michigan in 2014, and grew by 2.9 percent, on average, between 2013 and 2014. Exported products that were not directly related to the automotive industry were aircraft parts, natural gas, iron ore and medicines. These products represented just 6.6 percent of all exports, by value, and saw an average growth of just 2.7 percent from 2013 to 2014.

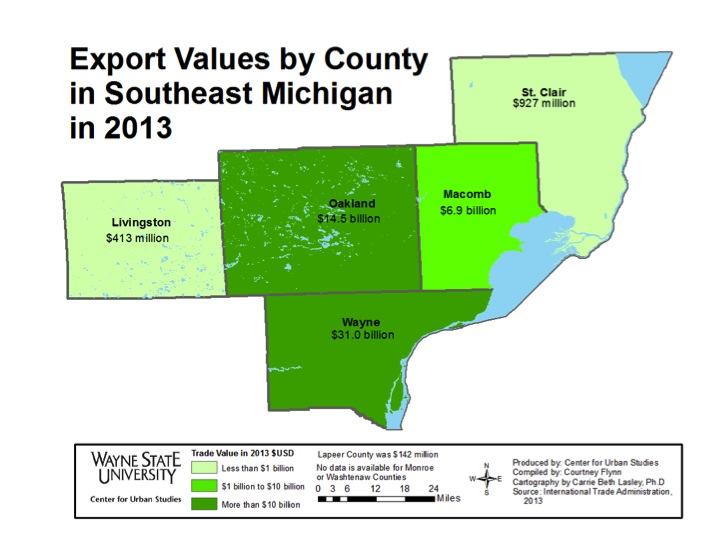
In 2013 Wayne County produced the lion’s share of exports by value in the region ($31 billion), more than double the second-highest exporting county (Oakland at $14.5 billion), according to the International Trade Administration (ITA), a division of the U.S. Department of Commerce, using Census data from 2013.

The ITA also indicates that exports were not predominantly the Big 3 automakers exporting finished products, but small producers of automotive parts. In 2011, 7,215 different businesses exported out of metropolitan region, with 90 percent of exports coming from firms employing fewer than 500 employees, according to the ITA.
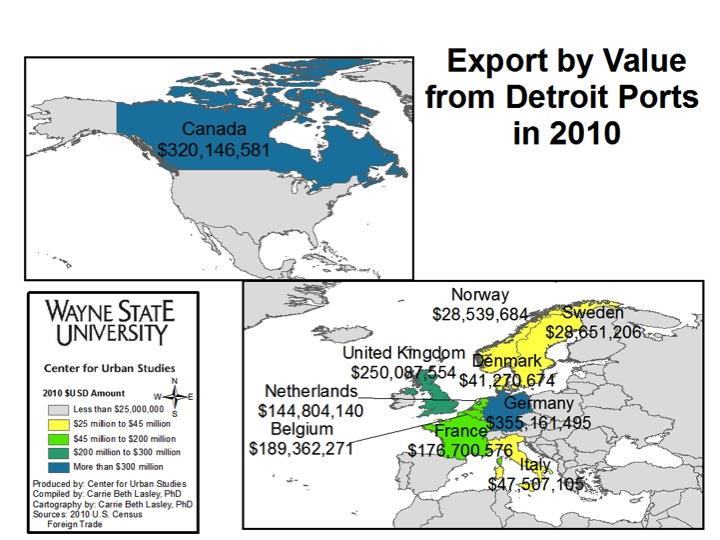
The next two maps look specifically at the Ports of Detroit (this includes two ports, Detroit Metropolitan Airport and the Port of Detroit – a container port). These maps show export partners by value and by weight for 2010, the last year for which the Census Bureau has port-specific data publicly available. When examined by value, Detroit sent a great deal of export value in 2014 ($USD) to Canada and Western Europe. No country outside these two regions received more than $25 million in exports from Detroit. Nations with robust automotive industries of their own – Germany, the United Kingdom and France – are among some of the largest recipients of Detroit products.
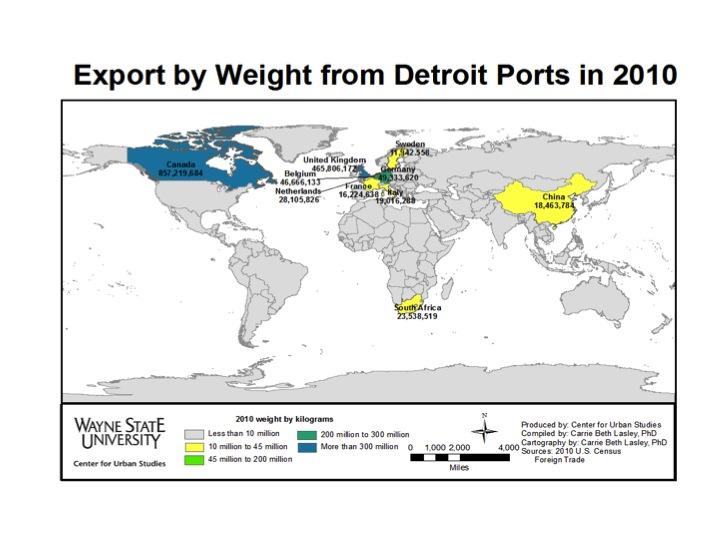
When examined by weight, a more broad trade geography emerges. Including this measure allows us to see more clearly where finished vehicles and iron ores are going. While Canada, Germany and the United Kingdom still lead among export recipients when considered by weight, South Africa and China emerge as significant trade partners.

The ITA indicates that since 2010 Michigan has seen a noteworthy increase in trade (by value) with Mexico, Saudi Arabia, China and the United Arab Emirates, which have overtaken many of the European nations to join Canada among the top five recipients of Detroit-area exports.


Manufacturing jobs decentralized from Detroit

In this post, we look at the data on manufacturing employment in the seven county region to see the variation in manufacturing jobs are throughout the Metro-Detroit Region. One thing that stands out is the lack of manufacturing trade-based jobs in Detroit in 2012.

In the map above we see that for every hundred people that lived in Detroit in 2012 there were only 2.5 manufacturing jobs.

By 2012 manufacturing jobs were decentralized from outside the city in Livingston County, which had the highest number of manufacturing jobs per person at 10 per 100 people. By contrast within Wayne County there were only 4.4 manufacturing jobs per 100 people. Both Macomb County and St. Clair County rank above that.

The GM Tech Center, TACOM (a U.S. Army manufacturing plant that makes items such as tanks for soldiers), and manufacturing plants for all of the Big Three, along with their suppliers are located in Warren in Macomb County. According to Crain’s Detroit, General Motors, Chrysler, and Ford are three of Macomb County’s largest employers. Also in that list is the U.S. government, which would include TACOM

The county with the lowest number of manufacturing jobs per 100 people was Washtenaw County; there were 3.5 manufacturing jobs per 100 people in 2012.

Where the previous map examined the manufacturing jobs per 100 people, this looks at the absolute number of manufacturing jobs in each municipality. It presents a very different perspective. We see, from this perspective, that Detroit was one of a few places in the region with more than 5,000 manufacturing jobs in 2012.

However, Detroit is not home to a majority of the manufacturing jobs in existence in the region. Most of the manufacturing plants of the Big Three are located outside of the City of Detroit. For example, Ford only has one manufacturing plant in Detroit, but has 12 in the Metro-Detroit suburbs. This is part of the reason we see the manufacturing hot spots such as Livonia, Wayne and Dearborn.

With GM, in addition to its headquarters being located in Detroit, there is one manufacturing plant that is located within the City and 12 in the suburbs, according to the GM website. For Chrysler, the ratio is much more equal; there are four Chrysler plants located in Detroit and five in the suburbs, according to the Chrysler website.

Detroit among several communities where more than 50 percent of children live below the poverty line

The message from the maps below is clear: the percentage of children living below the poverty line in 2013 in the city of Detroit was far greater than the majority of the other communities in the seven county region. At 55.1 percent, Detroit’s poverty rate was double that of the national rate (19.9 percent) and double or more of the rates of each county within the region.

The Census Bureau, which produced this data for the American Community Survey, uses a set of money income thresholds, as set by the Office of Management and Budget, which vary by family size and composition to determine what the poverty line is. The poverty line does not vary by geographic location but is respondent to inflation. Generally speaking, according to the U.S. Census Bureau, the annual poverty rate is “calculated using the sum of family income over the year divided by the sum of poverty thresholds that can change from month to month if one’s family composition changes.”

According to the Office of Management and Budget, the weighted poverty level in 2013 for a family of four was $23,834.

With Detroit having 55.1 percent of its children living below the poverty level in 2013, we also see that at the county level, Wayne County had the highest child poverty rate at 22.5 percent. While cities like Livonia, Canton, Plymouth and Woodhaven all had child poverty rates below 10 percent, there were some communities in Wayne County where levels were above Detroit’s. For example, Highland Park had the highest percentage of children living below the poverty line at 68 percent. Hamtramck’s percentage was also above Detroit’s at 62.1 percent, as was Inkster’s at 56.3 percent. The percentage of children living below the poverty level in River Rouge was just below Detroit at 50.1 percent.

Pontiac, which is in Oakland County, was the only other community within the region where more than 50 percent of its children were living below the poverty line. In 2013 in Pontiac, 54.3 percent of the children lived below the poverty line.

On the opposite end of the spectrum in Wayne County, there were communities such as Grosse Pointe (1%), Grosse Pointe Farms (1.8%), Grosse Ile (4.7 %), and Plymouth (5%) where 5 percent or less of the child population lived below the poverty line. In Oakland County, there were 11 communities where 5 percent or less of the children lived below the poverty line. These communities were: South Lyon (.2 percent), Royal Oak (5%), Rochester (5%), Orchard Lake (.7%), Novi (0%), Lake Angelus (0%), Huntington Woods (.3%), Bloomfield Hills (0%), Birmingham (3.1%), Berkley (4.8 percent), Sylvan Lake (0%).

Overall, Livingston County had the lowest percentage of children living below the poverty line at 7.4 percent. This was the only county where less than 10 percent of the children in a county lived below the poverty line. Oakland, Macomb, Washtenaw and Monroe counties all had less than 20 percent of their child populations living below the poverty level.

Although Detroit did not have the highest percent of children living below the poverty line in the seven county region, its rate did soar above the national and county averages. As seen in the map above, the majority of the census tracts within the city had 50 percent or more of its children living below the poverty line. Pockets of this poverty appear to be concentrated more so in the east side of the city, in Southwest Detroit, and near the Warrendale neighborhood on the west side. There were only seven census tracts within the city where 10 percent or less of the children were living below this poverty line. These areas include the downtown area, Indian Village, Arden Park, East Village, Midtown and Rosedale Park.

Property values increase throughout Wayne and neighboring counties

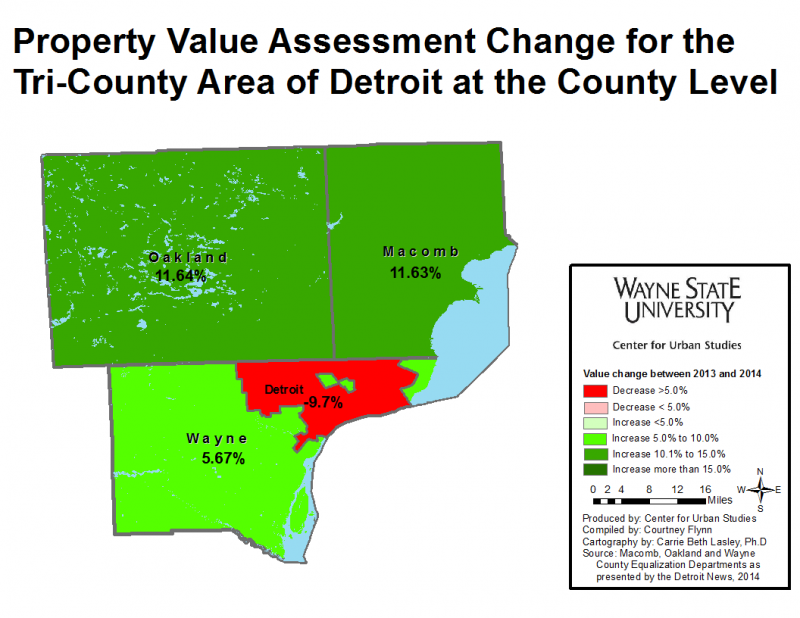
Preliminary numbers released by County Equalization Departments show that throughout Oakland, Macomb and Wayne counties property values increased between 2013 and 2014. According to state law, property assessments are equal to half a property’s market value. Overall, Oakland and Macomb counties saw assessed property values increase by upwards of 11 percent. In Wayne County though, overall assessed property values increased by about half that amount. The assessed property values in the city of Detroit decreased by 9.7 percent. The values are expected to be approved by the county legislative bodies in April.

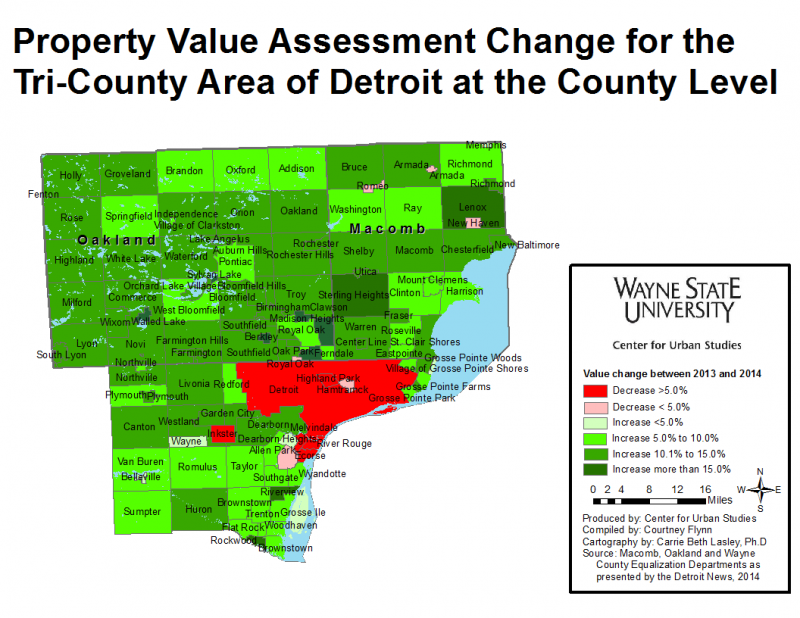
As seen in the first map, the tri-county region experienced an increase in assessed property values. In the second map, we are able to see what communities experienced higher increases than others. In Oakland County, Madison Heights experienced the largest percentage increase in assessed property values at 15.95 percent, while in Macomb County, Sterling Heights had the largest percentage increase at 15.29 percent. Riverview in Wayne County had the largest percentage increase in the tri-county area at 20.95 percent.


Wayne County, however, was also the only county in the area where certain communities experienced a decrease in their property assessment values. River Rouge in Wayne County experienced the largest decline at 26.65 percent. Other communities in the county that experienced property assessment value declines were Inkster, Hamtramck, Detroit and Lincoln Park.

Values for New Haven, Romeo and the Village of Armada, all in Macomb County, were not available.

Pontiac schools have lowest percentage of third-graders meeting state reading proficiency levels in 7-county region

Today kicks off “March is Reading Month” and with that comes a focus on the foundation that proficient reading skills can provide a person. A great deal of attention by educators and policymakers is often placed on third grade reading levels because experts believe a child’s ability to read at that time in their life can be a crucial indicator for their future success.

Additionally, in Michigan, Gov. Rick Snyder announced during his State of the State Address a $468 million proposal meant to increase reading proficiency in the State of Michigan. Part of this proposal includes a reading proficiency test for third-graders to better determine how their cumulative instruction has affected their reading skills, which would be separate than the Michigan Education Assessment Program (MEAP). However, the Governor has yet to release all the details behind this plan but in spring of this year we do know that the Michigan Test of Education Progress will replace the MEAP.

Currently in the State of Michigan, the Michigan Education Assessment Program (MEAP) is used to determine how students in grades three through 11 measure up to the educational expectations set by the State Board of Education. For all grade levels the state’s goal is to have 80 percent of all of Michigan’s third-graders reading at a proficient level, according to the State of Michigan.

With the extra attention currently being placed on reading proficiency in the State of Michigan, we chose to examine the percent of third and fourth-grade students who were deemed proficient on the MEAP reading exams in 2013-2014. The MEAP tests are given in the fall of every academic year, so we show both the third and fourth-grade reading proficiency percentages to provide readers a better understanding of where students’ reading skills, in accordance with state standardized testing levels, were at the beginning and end of third and fourth grade. On the state’s education website, mischooldata.org, fourth-grade reading MEAP scores are used on the dashboard for each school as a student outcome measure.

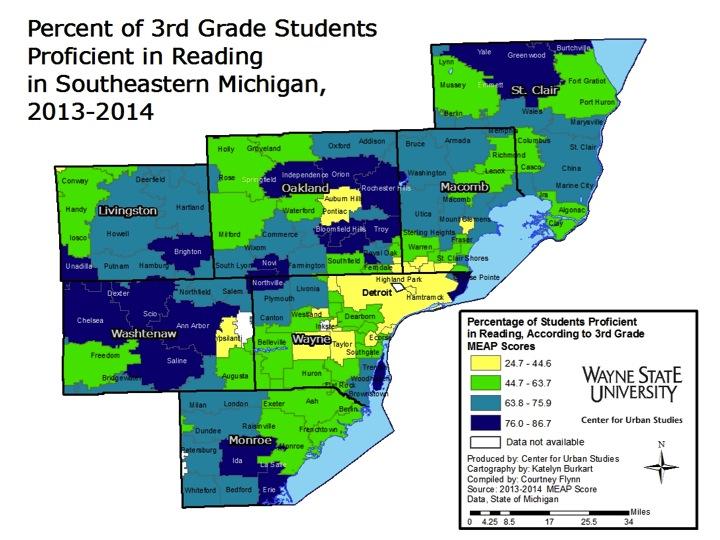
For the 2013-14 school year, 61.3 percent of Michigan’s third-graders were deemed proficient in reading. When looking at this map we see several pockets of school districts where third-graders either performed at this level or below. In total, there were 53 school districts where less than 61.3 percent of the third-grade students were deemed proficient in reading. According to the Michigan Department of Education proficiency levels for the 2013-14 MEAP exam are determined as follows: “the 2011-2012 proficiency rate for each school and district in every subject [is] subtracted from the end 85 percent proficiency target rate for the 2021-2022 school year. That number [is] then divided by ten (the number of years between the 2011-2012 and 2021-2022 school years) to determine the annual increment for the subject target rate. This increment is added to the 2011-2012 subject proficiency rate and then again each year leading up to the 2021-2022 school year.” The proficiency rate varies from district to district but the percent deemed proficient, which is shown in the maps in this post, presents the percentage of students we met these standards.

Pontiac School District in Oakland County had the lowest percentage of third-graders who met the proficiency standards at 25.7 percent. Detroit City School District had the eighth lowest percentage at 35.3 percent.

On the opposite end of the spectrum during the 2013-14 school year, Grosse Ile Township Schools had the highest percentage of third-graders deemed proficient on the reading portion of the MEAP; 86.7 percent of those students were considered proficient.

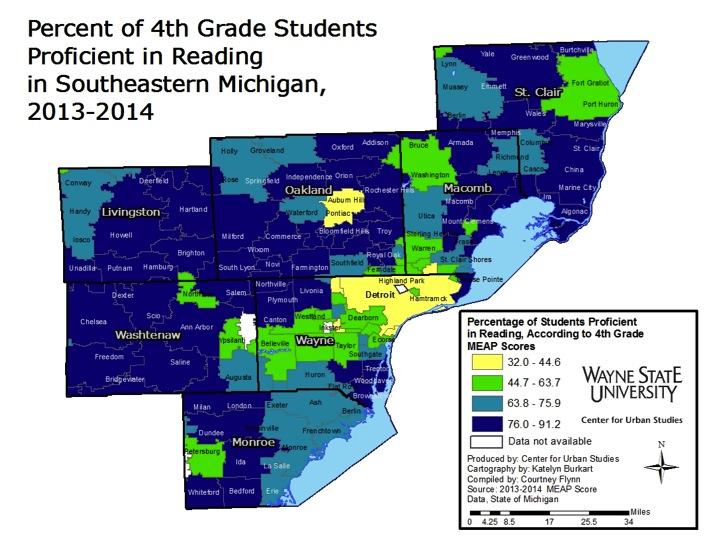
Seventy percent of Michigan fourth-graders were deemed proficient in the 2013-14 school year on the MEAP reading examination. In total, there were 49 school districts below the state’s proficiency level during the time frame examined.

Again, the Pontiac School District had the lowest percentage of students deemed proficient in reading in the region (32%). The Detroit City School District had the sixth lowest percentage of all the districts in the region, with 42 percent of its students meeting the proficiency level.

Northville Public Schools had the highest percentage of students who met the reading proficiency levels (91.2%). Grosse Ile Public Schools came in third in the region, with 90.3 percent of their fourth-graders meeting proficiency levels.