Macomb County leads in number of residential building permits obtained in October

  • From September 2014 to October 2014, the unemployment rate across the state and in the City of Detroit’s increased (monthly);
  • The Purchasing Manager’s Index for Southeast Michigan increased from October 2014 to November 2014 (monthly);
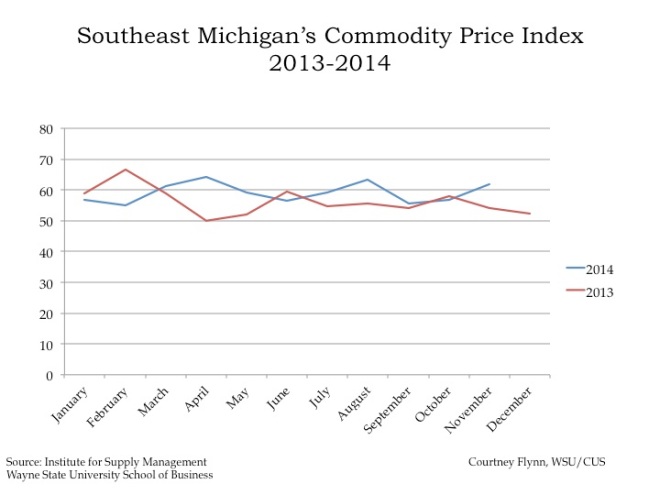
  • Commodity Price Index decreased from October 2014 to November 2014 for Southeast Michigan (monthly);
  • Macomb and Oakland counties experienced increased in the number of monthly building permits pulled; Wayne County experienced a decrease.
  • Standard and Poor’s Case-Shiller Home Price Index for the Detroit Metropolitan Statistical Area shows home prices have been decreasing since May.

Slide02

According to the most recent data provided by the Michigan Department of Technology, Management, and Budget, the unemployment rate for the state of Michigan increased from 6.7 percent in September to 7.1 percent in October. During this same period, unemployment in the City of Detroit increased from 14.9 to 15.1 percent. Detroit’s unemployment rate has been increasing since August 2014; at that time it was 14.6 percent.

Slide04

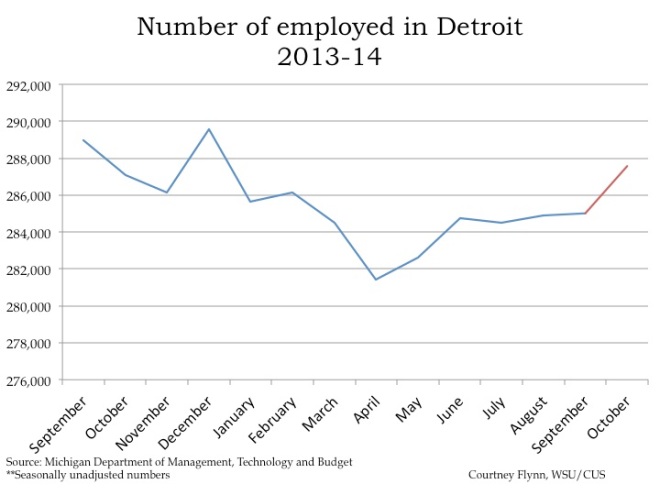
From September to October of 2014, the number of people employed in the City of Detroit increased by 2,557, leading to a total of 287,575 people employed in October.

Slide06

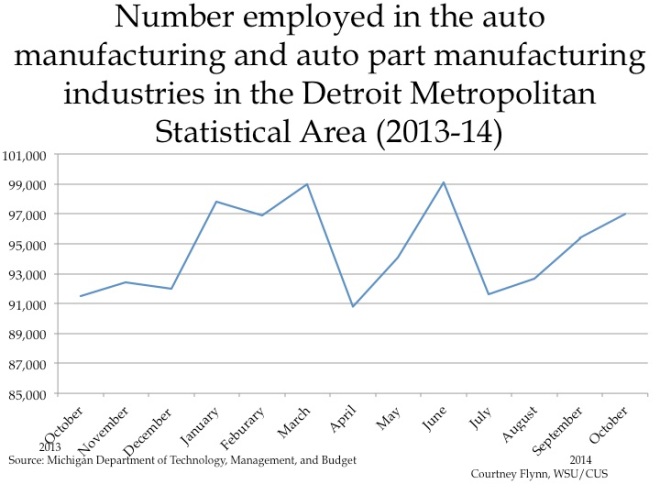
The above chart shows the number of people employed in the auto manufacturing industry in the Detroit Metropolitan Statistical Area (MSA) (Detroit-Warren-Livonia) from October 2013 to October 2014. Since July 2014, employment in this industry has increased by 5,400 to 97,000 in October 2014.

Slide08

The Purchasing Manger’s Index (PMI) is a composite index derived from five indicators of economic activity: new orders, production, employment, supplier deliveries, and inventories. A PMI above 50 means the economy is expanding.

According to the most recent data released on Southeast Michigan’s Purchasing Manager’s Index, the PMI for November was 56.8, an increase of 1.9 points from the prior month, but also a decrease of 1.5 points from this time last year.

Slide10

The Commodity Price Index, which is a weighted average of selected commodity prices, was recorded at 61.8 points in November, which was 7.4 points lower than the previous month and 7.4 points higher than a year ago.

Slide12Slide13Slide14

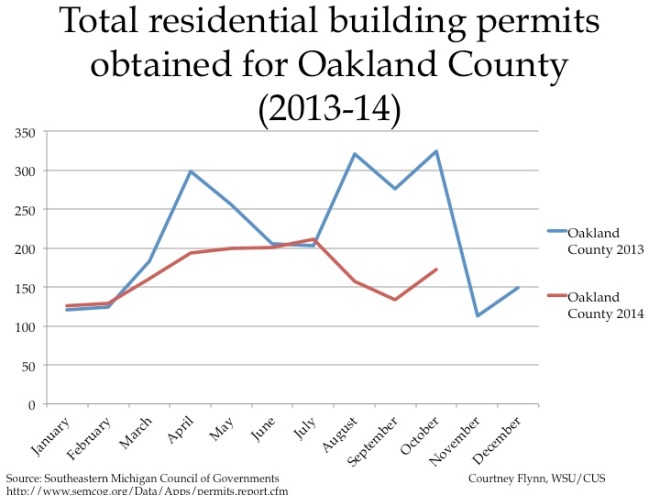
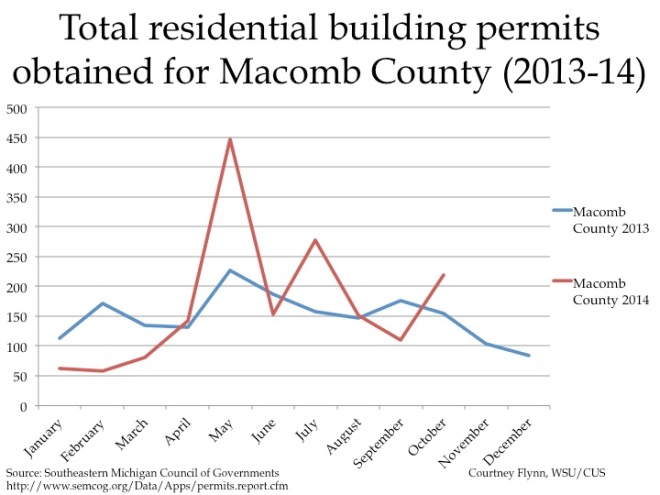
The above charts show the number of residential building permits obtained each month in Oakland, Macomb, and Wayne counties from January 2013 until October 2014. These numbers are reported by local municipalities to the Southeastern Michigan Council of Governments and include single-family units, two-family units, attached condos, and multi-family units.

Oakland and Macomb counties experienced increases in the number of building permits pulled from September 2014 to October 2014. Oakland County issued 173 permits in October, an increase of 39 compared to September, but a decrease of 151 compared to October 2013.

Macomb County issued 219 permits in October 2014, an increase of 119 compared to September 2014 and 65 more permits than it issued in October 2013. Compared to September 2014 in which they pulled 62 permits, Wayne County pulled seven less building permits in October of this year (55). This is three more than the number pulled for the county in October 2013.

Slide16

The above charts show the Standard and Poor’s Case-Shiller Home Price Index for the Detroit Metropolitan Statistical Area. The index includes the price for homes that have sold but does not include the price of new home construction, condos, or homes that have been remodeled.

According to the index, the average price of single-family dwellings sold in Metro Detroit was $95,070 in September 2014. This was an increase of approximately $5,020 from the average price in September 2013. Since May, prices have decreased by $3,820.

 

Michigan’s gubernatorial voter turnout lowest since 1990

Slide02

Michigan’s voter turnout on Nov. 4, 2014 was the lowest in 24 years–41.6 percent. In 1990, voter turnout was 38.6 percent. Four years ago, during the previous gubernatorial race, turnout was 42.9 percent. Considering the data above, it is clear that more voters turn out during presidential elections than during gubernatorial elections—which, in Michigan, occurs during mid-term election years. Within the last 24 years, the highest voter turnout (50.7%) for a mid-term year was recorded during the 2006 general election, in which Gov. Jennifer Granholm, a Democrat, won a second-term.

Voter turnout in primary elections is even lower than in gubernatorial elections. For example, during this year’s primary election, statewide voter turnout was 17.5 percent. The last time it fell below that was in 2006, when only 16.9 percent of voters turned out in the primary.

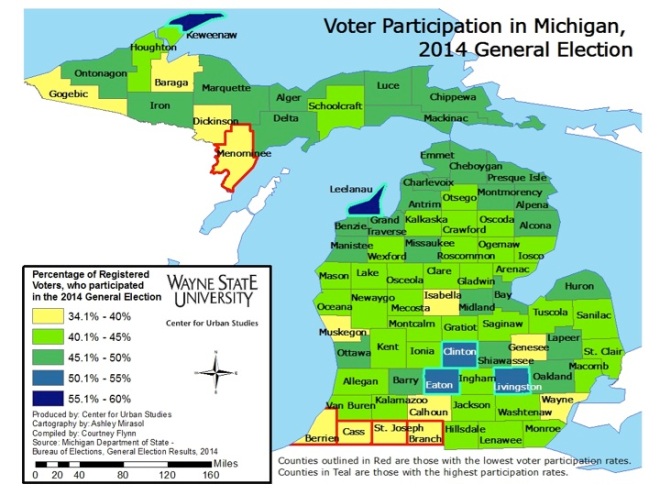
As shown in the map (below), though 2014 general election voter turnout for the entire state of Michigan was 41.6 percent, five of the seven counties in Southeast Michigan had a higher voter turnout. Of those seven counties, Livingston County had the highest voter turnout at 50.2 percent, and also one of the highest percentages of turnout in the state.

According to the Michigan Secretary of State, turnout in only five counties exceeded 50 percent. These top five counties are:

Keweenaw – 59.56% Leelanau – 56.52%   Clinton – 52.72%   Eaton – 50.81%   Livingston – 50.26%

Wayne County had the lowest percentage of voters turnout in the Southeast Michigan region for the 2014 general election (39.2%), but it did not make the list of one of the five counties with the lowest voter turnout in 2014 (it did in 2012 though). According to the Michigan Secretary of State, the five Michigan counties with the lowest voter turnout this November were:

Cass – 34.11%   Menominee – 34.16%   St. Joseph – 34.37%   Berrien – 34.95%   Branch – 35.94%

As seen in the map below, there were 13 total counties where voter turnout was below 40 percent on Nov. 14, 2014. This map also shows that majority of the state fell in the 40.1 to 45 percent range for voter turnout. In the northern part of the state (particularly the Upper Peninsula and the tip of the Lower Peninsula), the average was in the 45.1 to 50 percent range. Of course there were a few exceptions.

Slide04Slide05

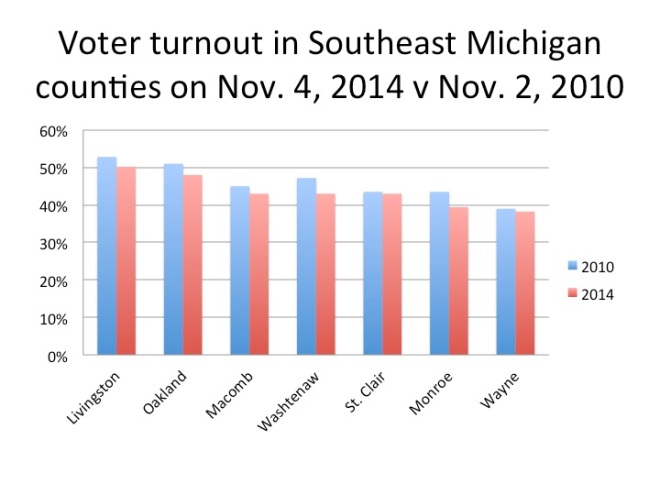
Voter turnout in Wayne County and all the other counties in the Southeast Michigan region was lower than it was in 2010.

For Wayne County, the difference was rather minor, despite the fact the overall voter turnout was low. In 2010, 39 percent of registered voters cast a ballot, compared to the 38.23 percent who voted in 2014, according to records from Michigan Secretary of State.

Monroe County experienced the largest percentage difference. In 2010, 44 percent of registered Monroe County voters cast a ballot and in 2010, 39.4 percent did so—a 4.6 percent difference.

Washtenaw County had the second largest difference: voter turnout was 47 percent in 2010 and 43 percent in 2014, according to the Michigan Secretary of State.

Slide07

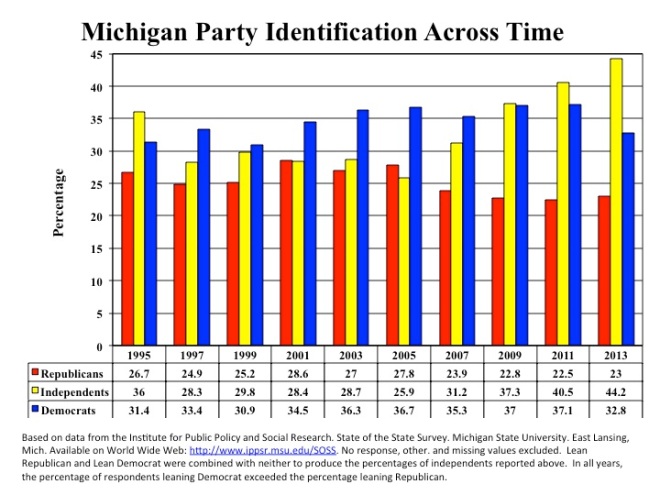
The above chart shows Michigan party identification from 1995-2013. When just comparing Democratic and Republican party identifications, Democrats have maintained an edge over Republicans for nearly two decades. For the decade between 1997 and 2007, Democrats outnumbered Independents as well as Republicans.

In 2013—the most recent non-election year for which data are available—the percentage of registered Michigan voters who identified with the Democratic Party remained higher than those who identified themselves as Republicans. That year, 33 percent of registered voters identified as Democrats; 44 percent identified as Independents, and 23 percent identified as Republicans.

The above chart is based on data from the Institute for Public Policy and Social Research. State of the State Survey. Michigan State University. East Lansing, Mich. Available on Web: http://www.ippsr.msu.edu/SOSS. The variables used were PartyID and sossyr and the data file used is the Longitudinal SOSS Data File. No response, other, and missing values are not included, hence totals do not equal 100%.

Turnout data demonstrate that young voters are among those least likely to vote in mid-term elections. We illustrate this effect in Michigan using Ann Arbor precinct data. (presented below) We have identified the Ann Arbor precincts with an especially high proportion of young, educated voters near the University of Michigan. (These show both the 2012 and 2014 turnout.) Ann Arbor’s precinct-level data reveals that these precincts where large populations of students live had exceptionally low turnout on November 4, 2014. Some of these precincts had 30 percent or more voter turnout in the 2012 presidential election, then had single-digit percent turnout in the 2014 general election. Each of these precincts with high concentrations of students had turnout of less than 15 percent.

There are confounding variables in using these data. Students who registered to vote in the 2012 election may have graduated and moved. But, it should be possible to register new student voters to replace those who have moved away if mobilization efforts are targeted effectively.

Slide10Slide11

In addition to examining the voter turnout near the U of M campus, we explore information from a Web site, CIRCLE, run by Tufts University that reports on research about young voters. According to Tufts, the takeaways related to young voters in this year’s election were:

Slide13

Highland Park has lowest percent of owner occupied housing

According to the Census Bureau, a housing unit is owner-occupied if the owner or co-owner lives in the unit, even if it is mortgaged or not fully paid for. In the seven county Southeastern Michigan region in 2012, the mean owner-occupied percentage was 74.1 percent. At that time, the counties in the region with a percentage of owner occupied homes above the region’s total average were: Livingston, Macomb, Monroe and St. Clair counties. Livingston County had the highest percentage at 85.9 percent; this was also the only county where the percentage of owner-occupied homes was above 80 percent.

PctOwnOcc7CO (1)

In the seven county region, Washtenaw County, which is home to the University of Michigan, had the lowest percentage of owner-occupied homes. Uof M is the largest university in the region, enrolling about 47,000 students on an annual basis. With such a large student population, it can be argued that this contributes to the city of Ann Arbor’s low owner-occupied percentage, which was 45.5 percent in 2012. Also located in Washtenaw County is the charter township of Ypsilanti, which houses Eastern Michigan University and has a lower income population residing within the township. Both these attributes likely play a role in the owner occupied housing percentage of 58.9 percent in Ypsilanti.

Wayne County had the second lowest percentage at 65.6 percent.

PctOwnOccTriCo (1)

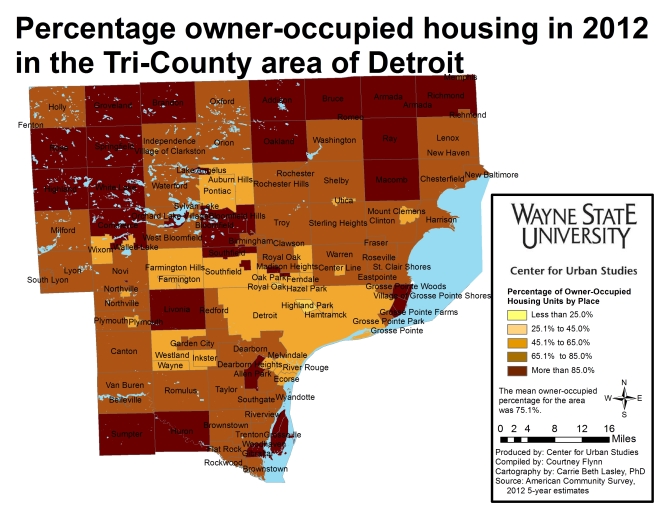
The above map shows the percentage of owner-occupied housing in the tri-county region in 2012. The lower income communities, such as Detroit and the cities of Mount Clemens and Pontiac, were below the regional mean for owner occupied percentage. In contrast, the wealthier communities (like Grosse Ile, Livonia and the Grosse Pointes) and the more rural communities (like the northern half of Macomb County and the southwest portion of Wayne County) have a much higher percentage of owner occupied housing.

To see the median income of communities throughout the Southeast Michigan click here.

PctOwnOccWAYNE

PctOwnOccDET

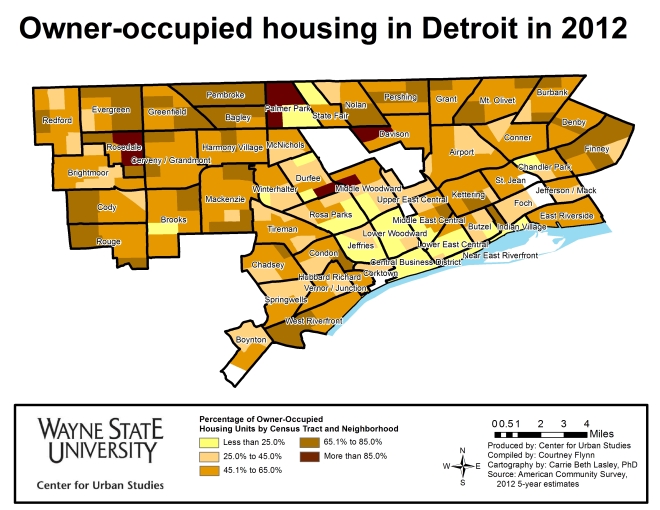
Note that in the downtown area of Detroit, primarily along Woodward Avenue, there is a very low owner occupied housing percentage, below 25 percent. This is because there are dozens of rental housing units along, and in the vicinity of Woodward Avenue, in which owners of the units are more likely to lease out the properties. In the far north of the city, near Palmer Park, an area where the owner occupied housing percentage is below 25 percent appears to be mainly the actual park and cemetery.


Hamtramck had largest family size in region in 2012

According to the American Community Survey, a family is defined as a “group of two people or more (one of whom is the householder) related by birth, marriage, or adoption and residing together; all such people (including related subfamily members) are considered as members of one family.” For this post we are examining the average family size throughout Southeastern Michigan.

In the U.S., the average family size is 3.21 while in Michigan and the Southeast Michigan region that average is 3.13.

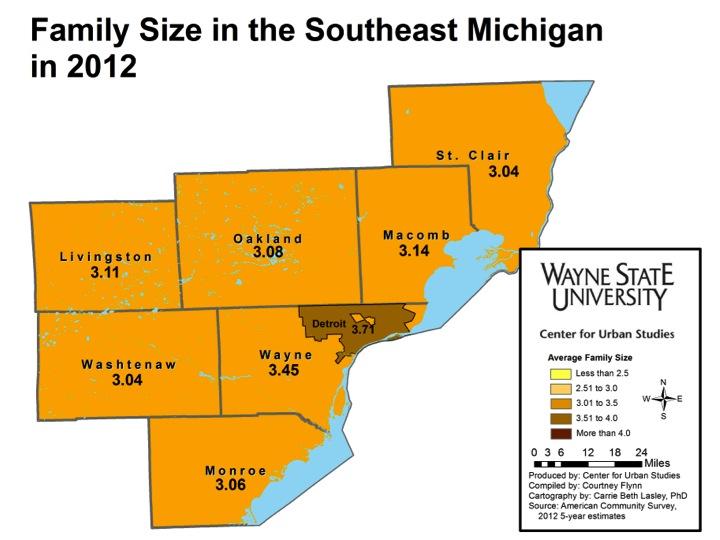
Wayne and Macomb counties were the only two in the region where the average family size in 2012 was above the average for the state and the region. The average family size in Wayne County in 2012 was 3.45, making it the largest in the region, and Macomb County’s was 3.14.

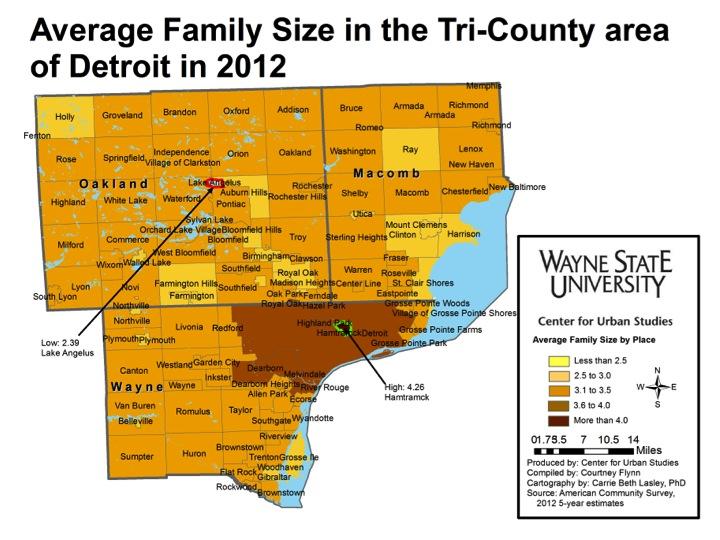
Wayne County’s large average family size can be attributed to the average family sizes of the cities of Detroit and Hamtramck. Hamtramck was the municipality with the largest average family size in the region at 4.26. The city of Detroit had an average family size of 3.71. These family sizes can be linked to the high birth rates in both communities. According to the Michigan Department of Community Healthy, Hamtramck’s birth rate in 2012 was 20 per 1,000 residents and Detroit’s was 14; the state’s was 11.4.

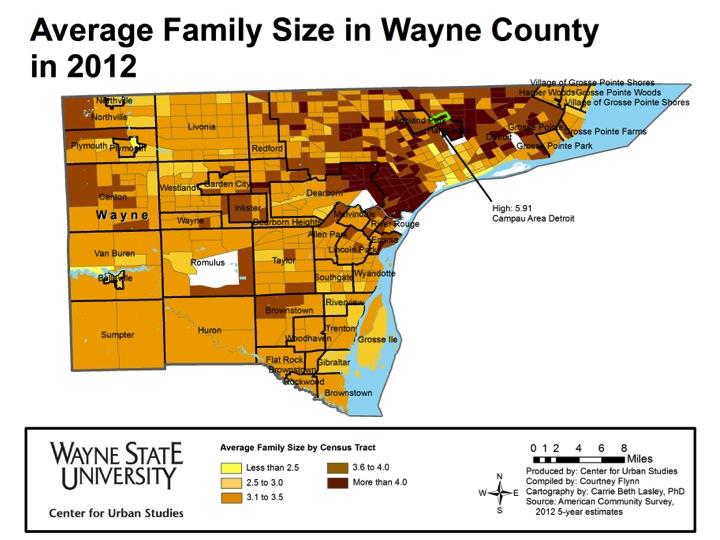
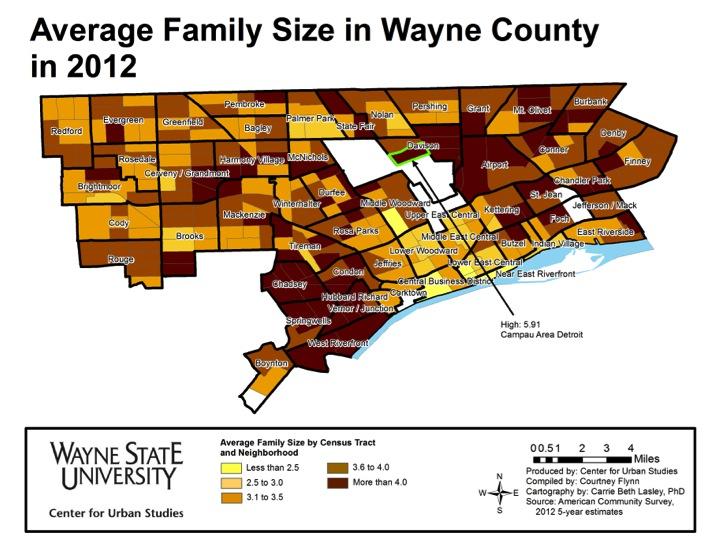
While the city of Hamtramck was the only municipality in the region to have an average family size above 4, there were several Census tracts at or above this threshold. For example, the east side of the city of Dearborn, along with several pockets in the city of Detroit. For example, the Campau Area District in Detroit had an average family size of 5.91.

On the opposite end of the spectrum, St. Clair County had the lowest average family size in the region at 3.04. While the city of Port Huron has a growing population (as we noted in this previous post), St. Clair County is much more rural that the inner tri-county area. Monroe County is also rural and had the second lowest family size in the region at 3.06.

In the tri-county region Lake Angelus, which is located in Oakland County, had the lowest average family size of 2.39. Lake Angelus is the state’s smallest incorporated city. Lake Angelus was one of nine municipalities in the Oakland County where the average family size was less than 2.5. Macomb County had five municipalities where the average family size was less than 2.5 and Wayne County had none.